Home > Comparison > Technology > ON vs LSCC
The strategic rivalry between ON Semiconductor Corporation and Lattice Semiconductor Corporation shapes the semiconductor industry’s future. ON Semiconductor operates as a diversified, capital-intensive leader in intelligent power and sensing solutions, while Lattice Semiconductor focuses on specialized, high-margin programmable logic devices. This analysis pits a broad-based industrial powerhouse against a niche innovator to determine which offers superior risk-adjusted returns for a balanced, technology-focused portfolio.
Table of contents
Companies Overview
ON Semiconductor Corporation and Lattice Semiconductor Corporation stand as pivotal players in the semiconductor industry, each shaping distinct technological frontiers.
ON Semiconductor Corporation: Powering Intelligent Sensing and Electrification
ON Semiconductor leads with its intelligent sensing and power solutions that fuel automotive electrification and sustainable energy. Its revenue primarily stems from analog, discrete, and integrated semiconductor products essential for power switching, signal conditioning, and voltage regulation. In 2026, the company sharpens its focus on expanding electric vehicle capabilities and fast-charging system technology, reinforcing its foothold in green energy innovation.
Lattice Semiconductor Corporation: Innovator in Programmable Logic Devices
Lattice Semiconductor commands its niche through field programmable gate arrays (FPGAs) and video connectivity products. It generates revenue by selling these programmable solutions and licensing technology IP across communications, computing, and automotive markets. In 2026, Lattice intensifies its strategic emphasis on growing its FPGA portfolio, targeting flexible, low-power applications that serve diverse OEM customers globally.
Strategic Collision: Similarities & Divergences
ON Semiconductor and Lattice share a core in semiconductor innovation but diverge sharply in approach. ON drives a broad analog and power solutions ecosystem focused on electrification, while Lattice champions programmable logic with an emphasis on flexibility. Their primary battleground is in automotive and industrial markets where power efficiency meets customization needs. Each presents a unique investment profile: ON as a scale leader in power semiconductors, Lattice as a specialized FPGA innovator.
Income Statement Comparison
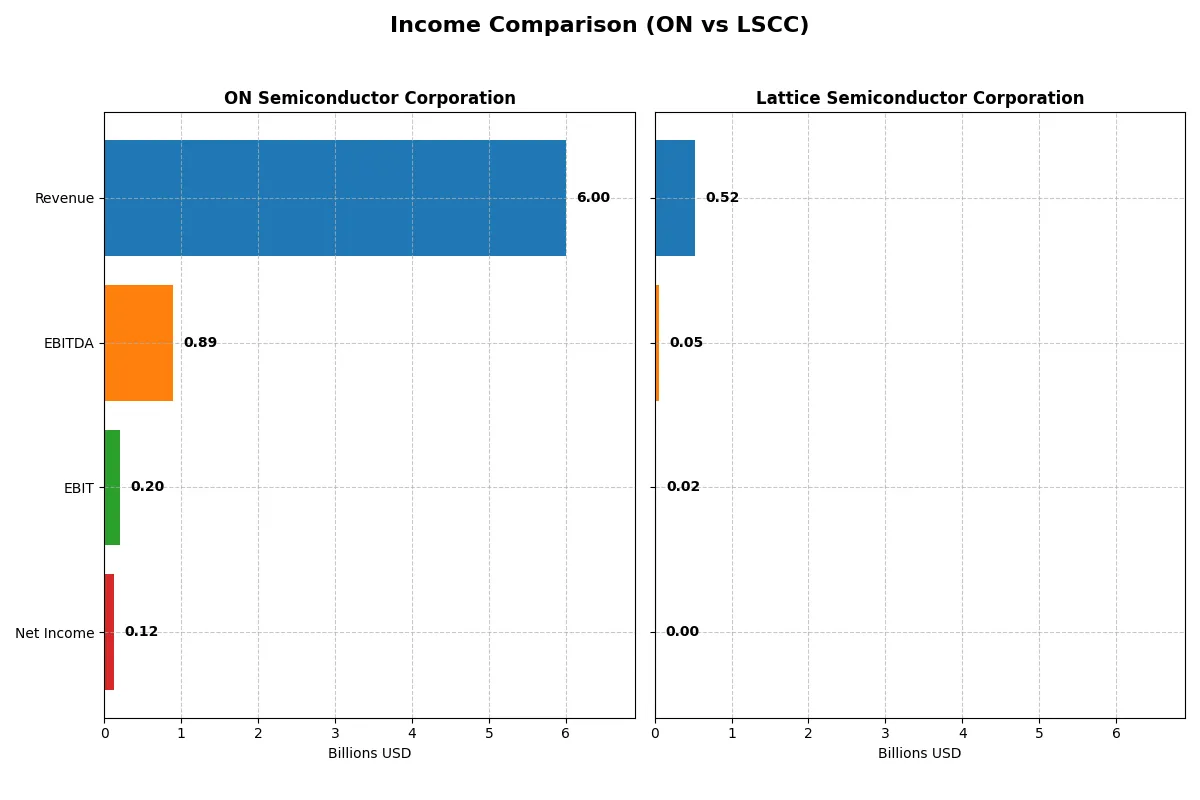
This data dissects the core profitability and scalability of both corporate engines to reveal who dominates the bottom line:
| Metric | ON Semiconductor Corporation (ON) | Lattice Semiconductor Corporation (LSCC) |
|---|---|---|
| Revenue | 5.995B | 523M |
| Cost of Revenue | 4.059B | 166M |
| Operating Expenses | 1.188B | 342M |
| Gross Profit | 1.936B | 357M |
| EBITDA | 888M | 51M |
| EBIT | 202M | 15M |
| Interest Expense | 71M | 3M |
| Net Income | 121M | 3M |
| EPS | 0.29 | 0.02 |
| Fiscal Year | 2025 | 2025 |
Income Statement Analysis: The Bottom-Line Duel
This income statement comparison exposes the true operational efficiency and profit dynamics of two semiconductor firms over recent years.
ON Semiconductor Corporation Analysis
ON Semiconductor’s revenue declined from 8.3B in 2022 to 6.0B in 2025, with net income plunging from 1.9B to 121M. Gross margin remains favorable near 32%, but net margin weakened to 2%. The sharp drop in EBIT and net income in 2025 signals deteriorating operational momentum and margin pressure.
Lattice Semiconductor Corporation Analysis
Lattice Semiconductor’s revenue stayed relatively flat around 500M–520M from 2024 to 2025. Gross margin is robust at 68%, but net margin is slim at 0.6%. Despite stable revenue, net income collapsed from 61M in 2024 to just 3M in 2025, reflecting a steep decline in profitability and EBIT.
Verdict: Margin Strength vs. Profit Collapse
Both firms face unfavorable net income trends, yet ON’s scale dwarfs Lattice’s by over tenfold. ON exhibits stronger gross margins but suffered a sharp profit decline in 2025. Lattice maintains higher gross margins but struggles to convert this into meaningful net profits. Investors seeking scale and margin resilience might lean toward ON, while Lattice’s profile signals caution amid its profitability collapse.
Financial Ratios Comparison
These vital ratios act as a diagnostic tool to expose the underlying fiscal health, valuation premiums, and capital efficiency of the companies compared:
| Ratios | ON Semiconductor Corporation (ON) | Lattice Semiconductor Corporation (LSCC) |
|---|---|---|
| ROE | 1.58% | 0.43% |
| ROIC | 6.24% | 0.47% |
| P/E | 184 | 3496 |
| P/B | 2.90 | 15.10 |
| Current Ratio | 4.52 | 3.09 |
| Quick Ratio | 2.98 | 2.33 |
| D/E | 0.45 | 0.10 |
| Debt-to-Assets | 27.7% | 8.4% |
| Interest Coverage | 10.54 | 5.27 |
| Asset Turnover | 0.48 | 0.61 |
| Fixed Asset Turnover | 1.77 | 4.49 |
| Payout ratio | 0 | 0 |
| Dividend yield | 0 | 0 |
| Fiscal Year | 2025 | 2025 |
Efficiency & Valuation Duel: The Vital Signs
Financial ratios serve as a company’s DNA, uncovering hidden risks and revealing operational strengths unseen in headline numbers. They guide investors through the complex landscape of profitability, valuation, and financial health.
ON Semiconductor Corporation
ON Semiconductor presents weak core profitability with a 1.58% ROE and a net margin of 2.02%, both flagged unfavorable against sector norms. Its P/E ratio of 183.9 signals a stretched valuation relative to earnings. ON offers no dividend, opting instead to reinvest heavily in R&D (9.7% of revenue), aiming for long-term growth despite current profitability challenges.
Lattice Semiconductor Corporation
Lattice Semiconductor struggles with profitability, showing a 0.43% ROE and a net margin of 0.59%, both unfavorable. The valuation is extremely stretched, with a P/E north of 3,400 and a P/B ratio of 15.1, highlighting market expectations detached from current earnings. LSCC also pays no dividend, reinvesting aggressively in R&D (35.9% of revenue) to fuel growth amidst operational inefficiencies.
Premium Valuation vs. Operational Safety
Both companies suffer from weak profitability and no dividend payouts, yet ON Semiconductor offers a more balanced risk profile with a lower P/E and stronger capital structure. ON’s moderate reinvestment contrasts LSCC’s high R&D spend paired with sky-high valuation. Value-seeking investors may find ON’s profile better suited for cautious exposure.
Which one offers the Superior Shareholder Reward?
I observe that neither ON Semiconductor Corporation (ON) nor Lattice Semiconductor Corporation (LSCC) pays dividends. ON focuses on reinvestment with a stable free cash flow per share of around 3.45 in 2025 and a disciplined capex of 0.83 per share, suggesting growth and operational efficiency. Its buybacks are not explicitly reported but the zero dividend payout combined with solid free cash flow coverage indicates potential for share repurchases. LSCC shows lower net profit margins (0.6% in 2025) and free cash flow per share under 1.0, with modest capex (0.31 per share). However, LSCC’s buyback intensity seems limited too, given its high valuation multiples (P/E over 130 in recent years) and no dividend yield. I find ON’s reinvestment strategy more sustainable and likely to generate superior total shareholder returns in 2026, given its stronger free cash flow generation and healthier balance sheet metrics.
Comparative Score Analysis: The Strategic Profile
The radar chart reveals the fundamental DNA and trade-offs of ON Semiconductor and Lattice Semiconductor, highlighting their contrasting strengths and weaknesses:
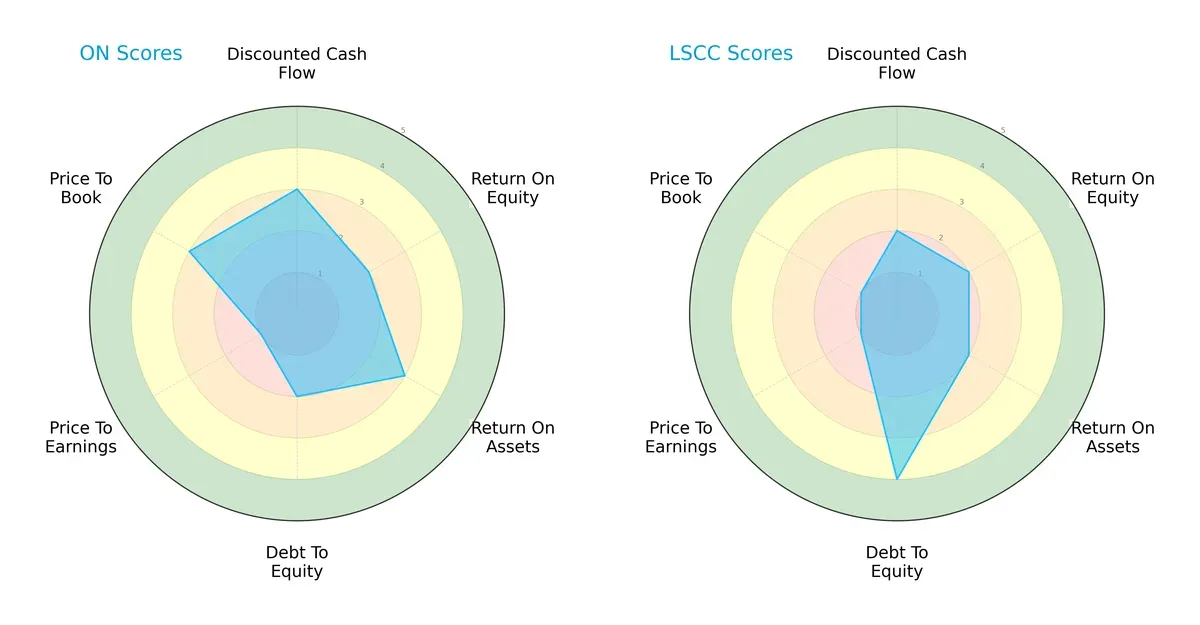
ON Semiconductor shows moderate strength in discounted cash flow and return on assets, but weaker debt management and valuation metrics. Lattice Semiconductor displays a stronger balance sheet with a favorable debt-to-equity score but lags in cash flow and asset efficiency. ON’s profile is more balanced, while Lattice leans heavily on low leverage as its competitive edge.
Bankruptcy Risk: Solvency Showdown
ON Semiconductor’s Altman Z-Score of 5.3 versus Lattice Semiconductor’s extremely high 48.7 places both well within the safe zone:
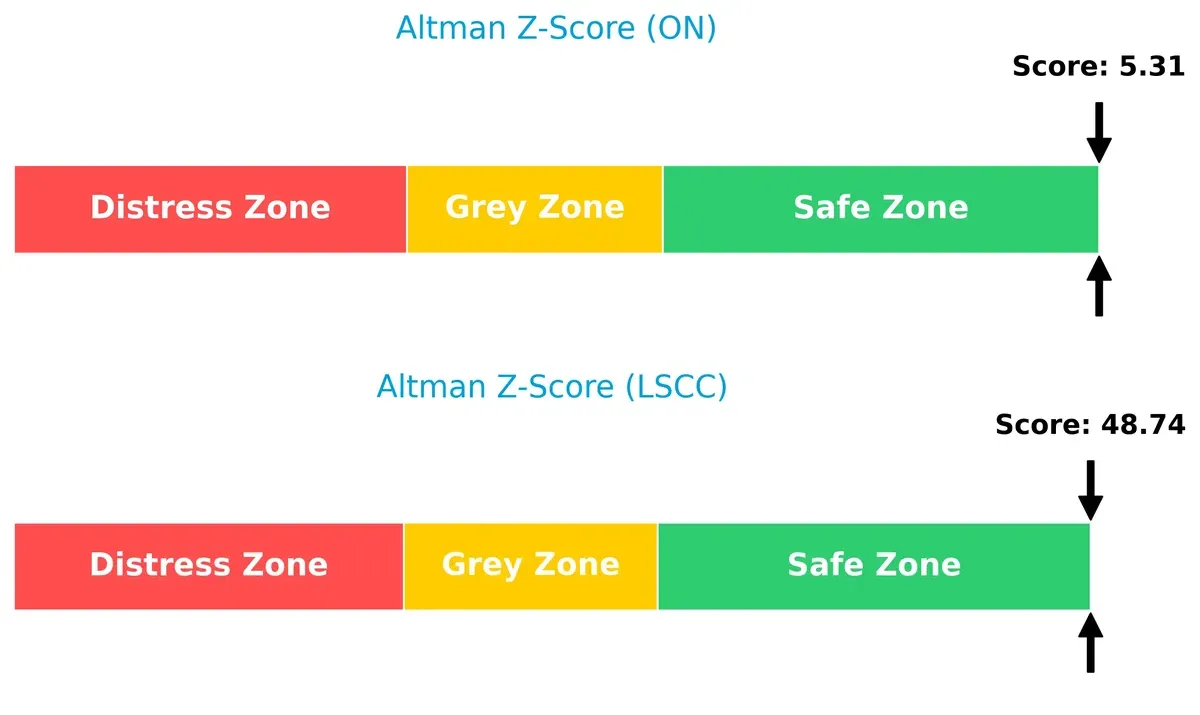
This wide gap signals Lattice’s exceptional financial stability and lower bankruptcy risk, while ON remains solid but more vulnerable in volatile market cycles.
Financial Health: Quality of Operations
Lattice Semiconductor’s Piotroski F-Score of 7 surpasses ON Semiconductor’s 6, indicating stronger internal financial health and operational quality:
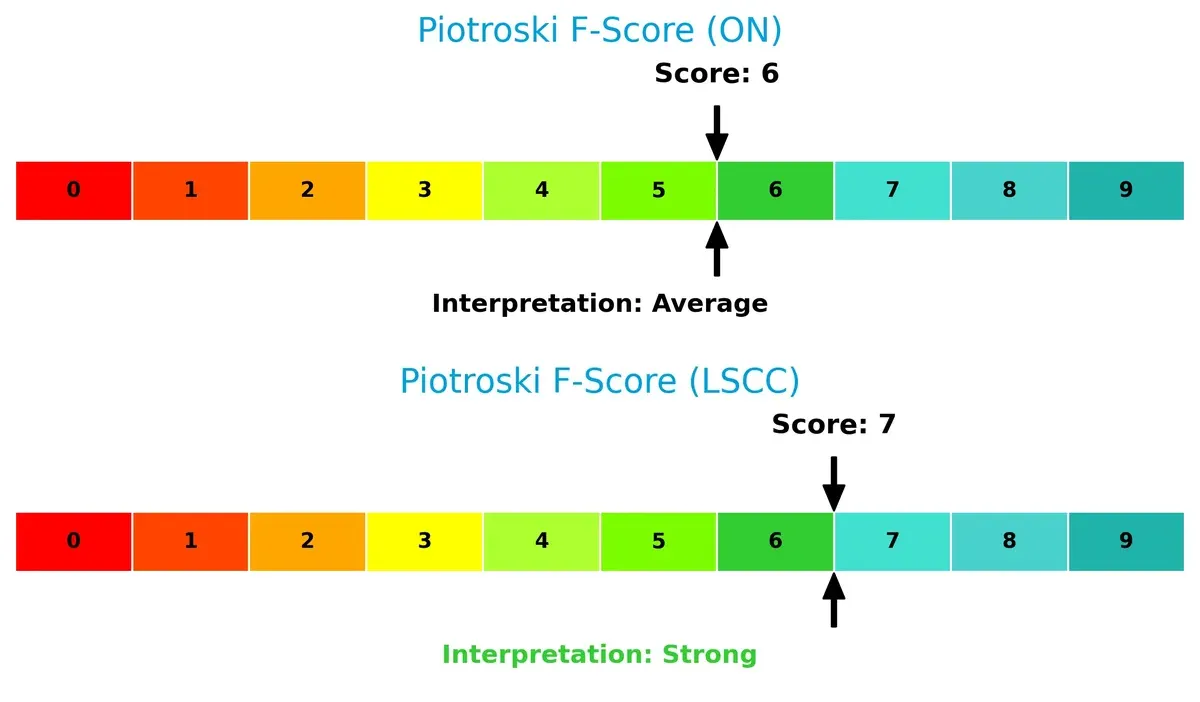
Lattice demonstrates superior profitability, liquidity, and efficiency metrics. ON’s slightly lower score suggests some red flags in internal operations that investors should monitor closely.
How are the two companies positioned?
This section dissects ON and LSCC’s operational DNA by comparing revenue distribution and analyzing their internal strengths and weaknesses. The goal is to confront their economic moats to reveal which model offers the most resilient competitive advantage today.
Revenue Segmentation: The Strategic Mix
This visual comparison dissects how ON Semiconductor and Lattice Semiconductor diversify income streams and reveals where their primary sector bets lie:
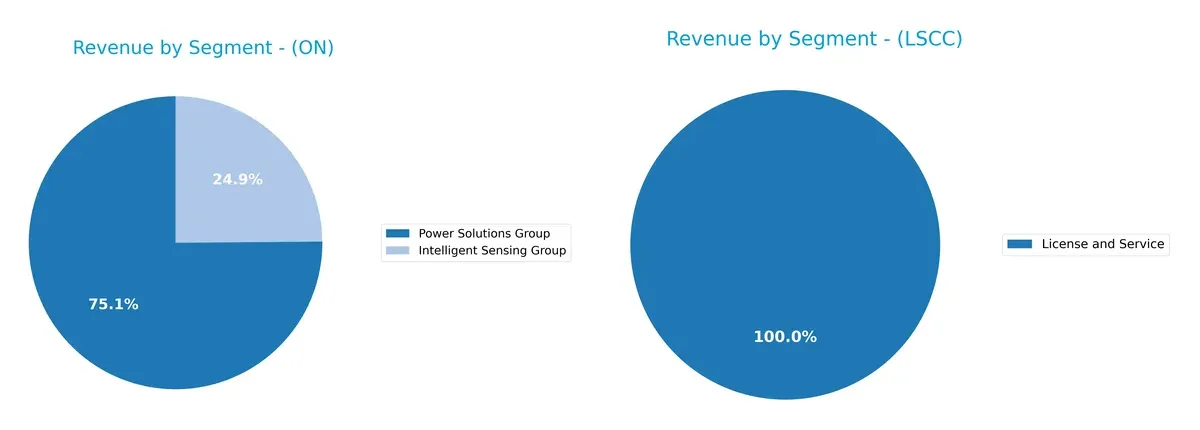
ON Semiconductor anchors revenue in its Power Solutions Group with $2.81B in 2025, while its Intelligent Sensing Group contributes $928M, showing moderate diversification. Conversely, Lattice Semiconductor pivots heavily on Product Revenue from Distributors, totaling $331M in 2018, with License and Service trailing far behind. ON’s broader segment spread suggests stronger ecosystem lock-in; Lattice’s concentration hints at higher concentration risk but potential for focused infrastructure dominance.
Strengths and Weaknesses Comparison
This table compares the strengths and weaknesses of ON Semiconductor Corporation and Lattice Semiconductor Corporation:
ON Strengths
- Diverse revenue streams with multiple product groups
- Strong presence in key global markets including Hong Kong and Singapore
- Favorable quick ratio and debt metrics indicating solid liquidity and leverage control
LSCC Strengths
- Favorable interest coverage and fixed asset turnover show operational efficiency
- Low debt-to-assets ratio supports financial stability
- Presence across Americas, Asia, and Europe diversifies geographic risks
ON Weaknesses
- Unfavorable net margin and ROE indicate weak profitability
- High WACC relative to ROIC suggests value destruction
- Elevated current ratio may signal inefficient asset use
- Very high P/E ratio reflects overvaluation concerns
LSCC Weaknesses
- Weak profitability with low net margin, ROE, and ROIC
- High WACC exceeds returns, risking capital value
- Extremely high P/E and P/B ratios raise valuation red flags
- Limited product diversification compared to ON
ON shows strength in diversified product lines and global presence but faces profitability and valuation challenges. LSCC benefits from operational efficiency and low leverage but contends with profitability deficits and stretched valuations, which could impact strategic flexibility.
The Moat Duel: Analyzing Competitive Defensibility
A structural moat is the only true protection against long-term profit erosion from competitors, revealing each firm’s sustainable advantage:
ON Semiconductor Corporation: Power Solutions Moat
ON’s moat stems from its cost advantage in power semiconductors, reflected in stable gross margins near 32%. However, declining ROIC signals weakening profitability. New automotive electrification markets could deepen its moat if execution improves.
Lattice Semiconductor Corporation: IP Licensing and FPGA Niche
Lattice leverages intangible assets through FPGA technology and IP licensing, driving a superior gross margin of 68%. Yet, its steep ROIC decline threatens moat sustainability. Expanding in communications and automotive could disrupt its competitive edge.
Verdict: Cost Efficiency vs. Intellectual Property Moats
Both firms suffer declining ROIC and value destruction, but ON’s broader market reach and cost position offer a wider moat than Lattice’s narrower IP niche. ON is better poised to defend market share if it stabilizes profitability.
Which stock offers better returns?
The stock price movements over the past year reveal contrasting dynamics, with ON Semiconductor showing a bearish trend overall but a strong recent rally, while Lattice Semiconductor maintains a consistent bullish momentum with accelerating gains.
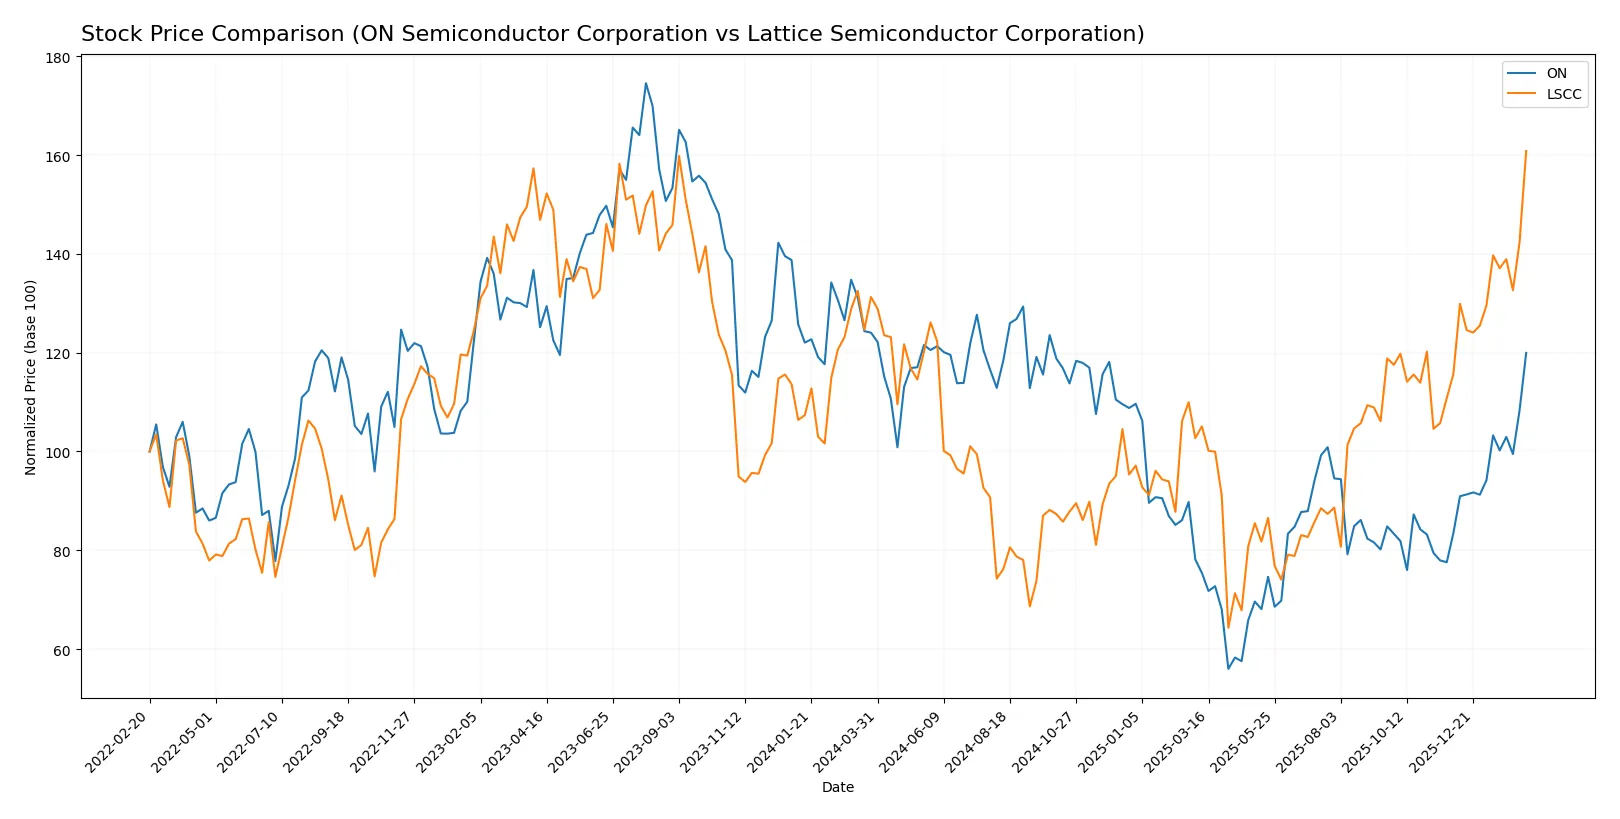
Trend Comparison
ON Semiconductor’s 12-month trend shows a -3.31% decline, marking a bearish trend with accelerating price movement and a wide trading range between 33.7 and 77.87. Recent gains surged 43.73%.
Lattice Semiconductor’s 12-month trend is bullish, rising 22.53% with accelerating momentum and a price range from 39.03 to 97.63. Its recent 39.05% gain confirms continued strong performance.
LSCC outperforms ON over the year with a sustained 22.53% gain versus ON’s -3.31%. Both exhibit recent acceleration, but LSCC delivers the highest market returns overall.
Target Prices
Analysts present a cautiously optimistic consensus for ON Semiconductor Corporation and Lattice Semiconductor Corporation.
| Company | Target Low | Target High | Consensus |
|---|---|---|---|
| ON Semiconductor Corporation | 51 | 75 | 62.4 |
| Lattice Semiconductor Corporation | 80 | 125 | 104.7 |
ON trades near its high target, signaling limited upside for ON Semiconductor. Lattice Semiconductor shows a wider gap, implying stronger growth potential above its current price.

Don’t Let Luck Decide Your Entry Point
Optimize your entry points with our advanced ProRealTime indicators. You’ll get efficient buy signals with precise price targets for maximum performance. Start outperforming now!
How do institutions grade them?
ON Semiconductor Corporation Grades
The following table summarizes recent institutional grades for ON Semiconductor Corporation:
| Grading Company | Action | New Grade | Date |
|---|---|---|---|
| JP Morgan | maintain | Neutral | 2026-02-10 |
| Citigroup | maintain | Neutral | 2026-02-10 |
| Wells Fargo | maintain | Overweight | 2026-02-10 |
| Benchmark | downgrade | Hold | 2026-02-10 |
| Truist Securities | maintain | Hold | 2026-02-10 |
| Cantor Fitzgerald | maintain | Neutral | 2026-02-10 |
| Rosenblatt | maintain | Neutral | 2026-02-10 |
| Piper Sandler | maintain | Overweight | 2026-02-10 |
| Keybanc | maintain | Overweight | 2026-02-10 |
| Mizuho | maintain | Outperform | 2026-02-10 |
Lattice Semiconductor Corporation Grades
Below is a summary of recent institutional grades for Lattice Semiconductor Corporation:
| Grading Company | Action | New Grade | Date |
|---|---|---|---|
| Susquehanna | maintain | Positive | 2026-02-11 |
| Jefferies | maintain | Buy | 2026-02-11 |
| Keybanc | maintain | Overweight | 2026-02-11 |
| Stifel | maintain | Buy | 2026-02-11 |
| Needham | maintain | Buy | 2026-02-11 |
| Benchmark | maintain | Buy | 2026-02-11 |
| RBC Capital | maintain | Outperform | 2026-02-11 |
| Rosenblatt | maintain | Buy | 2026-02-11 |
| Susquehanna | maintain | Positive | 2026-01-22 |
| Keybanc | maintain | Overweight | 2026-01-13 |
Which company has the best grades?
Lattice Semiconductor consistently receives Buy or better ratings, signaling stronger institutional confidence. ON Semiconductor’s grades cluster around Neutral to Overweight, indicating more cautious sentiment. Investors may interpret this as Lattice having a more favorable analyst outlook.
Risks specific to each company
The following categories identify the critical pressure points and systemic threats facing both firms in the 2026 market environment:
1. Market & Competition
ON Semiconductor Corporation
- Operates in diverse semiconductor segments with strong automotive electrification focus; faces intense competition in power solutions.
Lattice Semiconductor Corporation
- Specializes in FPGA and IP licensing; competes in niche markets but contends with rapid innovation and larger rivals.
2. Capital Structure & Debt
ON Semiconductor Corporation
- Moderate debt-to-equity ratio (0.45) with favorable debt-to-assets (27.7%); interest coverage is moderate at 2.85x.
Lattice Semiconductor Corporation
- Very low leverage (debt-to-equity 0.1), strong interest coverage (5.27x), reflecting conservative balance sheet management.
3. Stock Volatility
ON Semiconductor Corporation
- Beta 1.54 indicates higher volatility than market average; stock price range $31–74 shows wide fluctuation.
Lattice Semiconductor Corporation
- Beta 1.67 suggests even higher volatility; price range $35–108 reflects significant market sensitivity.
4. Regulatory & Legal
ON Semiconductor Corporation
- Exposed to regulations in automotive and energy sectors; compliance costs rising with evolving environmental standards.
Lattice Semiconductor Corporation
- Faces regulatory scrutiny related to IP licensing and export controls in global semiconductor trade.
5. Supply Chain & Operations
ON Semiconductor Corporation
- Large workforce (26.4K) and complex multi-segment operations create supply chain risks, amplified by global chip shortages.
Lattice Semiconductor Corporation
- Smaller scale (1.1K employees) but reliant on third-party manufacturers; supply chain disruptions could impact product delivery.
6. ESG & Climate Transition
ON Semiconductor Corporation
- Positioned in sustainable tech with solar and EV components; ESG initiatives critical but increase operational costs.
Lattice Semiconductor Corporation
- ESG pressure rising due to IP licensing and manufacturing footprint; transition risks moderate but growing.
7. Geopolitical Exposure
ON Semiconductor Corporation
- Global operations expose ON to US-China tensions and trade policy risks impacting semiconductor supply chains.
Lattice Semiconductor Corporation
- Also exposed to geopolitical risks, particularly in Asia-Pacific markets, affecting sales and IP enforcement.
Which company shows a better risk-adjusted profile?
ON Semiconductor’s principal risk lies in capital structure and operational complexity amid competitive pressure. Lattice Semiconductor’s key risk centers on valuation extremes and market volatility given its narrow product focus. Despite ON’s higher debt, its diversified segments and stronger Altman Z-score suggest better resilience. Lattice’s sky-high P/E ratio signals overvaluation risk, intensifying downside vulnerability. The recent surge in ON’s quick ratio (2.98) versus Lattice’s more modest 2.33 underlines ON’s superior short-term liquidity. Overall, ON Semiconductor presents a more balanced risk-adjusted profile in 2026.
Final Verdict: Which stock to choose?
ON Semiconductor’s superpower lies in its robust liquidity and conservative leverage, underpinning operational resilience. However, its declining profitability and value destruction are points of vigilance. ON suits portfolios aiming for turnaround opportunities and aggressive growth exposure amid semiconductor cyclicality.
Lattice Semiconductor holds a strategic moat in high-margin niche markets with strong intangible assets and a lean balance sheet. It offers better financial safety than ON but trades at a lofty valuation. LSCC fits investors seeking GARP (Growth at a Reasonable Price) profiles with tolerance for premium pricing.
If you prioritize turnaround potential and can stomach volatility, ON outshines with its cash conversion strength despite profitability erosion. However, if you seek stability and a defensible niche, LSCC offers better balance sheet health and margin durability, though it commands a significant premium. Both require cautious risk management given their value destruction trends.
Disclaimer: Investment carries a risk of loss of initial capital. The past performance is not a reliable indicator of future results. Be sure to understand risks before making an investment decision.
Go Further
I encourage you to read the complete analyses of ON Semiconductor Corporation and Lattice Semiconductor Corporation to enhance your investment decisions: