NVIDIA Corporation and Lattice Semiconductor Corporation are two prominent players in the semiconductor industry, each carving a unique path through innovation and market focus. NVIDIA leads with advanced graphics and AI computing solutions, while Lattice specializes in low-power, field programmable gate arrays for diverse applications. Their overlapping markets and distinct strategies make this comparison crucial. Join me as we explore which company offers the most compelling investment opportunity today.

Table of contents
Companies Overview
I will begin the comparison between NVIDIA and Lattice Semiconductor by providing an overview of these two companies and their main differences.
NVIDIA Overview
NVIDIA Corporation, headquartered in Santa Clara, California, specializes in graphics, compute, and networking solutions globally. Its mission includes advancing gaming, professional visualization, datacenter, and automotive markets through products like GeForce GPUs, AI computing platforms, and autonomous vehicle technology. Founded in 1993, NVIDIA is a leader in the semiconductor industry with a market cap of approximately 4.46T USD and employs around 36,000 people.
Lattice Semiconductor Overview
Lattice Semiconductor Corporation, based in Hillsboro, Oregon, focuses on developing and selling semiconductor solutions such as field programmable gate arrays and video connectivity products. Serving mainly communications, computing, consumer, industrial, and automotive markets, Lattice licenses technology and sells through direct and indirect channels. Since its 1983 inception, it has a market cap near 11.7B USD and a workforce of about 1,110 employees.
Key similarities and differences
Both companies operate in the semiconductor sector and target multiple technology-driven markets including automotive and computing. However, NVIDIA’s business model emphasizes high-performance GPUs and AI-driven platforms with a substantial global footprint and workforce, while Lattice specializes in field programmable devices and technology licensing with a smaller scale and narrower product range. Their market caps and employee counts reflect these distinct operational scopes.
Income Statement Comparison
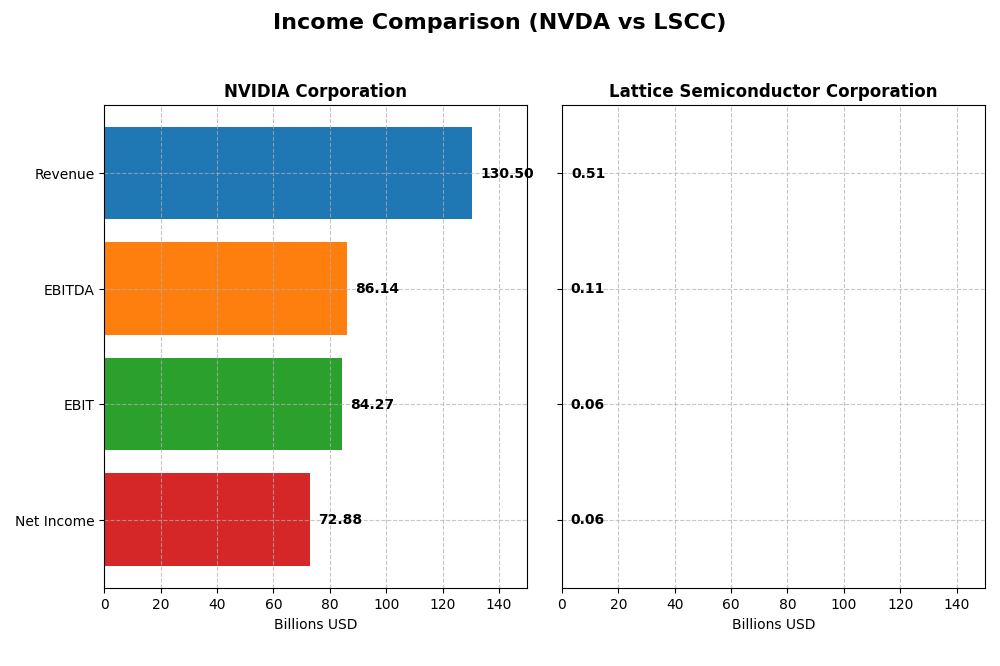
This table presents the latest fiscal year income statement metrics for NVIDIA Corporation and Lattice Semiconductor Corporation, providing a side-by-side financial snapshot.
| Metric | NVIDIA Corporation | Lattice Semiconductor Corporation |
|---|---|---|
| Market Cap | 4.46T | 11.67B |
| Revenue | 130.50B | 509.40M |
| EBITDA | 86.14B | 106.94M |
| EBIT | 84.27B | 60.68M |
| Net Income | 72.88B | 61.13M |
| EPS | 2.97 | 0.44 |
| Fiscal Year | 2025 | 2024 |
Income Statement Interpretations
NVIDIA Corporation
NVIDIA’s revenue and net income have shown strong growth from 2021 to 2025, with revenue surging from $16.7B to $130.5B and net income expanding from $4.3B to $72.9B. Margins have improved notably, with a gross margin of 75% and net margin of 56% in 2025. The latest year reflects accelerated growth and margin expansion, signaling robust operational efficiency.
Lattice Semiconductor Corporation
Lattice Semiconductor’s revenue increased moderately over 2020-2024, from $408M to $509M, with net income rising from $47M to $61M. Margins remain stable but more modest, with a gross margin near 67% and net margin at 12% in 2024. The most recent year saw declines in revenue and profit growth, indicating some short-term challenges despite overall positive trends.
Which one has the stronger fundamentals?
NVIDIA exhibits exceptionally strong fundamentals, with high and improving margins paired with robust double-digit revenue and earnings growth. Lattice Semiconductor shows moderate growth and stable margins but recent annual declines reveal volatility. Overall, NVIDIA’s financial performance and margin improvements suggest stronger and more consistent fundamental metrics.
Financial Ratios Comparison
This table presents a side-by-side comparison of key financial ratios for NVIDIA Corporation and Lattice Semiconductor Corporation, based on their most recent fiscal year data.
| Ratios | NVIDIA Corporation (2025) | Lattice Semiconductor Corporation (2024) |
|---|---|---|
| ROE | 91.9% | 8.6% |
| ROIC | 75.3% | 4.6% |
| P/E | 39.9 | 132.7 |
| P/B | 36.7 | 11.4 |
| Current Ratio | 4.44 | 3.66 |
| Quick Ratio | 3.88 | 2.62 |
| D/E (Debt-to-Equity Ratio) | 0.13 | 0.02 |
| Debt-to-Assets | 9.2% | 1.8% |
| Interest Coverage | 329.8 | 129.5 |
| Asset Turnover | 1.17 | 0.60 |
| Fixed Asset Turnover | 16.16 | 7.62 |
| Payout Ratio | 1.14% | 0% |
| Dividend Yield | 0.029% | 0% |
Interpretation of the Ratios
NVIDIA Corporation
NVIDIA shows strong profitability with a net margin of 55.85% and very high returns on equity (91.87%) and invested capital (75.28%), indicating efficient capital use. Concerns arise from high valuation ratios—PE at 39.9 and PB at 36.66—and an elevated current ratio of 4.44, suggesting potential liquidity inefficiency. The company pays a minimal dividend with a yield of 0.03%, a very low payout that reflects cautious distribution alongside strong free cash flow coverage and buybacks.
Lattice Semiconductor Corporation
Lattice Semiconductor presents a moderate net margin of 12.0% but weaker returns, with ROE at 8.6% and ROIC at 4.59%, signaling less efficient capital utilization. The company has a very high PE of 132.74 and PB of 11.41, both unfavorable, and a current ratio of 3.66. It does not pay dividends, reflecting possible reinvestment in R&D or growth strategies, supported by positive free cash flow and low debt levels that maintain financial stability.
Which one has the best ratios?
NVIDIA exhibits a more favorable overall ratio profile, with 64.29% of ratios rated positively, particularly in profitability and capital returns, despite some valuation and liquidity concerns. Lattice Semiconductor has a less favorable profile, with nearly half its ratios unfavorable and weaker returns, though it maintains strong liquidity and low leverage. Based purely on these financial ratios, NVIDIA appears stronger.
Strategic Positioning
This section compares the strategic positioning of NVIDIA Corporation and Lattice Semiconductor Corporation, including market position, key segments, and exposure to technological disruption:
NVIDIA Corporation
- Dominant market cap of $4.5T with high competitive pressure in semiconductors
- Diverse segments: Data Center $115B, Gaming $11.4B, Automotive $1.7B, plus professional visualization
- Strong exposure to AI, HPC, autonomous driving, and cloud computing disruptions
Lattice Semiconductor Corporation
- Market cap of $11.7B facing moderate competition in niche FPGA market
- Focus on FPGA products and licensing, serving communications, computing, industrial, and automotive
- Limited exposure, mainly focused on FPGA innovation and IP licensing disruptions
NVIDIA vs Lattice Semiconductor Positioning
NVIDIA has a diversified business model with significant revenue streams across multiple high-growth segments, while Lattice is more concentrated on FPGA products and licensing. NVIDIA’s scale offers broader market reach, unlike Lattice’s more specialized focus with smaller revenue base.
Which has the best competitive advantage?
NVIDIA’s very favorable moat with high ROIC above WACC and growing profitability indicates a durable competitive advantage. Lattice’s very unfavorable moat reflects declining ROIC and value destruction, signaling weaker competitive positioning.
Stock Comparison
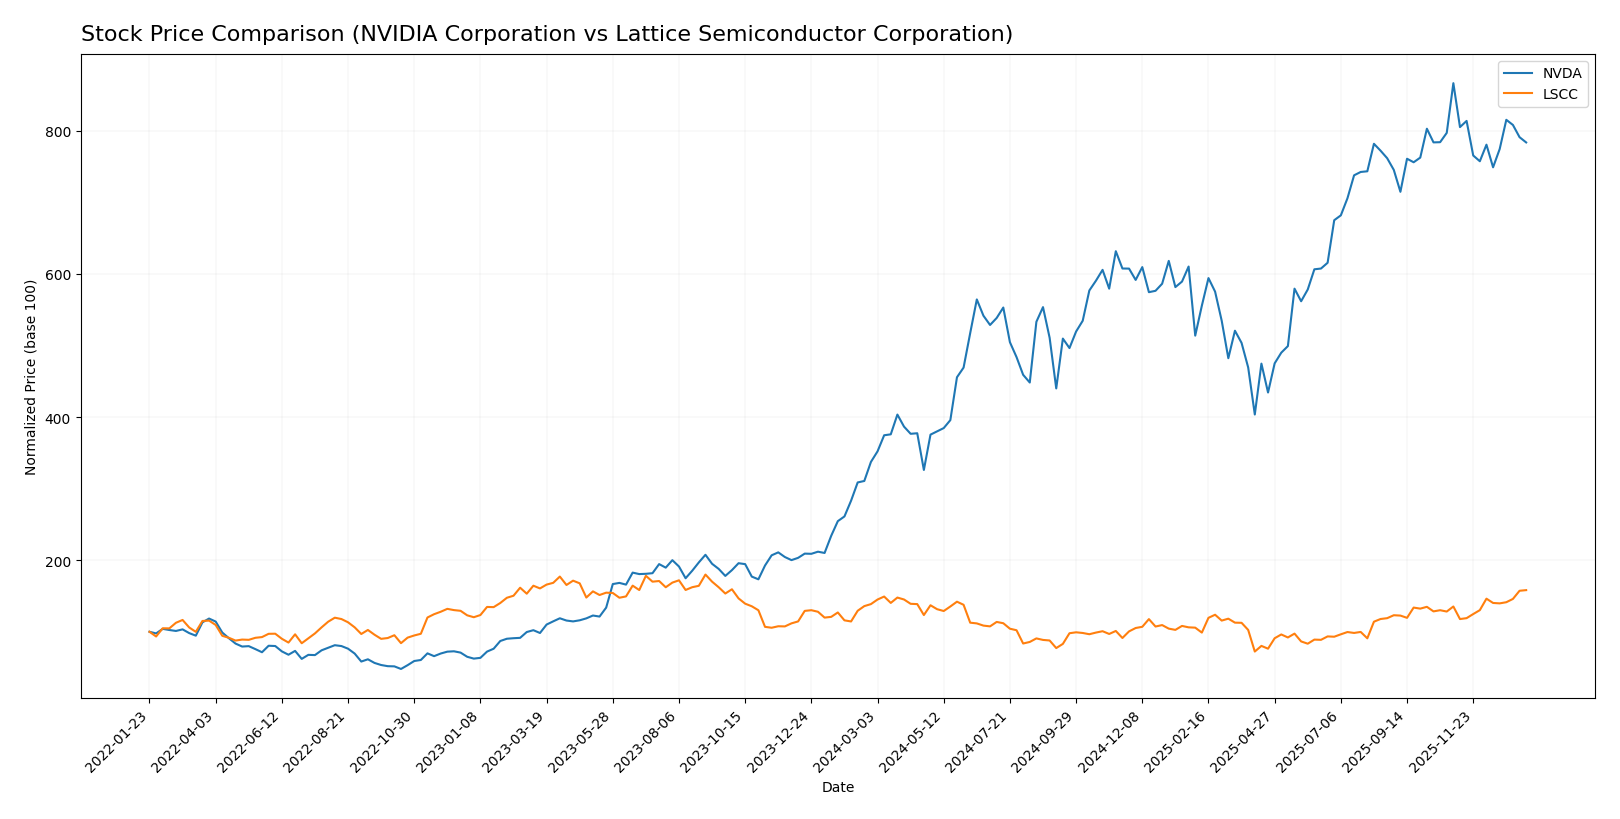
The stock price chart over the past 12 months reveals significant bullish momentum for NVIDIA Corporation with a notable deceleration, while Lattice Semiconductor Corporation shows a steady bullish trend with accelerating gains.
Trend Analysis
NVIDIA Corporation’s stock recorded a 132.35% increase over the past year, indicating a strong bullish trend with deceleration. The price ranged from a low of 76.2 to a high of 202.49, with high volatility (std deviation 32.46). Recent months saw a -9.56% decline with a slight downward slope.
Lattice Semiconductor Corporation’s stock gained 14.09% in the same period, reflecting a bullish trend with acceleration. The price fluctuated between 39.03 and 85.28, with moderate volatility (std deviation 11.01). Recently, it surged 16.89%, showing strong upward momentum.
Comparing both stocks, NVIDIA delivered the highest market performance over the past year despite recent softness, outperforming Lattice Semiconductor’s more moderate but accelerating gains.
Target Prices
Analyst consensus indicates promising upside potential for these semiconductor stocks.
| Company | Target High | Target Low | Consensus |
|---|---|---|---|
| NVIDIA Corporation | 352 | 140 | 264.34 |
| Lattice Semiconductor Corporation | 105 | 65 | 83 |
For NVIDIA, the consensus target price of 264.34 USD suggests significant appreciation potential from the current 183.14 USD. Lattice Semiconductor’s consensus target of 83 USD is slightly below its current price of 85.28 USD, indicating a more cautious outlook.
Analyst Opinions Comparison
This section compares analysts’ ratings and financial scores for NVIDIA Corporation and Lattice Semiconductor Corporation:
Rating Comparison
NVIDIA Corporation Rating
- Rating: B+, considered very favorable by analysts.
- Discounted Cash Flow Score: 3, indicating moderate value.
- Return on Equity Score: 5, very favorable efficiency.
- Return on Assets Score: 5, very favorable asset use.
- Debt To Equity Score: 3, moderate financial risk.
Lattice Semiconductor Corporation Rating
- Rating: B-, also considered very favorable.
- Discounted Cash Flow Score: 3, indicating moderate value.
- Return on Equity Score: 2, moderate efficiency.
- Return on Assets Score: 3, moderate asset use.
- Debt To Equity Score: 4, indicating favorable financial risk.
Which one is the best rated?
NVIDIA holds a higher overall rating (B+) and superior ROE and ROA scores compared to Lattice Semiconductor, which has a lower overall rating (B-) and moderate efficiency scores. This suggests NVIDIA is better rated based strictly on the provided data.
Scores Comparison
The following table presents a comparison of the Altman Z-Score and Piotroski Score for NVIDIA and Lattice Semiconductor:
NVDA Scores
- Altman Z-Score: 68.04, indicating a strong safe zone.
- Piotroski Score: 6, reflecting average financial health.
LSCC Scores
- Altman Z-Score: 52.69, also in the safe zone.
- Piotroski Score: 5, reflecting average financial health.
Which company has the best scores?
Both companies are well within the safe zone according to their Altman Z-Scores, with NVIDIA scoring higher. Their Piotroski Scores are close, with NVIDIA slightly ahead, indicating similar average financial health.
Grades Comparison
I present below the recent grades and ratings for NVIDIA Corporation and Lattice Semiconductor Corporation:
NVIDIA Corporation Grades
This table summarizes the latest grades assigned by recognized grading companies for NVIDIA Corporation:
| Grading Company | Action | New Grade | Date |
|---|---|---|---|
| Mizuho | Maintain | Outperform | 2026-01-09 |
| Truist Securities | Maintain | Buy | 2025-12-29 |
| Stifel | Maintain | Buy | 2025-12-29 |
| B of A Securities | Maintain | Buy | 2025-12-26 |
| Baird | Maintain | Outperform | 2025-12-26 |
| Bernstein | Maintain | Outperform | 2025-12-26 |
| Truist Securities | Maintain | Buy | 2025-12-19 |
| Tigress Financial | Maintain | Strong Buy | 2025-12-18 |
| Morgan Stanley | Maintain | Overweight | 2025-12-01 |
| Deutsche Bank | Maintain | Hold | 2025-11-20 |
NVIDIA’s grades predominantly indicate strong confidence, with most analysts maintaining Buy or Outperform ratings, including a Strong Buy and an Overweight rating.
Lattice Semiconductor Corporation Grades
This table summarizes the latest grades assigned by recognized grading companies for Lattice Semiconductor Corporation:
| Grading Company | Action | New Grade | Date |
|---|---|---|---|
| Keybanc | Maintain | Overweight | 2026-01-13 |
| Stifel | Maintain | Buy | 2025-11-04 |
| Baird | Maintain | Outperform | 2025-11-04 |
| Needham | Maintain | Buy | 2025-11-04 |
| Rosenblatt | Maintain | Buy | 2025-11-04 |
| Benchmark | Maintain | Buy | 2025-11-04 |
| Susquehanna | Maintain | Positive | 2025-10-22 |
| Keybanc | Maintain | Overweight | 2025-09-30 |
| Needham | Maintain | Buy | 2025-09-22 |
| Benchmark | Maintain | Buy | 2025-09-11 |
Lattice Semiconductor’s grades consistently reflect positive sentiment, with multiple Buy and Overweight ratings and a notable Outperform from Baird.
Which company has the best grades?
Both NVIDIA and Lattice Semiconductor have predominantly Buy and Outperform grades, but NVIDIA displays a broader consensus including Strong Buy and Overweight ratings. This suggests NVIDIA may be viewed as having a stronger or more confident outlook, potentially influencing investor sentiment and portfolio positioning.
Strengths and Weaknesses
Below is a comparative overview of key strengths and weaknesses between NVIDIA Corporation and Lattice Semiconductor Corporation based on the most recent financial and operational data.
| Criterion | NVIDIA Corporation (NVDA) | Lattice Semiconductor Corporation (LSCC) |
|---|---|---|
| Diversification | Highly diversified with strong revenue streams in Data Center (115B), Gaming (11.35B), Automotive (1.69B), and Professional Visualization (1.88B) | Limited diversification; primary revenue from License and Service (~17M) with smaller product sales |
| Profitability | Very high profitability: Net margin 55.85%, ROIC 75.28%, ROE 91.87% | Moderate profitability: Net margin 12%, ROIC 4.59%, ROE 8.6% |
| Innovation | Industry leader with durable competitive advantage and rapidly growing ROIC (+339%) | Struggling with declining ROIC (-44%) and value destruction |
| Global presence | Strong global footprint supported by large-scale data center and automotive contracts | Smaller scale and less global reach |
| Market Share | Leading position in GPUs and AI accelerators with growing market dominance | Niche player with limited market share and slower growth |
Key takeaways: NVIDIA demonstrates robust diversification, exceptional profitability, and a durable competitive moat with expanding market share and innovation capabilities. In contrast, Lattice Semiconductor faces challenges with limited diversification, declining profitability, and a weaker competitive position, signaling higher investment risk.
Risk Analysis
Below is a comparison of key risk factors for NVIDIA Corporation and Lattice Semiconductor Corporation based on the most recent data available for 2025 and 2024 respectively:
| Metric | NVIDIA Corporation (NVDA) | Lattice Semiconductor Corporation (LSCC) |
|---|---|---|
| Market Risk | High beta (2.314) indicates higher volatility | Moderate beta (1.716) shows moderate market sensitivity |
| Debt level | Low debt-to-equity (0.13), strong interest coverage (341.19) | Very low debt-to-equity (0.02), strong interest coverage (228.11) |
| Regulatory Risk | Moderate, due to global operations including China and Taiwan | Moderate, with exposure in Asia and Americas markets |
| Operational Risk | Large-scale operations with 36K employees; high asset turnover | Smaller scale with 1.1K employees; moderate asset turnover |
| Environmental Risk | Moderate; tech sector scrutiny on supply chain and energy use | Moderate; semiconductor manufacturing environmental impact |
| Geopolitical Risk | High due to presence in Taiwan and China, sensitive to US-China tensions | Moderate; exposure to global supply chains but less concentrated |
NVIDIA faces notable market and geopolitical risks due to its global footprint, especially in Taiwan and China, which could impact supply chains and regulatory conditions. Its low debt mitigates financial risk. Lattice Semiconductor has lower market volatility and debt levels but operates on a smaller scale, which may limit its resilience. Both companies have moderate regulatory and environmental risks typical of the semiconductor industry. The most impactful risk remains NVIDIA’s geopolitical exposure given current global tensions.
Which Stock to Choose?
NVIDIA Corporation (NVDA) shows a robust income evolution with a 114.2% revenue growth in the last year and a 682.6% increase over five years. Its profitability is high, with a 55.85% net margin and strong returns on equity (91.87%) and invested capital (75.28%). Debt levels are low, and its financial ratios are mostly favorable, supporting a very favorable overall rating and a durable competitive advantage with a very favorable moat evaluation.
Lattice Semiconductor Corporation (LSCC) presents a mixed income evolution, with a recent 30.9% revenue decline but a 24.8% growth over the medium term. Profitability is modest, with a 12.0% net margin and lower returns on equity (8.6%) and invested capital (4.6%). The company maintains low debt and some favorable financial ratios, yet the overall rating is slightly less favorable, and its moat evaluation is very unfavorable due to declining profitability.
Considering their ratings and comprehensive financial profiles, NVDA’s strong income growth, high profitability, and durable moat suggest it might appeal to investors with a growth or quality focus. Conversely, LSCC’s profile with moderate profitability and recent setbacks might be more suited to investors willing to tolerate volatility or seeking value opportunities with caution.
Disclaimer: Investment carries a risk of loss of initial capital. The past performance is not a reliable indicator of future results. Be sure to understand risks before making an investment decision.
Go Further
I encourage you to read the complete analyses of NVIDIA Corporation and Lattice Semiconductor Corporation to enhance your investment decisions: