Home > Comparison > Technology > LSCC vs NVEC
The strategic rivalry between Lattice Semiconductor Corporation and NVE Corporation shapes key innovation dynamics in the semiconductor sector. Lattice operates as a capital-intensive developer of field programmable gate arrays, serving diverse industrial markets. In contrast, NVE specializes in niche spintronic sensor technology with a lean operational model focused on factory automation and medical applications. This analysis will assess which company’s trajectory offers superior risk-adjusted returns for a diversified portfolio amid evolving tech demands.
Table of contents
Companies Overview
Lattice Semiconductor Corporation and NVE Corporation represent distinct forces in the semiconductor sector, each advancing unique technologies.
Lattice Semiconductor Corporation: FPGA Innovator for Diverse Markets
Lattice Semiconductor Corporation dominates the programmable logic device market with its field programmable gate arrays. Its core revenue derives from selling multiple FPGA product families and video connectivity chips to OEMs across communications, computing, consumer, and industrial sectors. In 2026, Lattice emphasizes expanding its Certus-NX FPGA portfolio, aiming to capture growth in low-power, high-performance applications.
NVE Corporation: Spintronics Pioneer with Niche Focus
NVE Corporation leads in spintronic sensor technology, utilizing electron spin to enhance data acquisition and transmission. It primarily generates revenue from magnetic and metallic material sensors deployed in factory automation and medical devices. NVE’s 2026 strategy centers on scaling its spintronic couplers for the Industrial Internet of Things and advancing licensing of magnetoresistive RAM technologies.
Strategic Collision: Similarities & Divergences
Lattice embraces a broad FPGA ecosystem serving multiple industries, while NVE pursues a specialized spintronics niche. Their competition lies in offering innovative semiconductor solutions but targets different end markets and technologies. Lattice’s scale and diversified portfolio contrast with NVE’s focused innovation, creating distinct risk and reward profiles for investors.
Income Statement Comparison
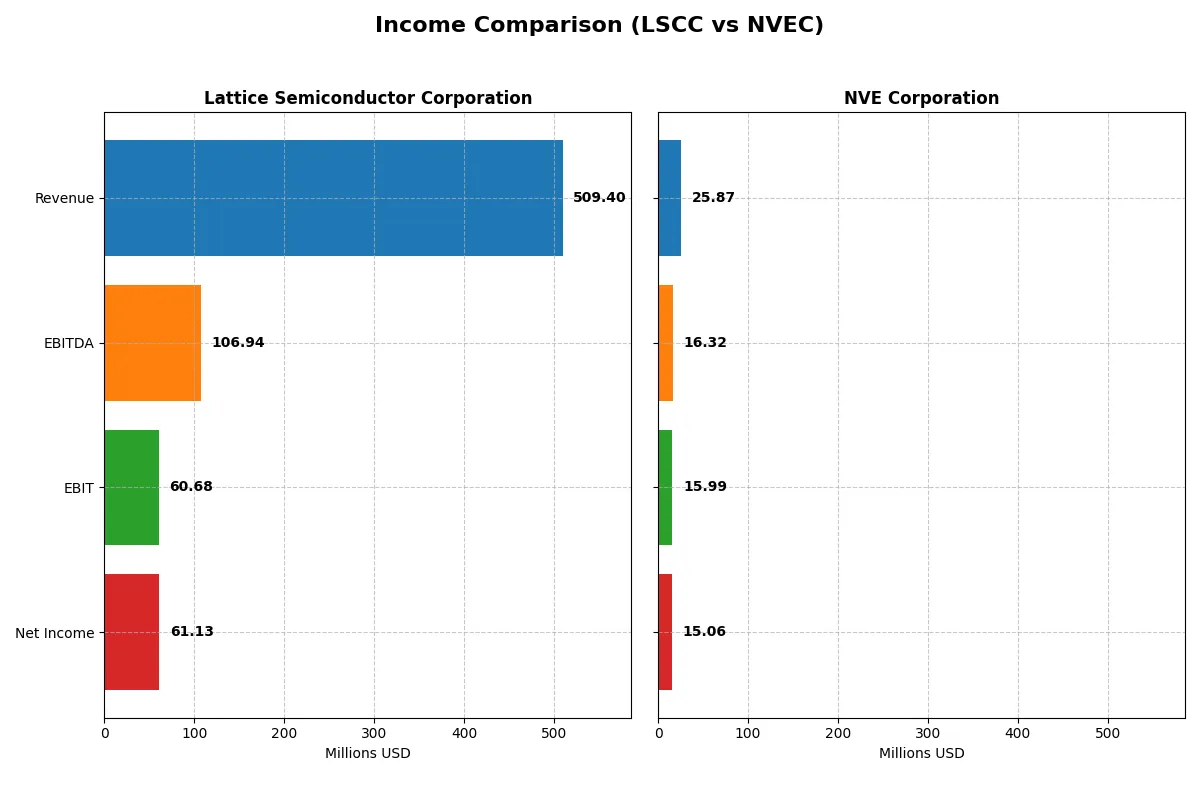
This table dissects the core profitability and scalability of both corporate engines, revealing who dominates the bottom line in the most recent fiscal year:
| Metric | Lattice Semiconductor Corporation (LSCC) | NVE Corporation (NVEC) |
|---|---|---|
| Revenue | 509M | 25.9M |
| Cost of Revenue | 169M | 4.24M |
| Operating Expenses | 306M | 5.64M |
| Gross Profit | 340M | 21.6M |
| EBITDA | 107M | 16.3M |
| EBIT | 61M | 16.0M |
| Interest Expense | 0.27M | 0 |
| Net Income | 61M | 15.1M |
| EPS | 0.44 | 3.12 |
| Fiscal Year | 2024 | 2025 |
Income Statement Analysis: The Bottom-Line Duel
This income statement comparison reveals the true efficiency and profitability trajectory of Lattice Semiconductor Corporation and NVE Corporation.
Lattice Semiconductor Corporation Analysis
Lattice Semiconductor’s revenue grew 25% over five years but fell 31% last year to $509M. Net income followed a similar pattern, peaking at $259M in 2023 then dropping sharply to $61M in 2024. Gross margin remains healthy at 66.8%, but net margin declined to 12%, signaling pressure on overall profitability and momentum.
NVE Corporation Analysis
NVE’s revenue advanced 21% over five years but declined 13% last year to $26M. Net income dropped to $15M in 2025 from $17M in 2024. Despite this, margins impress: gross margin stands at 83.6%, and net margin is a robust 58.2%, reflecting strong operational efficiency and capital-light business dynamics.
Margin Strength vs. Revenue Scale
NVE leads with superior margins and consistent profitability despite smaller scale and recent revenue softness. Lattice offers higher revenue but weaker margin resilience and sharper recent profit declines. Investors seeking lean, margin-rich profiles may prefer NVE’s model over Lattice’s larger yet more volatile earnings base.
Financial Ratios Comparison
These vital ratios act as a diagnostic tool to expose the underlying fiscal health, valuation premiums, and capital efficiency of the companies analyzed:
| Ratios | Lattice Semiconductor (LSCC) | NVE Corporation (NVEC) |
|---|---|---|
| ROE | 8.60% (2024) | 24.19% (2025) |
| ROIC | 4.59% (2024) | 21.14% (2025) |
| P/E | 133x (2024) | 20.46x (2025) |
| P/B | 11.41x (2024) | 4.95x (2025) |
| Current Ratio | 3.66 (2024) | 28.40 (2025) |
| Quick Ratio | 2.62 (2024) | 22.03 (2025) |
| D/E | 0.02 (2024) | 0.01 (2025) |
| Debt-to-Assets | 1.81% (2024) | 1.43% (2025) |
| Interest Coverage | 130x (2024) | N/A |
| Asset Turnover | 0.60 (2024) | 0.40 (2025) |
| Fixed Asset Turnover | 7.62 (2024) | 8.91 (2025) |
| Payout ratio | 0% (2024) | 128% (2025) |
| Dividend yield | 0% (2024) | 6.28% (2025) |
| Fiscal Year | 2024 | 2025 |
Efficiency & Valuation Duel: The Vital Signs
Financial ratios act as a company’s DNA, exposing hidden risks and revealing operational excellence that shapes investor decisions.
Lattice Semiconductor Corporation
Lattice Semiconductor shows moderate profitability with an 8.6% ROE and a 12% net margin, yet its valuation is stretched with a P/E of 132.7 and P/B over 11. The firm retains earnings, investing heavily in R&D (31% of revenue) to fuel growth. It pays no dividend, signaling a focus on reinvestment rather than immediate shareholder payouts.
NVE Corporation
NVE delivers strong profitability, boasting a 24.2% ROE and a 58.2% net margin, with a more reasonable P/E of 20.5. Despite a high current ratio of 28.4, it maintains favorable leverage and covers interest comfortably. NVE offers a 6.3% dividend yield, balancing shareholder returns with steady operational efficiency and solid capital allocation.
Growth Ambition vs. Dividend Stability
NVE’s robust profitability and moderate valuation offer a better risk-reward balance than Lattice’s stretched multiples and reinvestment-heavy profile. Investors seeking income and operational efficiency may prefer NVE, while those prioritizing growth through R&D might lean toward Lattice.
Which one offers the Superior Shareholder Reward?
Lattice Semiconductor (LSCC) pays no dividends, focusing on reinvestment with a 0% payout and no buybacks. In contrast, NVE Corporation (NVEC) yields 4.5–6.3% with full dividend coverage and robust buybacks boosting total returns. NVEC’s high margins and strong cash flow underpin a sustainable, shareholder-friendly model. I favor NVEC for superior total shareholder reward in 2026.
Comparative Score Analysis: The Strategic Profile
The radar chart reveals the fundamental DNA and trade-offs of Lattice Semiconductor Corporation and NVE Corporation, highlighting their distinct financial strengths and weaknesses:
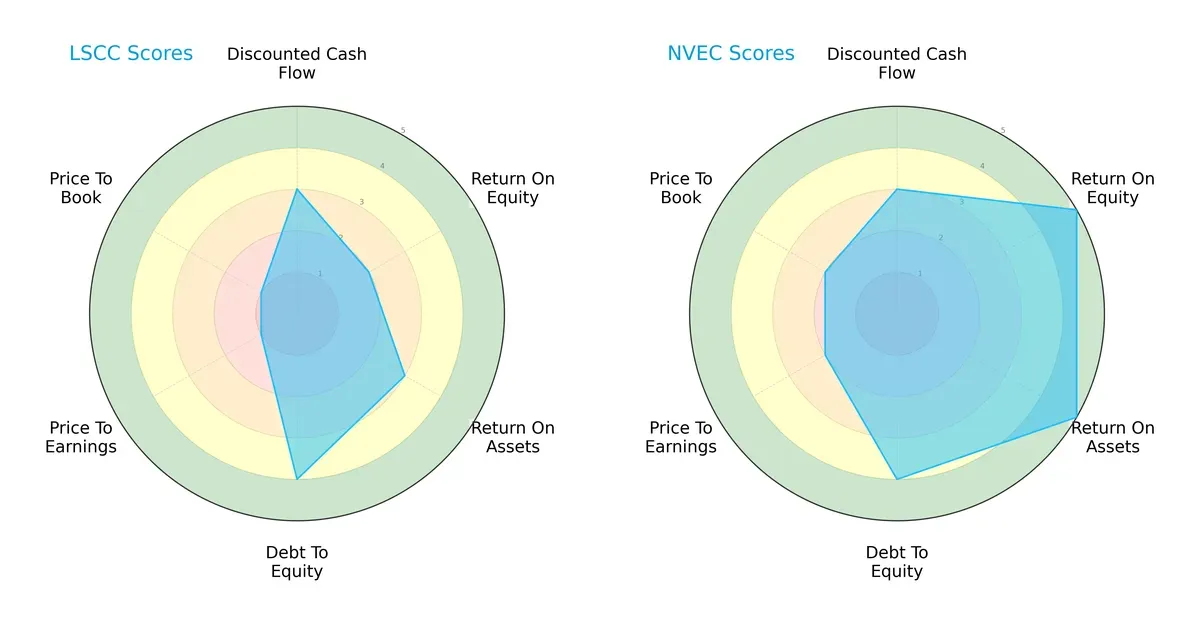
NVE demonstrates a more balanced and robust profile with top marks in ROE (5) and ROA (5), signaling superior profitability and asset efficiency. Both firms share a solid debt-to-equity score (4), indicating prudent leverage. Lattice Semiconductor, however, relies on moderate operational returns (ROE 2, ROA 3) but suffers from very unfavorable valuation metrics (PE and PB at 1), suggesting market skepticism. NVE’s moderate valuation scores (PE 2, PB 2) reflect a fairer market assessment, supporting its favorable overall score (4) compared to Lattice’s moderate (2).
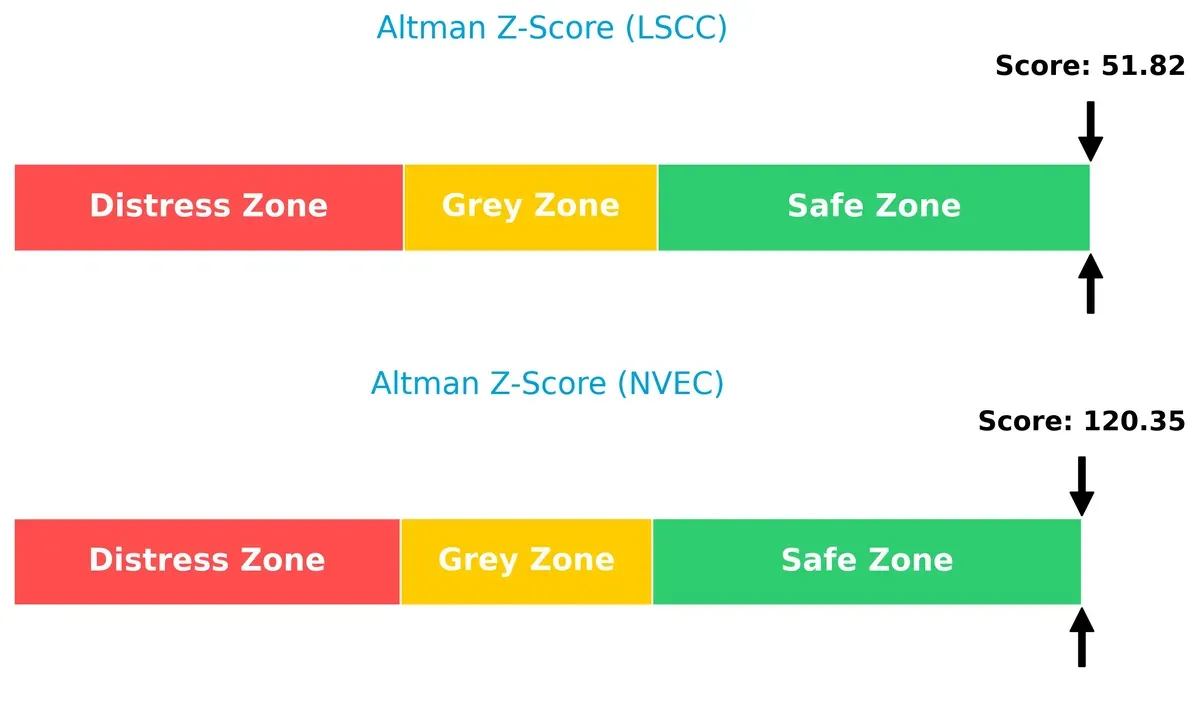
Bankruptcy Risk: Solvency Showdown
The Altman Z-Scores for both companies place them firmly in the safe zone, with NVE at 120.4 and Lattice Semiconductor at 51.8, indicating minimal bankruptcy risk for either in the current economic cycle:
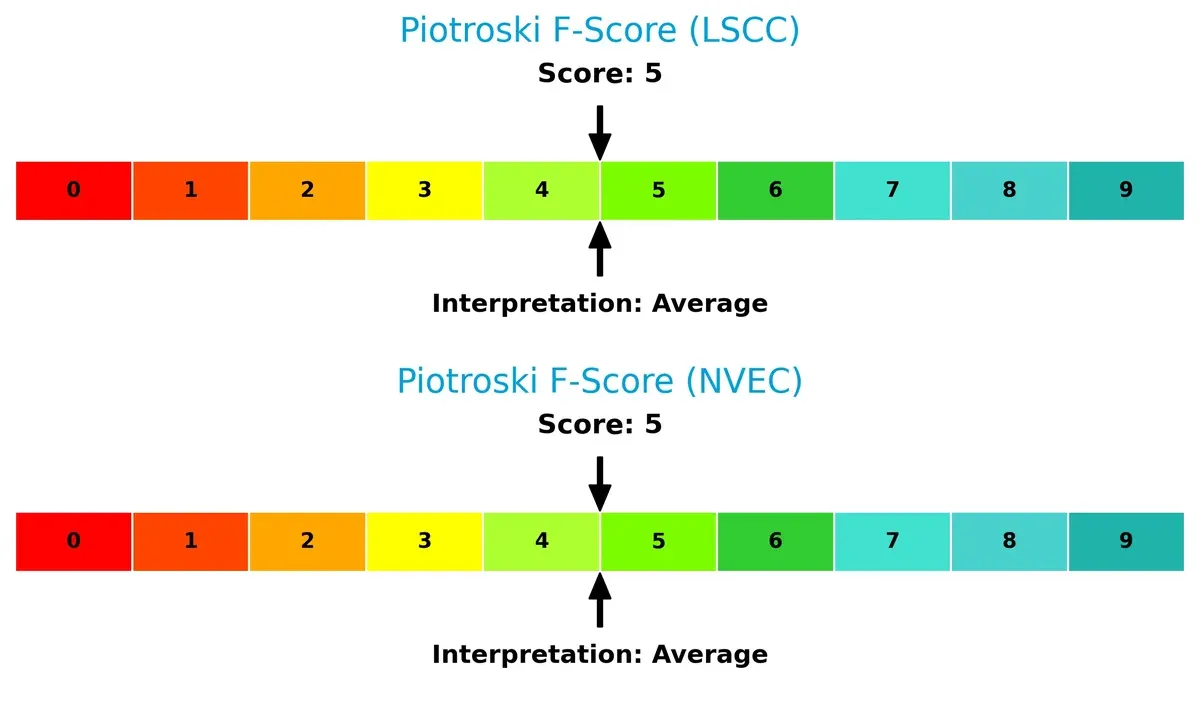
Financial Health: Quality of Operations
Both firms score a Piotroski F-Score of 5, reflecting average financial health with no glaring red flags. This parity suggests neither company currently suffers from severe internal financial weaknesses:
How are the two companies positioned?
This section dissects the operational DNA of LSCC and NVEC by comparing their revenue distribution and internal dynamics. The goal is to confront their economic moats to reveal which model offers the most resilient, sustainable advantage today.
Revenue Segmentation: The Strategic Mix
This comparison dissects how Lattice Semiconductor Corporation and NVE Corporation diversify their income streams and where their primary sector bets lie:
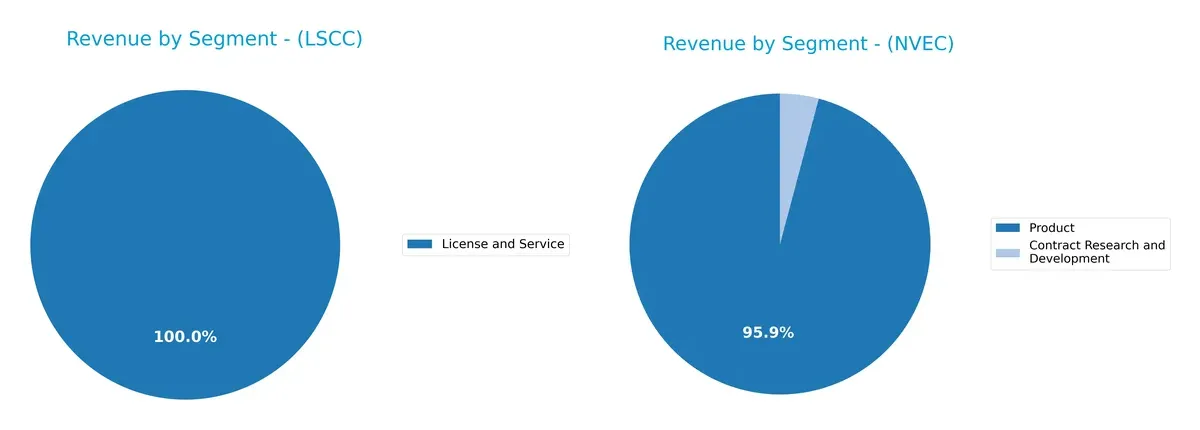
Lattice Semiconductor anchors revenue heavily in product sales, with distributors bringing in over $330M and direct sales around $50M, dwarfing its $17M license and service segment. NVE Corporation’s revenue pivots mainly on product sales near $25.9M, while contract research and development contributes a modest $1.1M. Lattice shows a concentrated mix reliant on distribution channels, reflecting infrastructure dominance but exposing it to channel risk. NVE’s smaller, more balanced split suggests a diversified model with less concentration risk.
Strengths and Weaknesses Comparison
This table compares the Strengths and Weaknesses of LSCC and NVEC based on diversification, profitability, financials, innovation, global presence, and market share:
LSCC Strengths
- Diverse product revenue streams including license, service, and distributor sales
- Strong quick ratio at 2.62 indicating solid liquidity
- Very low debt-to-assets at 1.81% supports financial stability
- High interest coverage ratio at 228 demonstrates strong earnings relative to interest expenses
- Favorable fixed asset turnover at 7.62 reflects efficient asset use
NVEC Strengths
- Exceptionally high net margin at 58.22% shows superior profitability
- Robust ROE at 24.19% and ROIC at 21.14% indicate excellent capital efficiency
- Extremely high quick ratio at 22.03 ensures liquidity
- Near zero debt-to-assets at 1.43% minimizes financial risk
- Strong fixed asset turnover at 8.91 signals operational efficiency
- Dividend yield at 6.28% provides steady income
LSCC Weaknesses
- ROIC at 4.59% below WACC 11.72% suggests value destruction
- Elevated PE of 132.74 and PB of 11.41 imply overvaluation risk
- Current ratio at 3.66 contrasts quick ratio, possibly indicating inventory concerns
- Low ROE of 8.6% signals weak shareholder returns
- Absence of dividend yield limits income appeal
NVEC Weaknesses
- Extremely high current ratio at 28.4 may indicate inefficient asset use or excess cash
- PB ratio at 4.95 is relatively high, hinting at valuation risk
- Asset turnover at 0.4 is low, suggesting less efficient use of assets
- More limited geographic revenue diversification than LSCC
Overall, LSCC demonstrates solid liquidity and operational efficiency but struggles with profitability and valuation concerns. NVEC excels in profitability and capital efficiency but shows potential inefficiencies in asset utilization and valuation. These factors shape each company’s strategic priorities moving forward.
The Moat Duel: Analyzing Competitive Defensibility
A structural moat protects long-term profits from relentless competitive erosion. It is the ultimate shield against value destruction:
Lattice Semiconductor Corporation: Cost Advantage and IP Licensing Strength
Lattice’s moat stems from a cost advantage combined with valuable IP licensing. Despite solid margins, its declining ROIC signals weakening profitability. New product innovation in 2026 could either shore up or further strain its position.
NVE Corporation: Technological Differentiation via Spintronics
NVE’s moat is built on advanced spintronics technology, offering a unique niche versus Lattice’s broader semiconductor approach. Its rising ROIC and strong margins reflect efficient capital use and durable competitive strength, with growth potential in industrial IoT.
Moat Battle: Cost Efficiency vs. Technological Innovation
NVE holds a deeper moat with consistent ROIC well above WACC and an upward trend, signaling durable value creation. Lattice’s value destruction and shrinking returns leave it less equipped to defend market share. NVE better withstands competitive threats in 2026.
Which stock offers better returns?
The past year saw Lattice Semiconductor’s stock rise steadily with accelerating gains, while NVE Corporation faced a prolonged decline before recent moderate recovery.
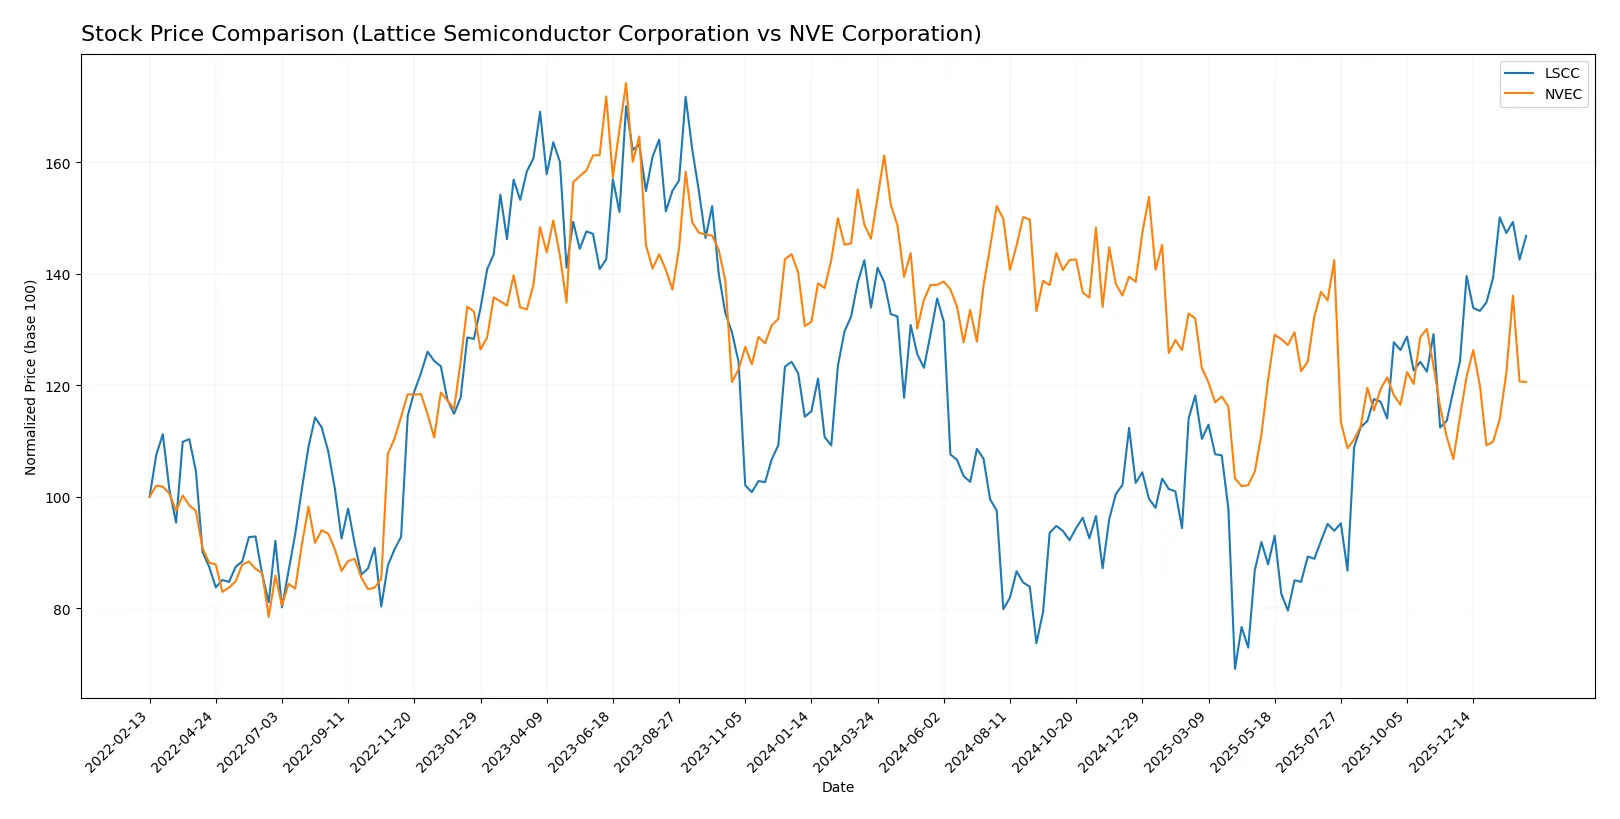
Trend Comparison
Lattice Semiconductor’s stock gained 9.6% over the past 12 months, showing a bullish trend with accelerating momentum and a high volatility of 11.21%. It ranged from 39.03 to 84.8.
NVE Corporation’s stock lost 17.56% over the same period, signaling a bearish trend despite recent acceleration. Volatility measured 7.55%, with prices between 56.99 and 90.18.
Lattice Semiconductor outperformed NVE Corporation, delivering a positive market return versus NVE’s negative trend over the past year.
Target Prices
Lattice Semiconductor Corporation shows a clear target price consensus from analysts.
| Company | Target Low | Target High | Consensus |
|---|---|---|---|
| Lattice Semiconductor Corporation | 65 | 105 | 84.67 |
Analysts expect LSCC to trade moderately above its current price of 82.91 USD, signaling potential upside in the semiconductor sector. No verified target price data is available for NVE Corporation.

Don’t Let Luck Decide Your Entry Point
Optimize your entry points with our advanced ProRealTime indicators. You’ll get efficient buy signals with precise price targets for maximum performance. Start outperforming now!
How do institutions grade them?
Here is a summary of the latest institutional grades for the two companies:
Lattice Semiconductor Corporation Grades
The table below presents recent grades from reputable firms on Lattice Semiconductor Corporation:
| Grading Company | Action | New Grade | Date |
|---|---|---|---|
| Susquehanna | Maintain | Positive | 2026-01-22 |
| Keybanc | Maintain | Overweight | 2026-01-13 |
| Baird | Maintain | Outperform | 2025-11-04 |
| Rosenblatt | Maintain | Buy | 2025-11-04 |
| Benchmark | Maintain | Buy | 2025-11-04 |
| Stifel | Maintain | Buy | 2025-11-04 |
| Needham | Maintain | Buy | 2025-11-04 |
| Susquehanna | Maintain | Positive | 2025-10-22 |
| Keybanc | Maintain | Overweight | 2025-09-30 |
| Needham | Maintain | Buy | 2025-09-22 |
NVE Corporation Grades
No reliable institutional grades are available for NVE Corporation at this time.
Which company has the best grades?
Lattice Semiconductor Corporation holds multiple strong buy and outperform ratings from respected firms. NVE Corporation lacks available institutional grades. Investors may view Lattice’s consistent positive ratings as a sign of broader analyst confidence.
Risks specific to each company
The following categories identify the critical pressure points and systemic threats facing both firms in the 2026 market environment:
1. Market & Competition
Lattice Semiconductor Corporation
- Operates in a highly competitive semiconductor sector with larger peers and rapid innovation cycles.
NVE Corporation
- Niche player in spintronics with less direct competition but risks from slower market adoption.
2. Capital Structure & Debt
Lattice Semiconductor Corporation
- Maintains low debt levels with strong interest coverage, signaling conservative leverage.
NVE Corporation
- Also very low debt with infinite interest coverage, indicating robust financial stability.
3. Stock Volatility
Lattice Semiconductor Corporation
- Exhibits higher beta (1.67), reflecting greater stock price volatility relative to the market.
NVE Corporation
- Lower beta (1.22) suggests more moderate price swings and less market risk.
4. Regulatory & Legal
Lattice Semiconductor Corporation
- Faces typical semiconductor industry regulatory challenges, including export controls and IP protection.
NVE Corporation
- Subject to specialized regulatory risks due to spintronics technology and medical device applications.
5. Supply Chain & Operations
Lattice Semiconductor Corporation
- Relies on global manufacturing and distribution networks vulnerable to geopolitical disruptions.
NVE Corporation
- Smaller scale and focused product line may reduce supply chain complexity but increase supplier dependency.
6. ESG & Climate Transition
Lattice Semiconductor Corporation
- Larger footprint requires active ESG management; industry pressure to reduce carbon footprint.
NVE Corporation
- Smaller operation size may ease transition but less public ESG disclosure and initiatives.
7. Geopolitical Exposure
Lattice Semiconductor Corporation
- Global sales footprint exposes it to risks from US-China tensions and trade policies.
NVE Corporation
- Primarily US-based with limited international exposure, reducing geopolitical risks.
Which company shows a better risk-adjusted profile?
NVE Corporation’s most impactful risk is its niche market dependency, which may limit growth if spintronics adoption stalls. Lattice Semiconductor’s greatest risk lies in intense market competition and high stock volatility. Overall, I see NVE with a superior risk-adjusted profile, supported by its stronger profitability, lower volatility, and greater financial stability. Recent data show NVE’s exceptionally high net margin (58.2%) versus Lattice’s modest 12%, underscoring operational strength despite scale differences.
Final Verdict: Which stock to choose?
Lattice Semiconductor Corporation (LSCC) stands out for its impressive operational efficiency and strong cash flow generation, making it a potential cash machine in a challenging semiconductor cycle. However, its declining profitability and value destruction signal caution. LSCC suits investors seeking aggressive growth with tolerance for volatility.
NVE Corporation (NVEC) boasts a durable competitive moat, demonstrated by its growing ROIC far exceeding WACC, and exceptional margins that reflect operational excellence. Its financial stability and moderate valuation offer a safer profile compared to LSCC. NVEC aligns well with growth-at-a-reasonable-price (GARP) investors prioritizing quality and stability.
If you prioritize aggressive expansion and are comfortable with higher risk, LSCC might appeal due to its operational leverage despite weakening returns. However, if you seek durable competitive advantage and better financial stability, NVEC outshines with superior profitability and a robust moat that commands a premium. Both cases warrant careful risk assessment given sector cyclicality.
Disclaimer: Investment carries a risk of loss of initial capital. The past performance is not a reliable indicator of future results. Be sure to understand risks before making an investment decision.
Go Further
I encourage you to read the complete analyses of Lattice Semiconductor Corporation and NVE Corporation to enhance your investment decisions: