Home > Comparison > Technology > MPWR vs LSCC
The strategic rivalry between Monolithic Power Systems, Inc. and Lattice Semiconductor Corporation shapes the semiconductor industry’s evolution. Monolithic Power excels as a diversified power electronics innovator, while Lattice Semiconductor focuses on programmable logic devices and IP licensing. This head-to-head pits broad-based technological integration against niche specialization. This analysis aims to identify which company presents a superior risk-adjusted investment case for a diversified portfolio navigating the competitive semiconductor landscape.
Table of contents
Companies Overview
Monolithic Power Systems and Lattice Semiconductor hold pivotal roles in the semiconductor industry, shaping technology across multiple sectors.
Monolithic Power Systems, Inc.: Power Electronics Innovator
Monolithic Power Systems dominates the semiconductor-based power electronics market. It generates revenue by designing and selling DC to DC integrated circuits that regulate voltages in various electronic devices. In 2026, its strategic focus remains on expanding applications in computing, automotive, and industrial sectors while enhancing product efficiency and global distribution.
Lattice Semiconductor Corporation: FPGA and IP Licensing Specialist
Lattice Semiconductor leads in field programmable gate arrays (FPGAs) and IP licensing. Its revenue model relies on selling programmable logic devices and monetizing its technology portfolio through IP licenses. The company prioritizes growth in communications, computing, and automotive markets, leveraging innovation in low-power, small-form-factor semiconductor solutions.
Strategic Collision: Similarities & Divergences
Both firms thrive in semiconductors but differ sharply in approach: Monolithic Power emphasizes integrated power solutions, while Lattice focuses on programmable logic and IP assets. Their primary battleground is the embedded systems market, targeting OEMs in automotive and industrial sectors. Investors face contrasting profiles—Monolithic Power offers broad hardware integration, whereas Lattice invests in flexible, software-driven semiconductor technology.
Income Statement Comparison
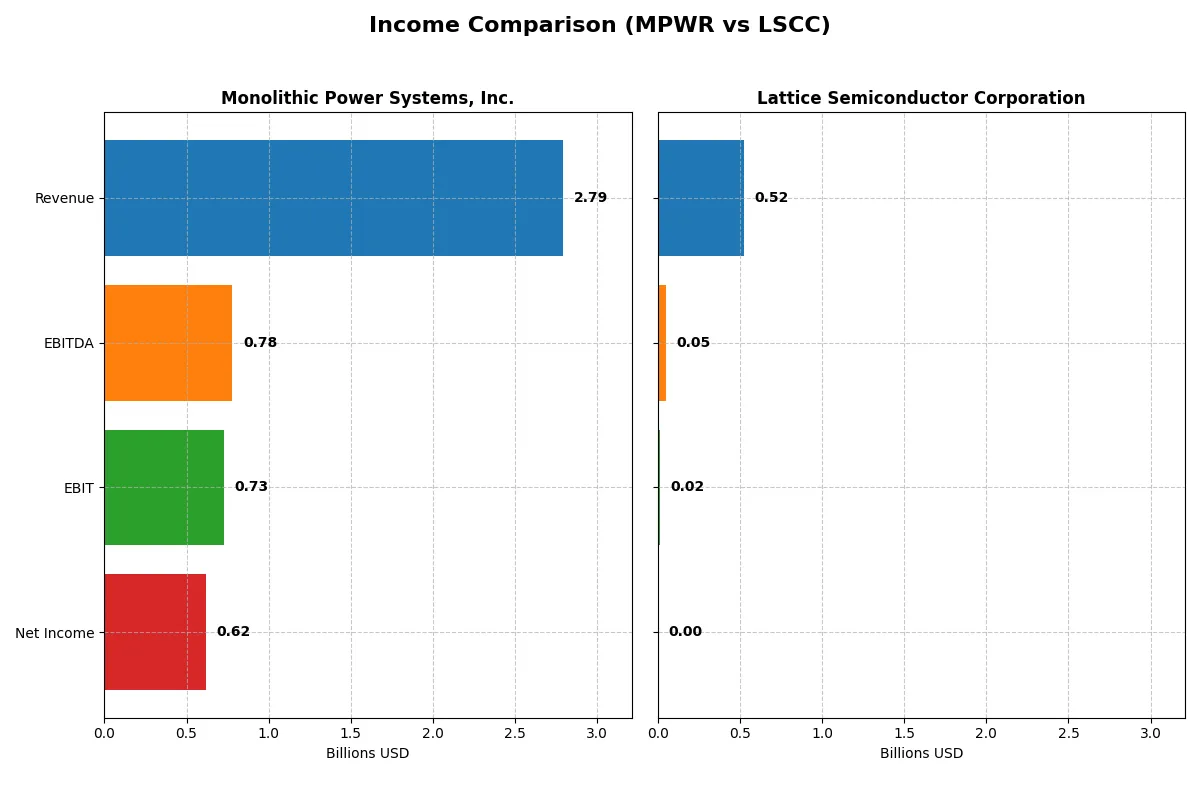
This data dissects the core profitability and scalability of both corporate engines to reveal who dominates the bottom line:
| Metric | Monolithic Power Systems, Inc. (MPWR) | Lattice Semiconductor Corporation (LSCC) |
|---|---|---|
| Revenue | 2.79B | 523M |
| Cost of Revenue | 1.25B | 166M |
| Operating Expenses | 811M | 342M |
| Gross Profit | 1.54B | 357M |
| EBITDA | 780M | 51M |
| EBIT | 729M | 15M |
| Interest Expense | 0 | 3M |
| Net Income | 616M | 3M |
| EPS | 12.82 | 0.0225 |
| Fiscal Year | 2025 | 2025 |
Income Statement Analysis: The Bottom-Line Duel
This income statement comparison will reveal which company operates with greater efficiency and financial discipline through recent market cycles.
Monolithic Power Systems, Inc. Analysis
Monolithic Power Systems (MPWR) shows strong revenue growth, climbing from $1.2B in 2021 to $2.79B in 2025. Net income surged overall, despite a sharp dip in 2025, reflecting a one-year margin contraction. Its gross margin stays robust above 55%, and a solid 26% EBIT margin highlights efficient cost control. Momentum slowed in 2025, but profitability remains favorable.
Lattice Semiconductor Corporation Analysis
Lattice Semiconductor (LSCC) exhibits modest revenue growth, inching from $515M in 2021 to $523M in 2025. Net income sharply declined, with a net margin under 1% in 2025, reflecting margin pressure. While gross margin stays healthy at 68%, EBIT margin weakens to 2.9%, indicating operational challenges. The latest year signals a struggle to translate revenue into profits efficiently.
Margin Power vs. Revenue Scale
MPWR outperforms LSCC with a commanding 22% net margin versus LSCC’s sub-1%, driven by higher scale and operational leverage. MPWR’s consistent revenue growth and expanding profitability contrast with LSCC’s stagnant top line and deteriorating net income. Investors seeking strong fundamental earnings and margin resilience should favor MPWR’s profile over LSCC’s weaker income statement trajectory.
Financial Ratios Comparison
These vital ratios act as a diagnostic tool to expose the underlying fiscal health, valuation premiums, and capital efficiency of the companies compared below:
| Ratios | Monolithic Power Systems, Inc. (MPWR) | Lattice Semiconductor Corporation (LSCC) |
|---|---|---|
| ROE | 16.6% | 0.4% |
| ROIC | 14.9% | 0.5% |
| P/E | 70.7 | 3,496.2 |
| P/B | 11.7 | 15.1 |
| Current Ratio | 5.91 | 3.09 |
| Quick Ratio | 4.38 | 2.33 |
| D/E | 0 | 0.10 |
| Debt-to-Assets | 0 | 8.38% |
| Interest Coverage | 0 | 5.27 |
| Asset Turnover | 0.65 | 0.61 |
| Fixed Asset Turnover | 4.45 | 4.49 |
| Payout ratio | 46.2% | 0 |
| Dividend yield | 0.65% | 0 |
| Fiscal Year | 2025 | 2025 |
Efficiency & Valuation Duel: The Vital Signs
Financial ratios act as the company’s DNA, revealing hidden risks and operational excellence that numbers alone cannot convey.
Monolithic Power Systems, Inc.
Monolithic Power exhibits strong profitability with a 16.55% ROE and a healthy 22.07% net margin, signaling operational efficiency. However, its valuation appears stretched with a P/E of 70.69 and P/B of 11.7. The company offers a modest 0.65% dividend yield, indicating a cautious shareholder return strategy alongside significant R&D reinvestment.
Lattice Semiconductor Corporation
Lattice Semiconductor shows weak profitability, with ROE at 0.43% and net margin near break-even at 0.59%, marking operational challenges. It trades at an extreme P/E of 3496.18 and a P/B of 15.1, reflecting an expensive and speculative valuation. The firm pays no dividend, focusing shareholder returns on aggressive R&D for growth.
Premium Valuation vs. Operational Safety
Monolithic Power combines solid returns with a high but justifiable valuation, offering a more balanced risk profile. Lattice’s stretched multiples and weak profitability raise caution despite growth efforts. Investors seeking operational safety may prefer Monolithic Power, while those chasing speculative growth must weigh higher risks with Lattice.
Which one offers the Superior Shareholder Reward?
Monolithic Power Systems (MPWR) pays a modest dividend yield of 0.65% with a sustainable payout ratio near 46%. Its free cash flow coverage supports continued distributions. It also engages in consistent buybacks, boosting total returns. Lattice Semiconductor (LSCC) pays no dividend but reinvests heavily in R&D and growth, with a strong free cash flow conversion ratio around 75-85%. LSCC also conducts share buybacks, though less aggressively. Historically, MPWR’s balanced dividend and buyback strategy offers more immediate shareholder reward. LSCC’s growth reinvestment suits long-term capital gains but lacks near-term income. In 2026, I favor MPWR for a superior total return profile due to its sustainable distributions and consistent buyback intensity.
Comparative Score Analysis: The Strategic Profile
The radar chart reveals the fundamental DNA and trade-offs of Monolithic Power Systems, Inc. and Lattice Semiconductor Corporation:
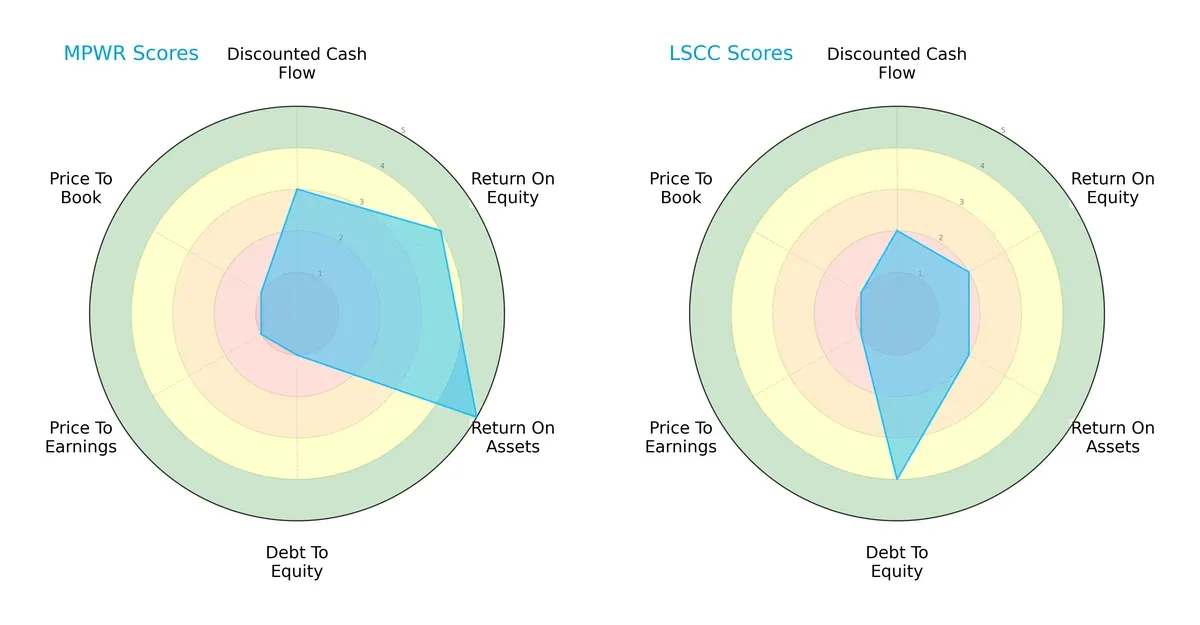
Monolithic Power excels in profitability with superior ROE (4) and ROA (5) scores, indicating efficient capital and asset use. However, it carries significant financial risk, reflected in a very unfavorable debt-to-equity score (1) and weak valuation metrics (P/E and P/B scores at 1). Lattice Semiconductor shows a more balanced risk profile with a favorable debt-to-equity score (4) but lagging profitability scores (ROE and ROA at 2). Lattice’s overall score (2) is less compelling, relying on financial stability rather than operational efficiency.
Bankruptcy Risk: Solvency Showdown
Monolithic Power Systems (61.18) and Lattice Semiconductor (48.74) both reside well within the safe zone, indicating negligible bankruptcy risk in the current cycle:
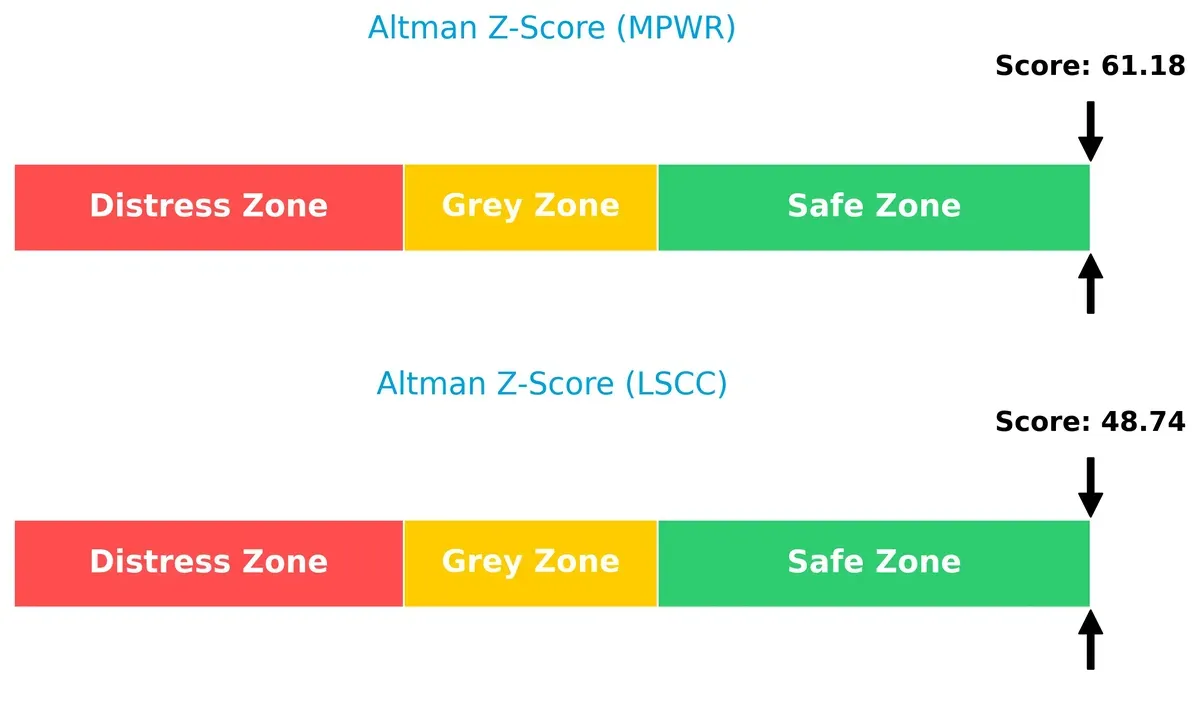
These exceptionally high Altman Z-Scores reflect strong balance sheets and solvent financial structures, providing confidence in their long-term viability despite differing operational efficiencies.
Financial Health: Quality of Operations
Lattice Semiconductor’s Piotroski F-Score (7) surpasses Monolithic Power’s (5), signaling stronger internal financial health and operational quality:
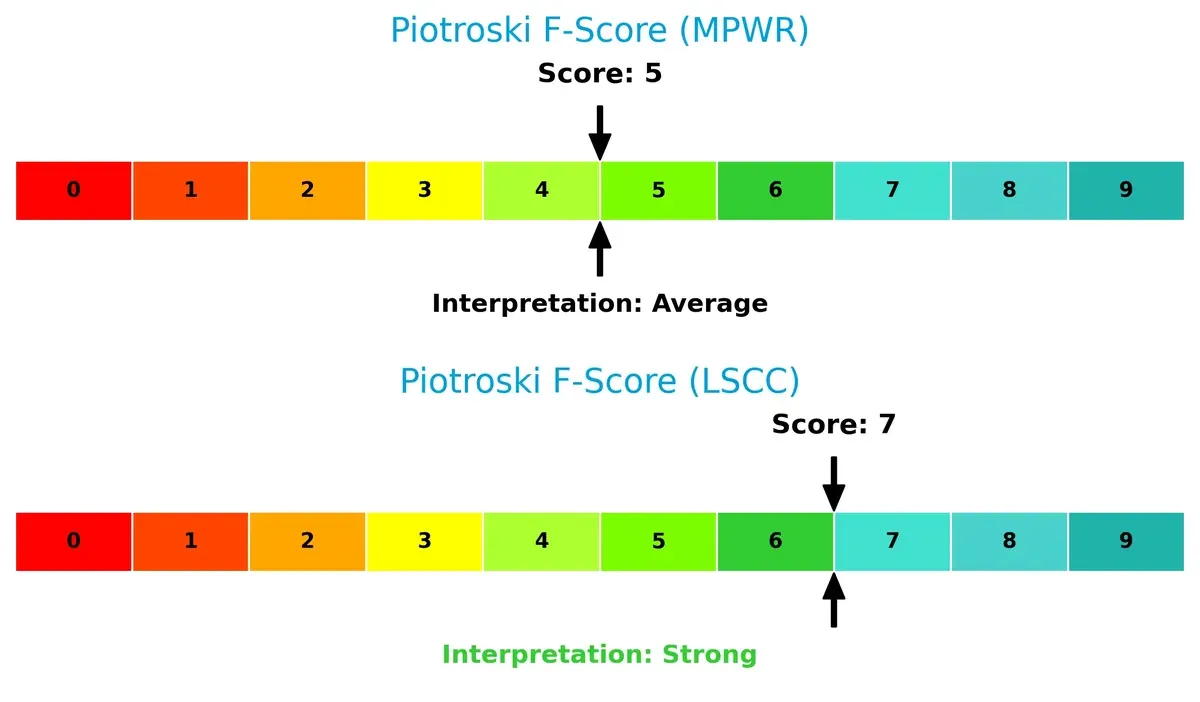
While both firms avoid red flags, Lattice’s higher score suggests superior profitability, liquidity, and efficiency metrics, which may translate into more resilient cash flow generation and value creation over time. Monolithic’s moderate score calls for caution on internal financial dynamics.
How are the two companies positioned?
This section dissects the operational DNA of MPWR and LSCC by comparing their revenue distribution and internal strengths and weaknesses. The goal is to confront their economic moats and identify which business model delivers the most resilient, sustainable advantage today.
Revenue Segmentation: The Strategic Mix
This visual comparison dissects how Monolithic Power Systems and Lattice Semiconductor diversify income streams and reveals their primary sector bets:
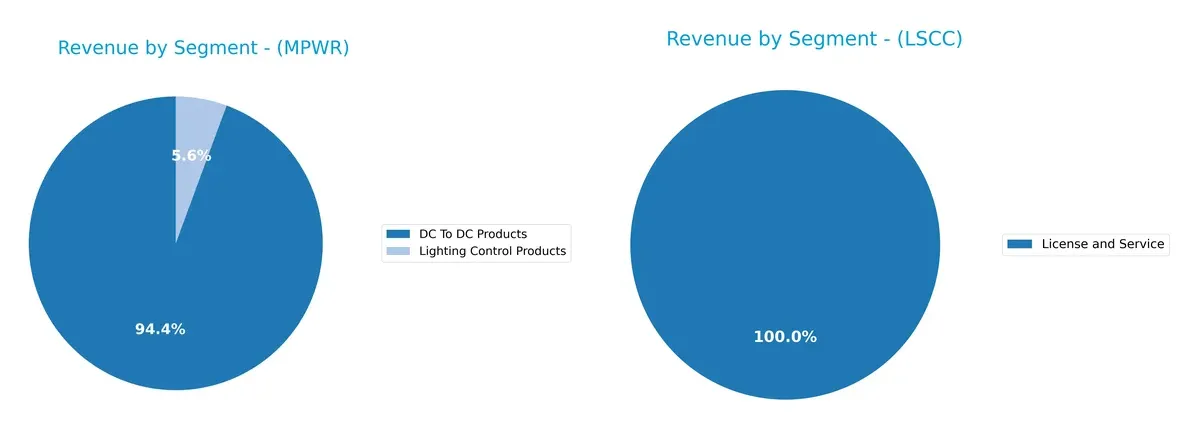
Monolithic Power Systems anchors revenue in DC To DC Products with $1.7B in 2023, while Lighting Control contributes $102M, showing modest diversification. Conversely, Lattice Semiconductor relies heavily on Product Revenue through distributors ($332M in 2018) and direct sales, with License and Service trailing below $22M recently. MPWR’s focus on power management products suggests infrastructure dominance, whereas LSCC faces concentration risk due to dependency on a few channels.
Strengths and Weaknesses Comparison
This table compares the Strengths and Weaknesses of Monolithic Power Systems (MPWR) and Lattice Semiconductor Corporation (LSCC):
MPWR Strengths
- High net margin (22.07%)
- Strong ROE (16.55%)
- Favorable ROIC (14.93%)
- Zero debt and infinite interest coverage
- High quick ratio (4.38) supports liquidity
- Large revenue from diversified global markets including China and Taiwan
LSCC Strengths
- Positive quick ratio (2.33) and manageable debt (D/E 0.1)
- Favorable interest coverage (5.27)
- Solid fixed asset turnover (4.49)
- Global presence with significant revenue from Asia and Americas
- Diversified revenue streams including license and service
MPWR Weaknesses
- High P/E (70.69) and P/B (11.7) ratios signal expensive valuation
- Unfavorable current ratio (5.91) questions short-term asset management
- WACC (10.48%) exceeds ROIC, impacting capital efficiency
- Low dividend yield (0.65%) limits income appeal
- Asset turnover moderate (0.65)
LSCC Weaknesses
- Very low profitability metrics: net margin (0.59%), ROE (0.43%), ROIC (0.47%)
- Extremely high P/E (3496.18) and P/B (15.1) ratios
- Unfavorable current ratio (3.09)
- Zero dividend yield reduces shareholder returns
- WACC (11.47%) higher than ROIC, raising cost of capital concerns
Monolithic Power Systems exhibits strong profitability and a robust balance sheet, but high valuation multiples and capital efficiency issues raise caution. Lattice Semiconductor struggles with profitability and valuation metrics despite decent liquidity and asset management, highlighting challenges in operational performance and investor return.
The Moat Duel: Analyzing Competitive Defensibility
A structural moat is the only true shield protecting long-term profits from relentless competitive erosion in dynamic industries like semiconductors:
Monolithic Power Systems, Inc.: Cost Advantage Moat
I see Monolithic’s power electronics specialization driving a cost advantage. Its 26% EBIT margin and 55% gross margin confirm efficient capital use. Expanding automotive and industrial markets could deepen this moat in 2026.
Lattice Semiconductor Corporation: Specialized IP Moat
Lattice relies on intellectual property in programmable gate arrays, contrasting Monolithic’s cost edge. However, slim 2.9% EBIT margin and negative ROIC trend weaken its defense. New IP licenses or market pivots may offer disruption potential.
Cost Leadership vs. IP Specialization: Who Holds the Moat Edge?
Monolithic Power’s consistent value creation and superior margins give it a wider and deeper moat. Lattice’s declining profitability signals vulnerability. Monolithic is better equipped to defend and grow market share in 2026.
Which stock offers better returns?
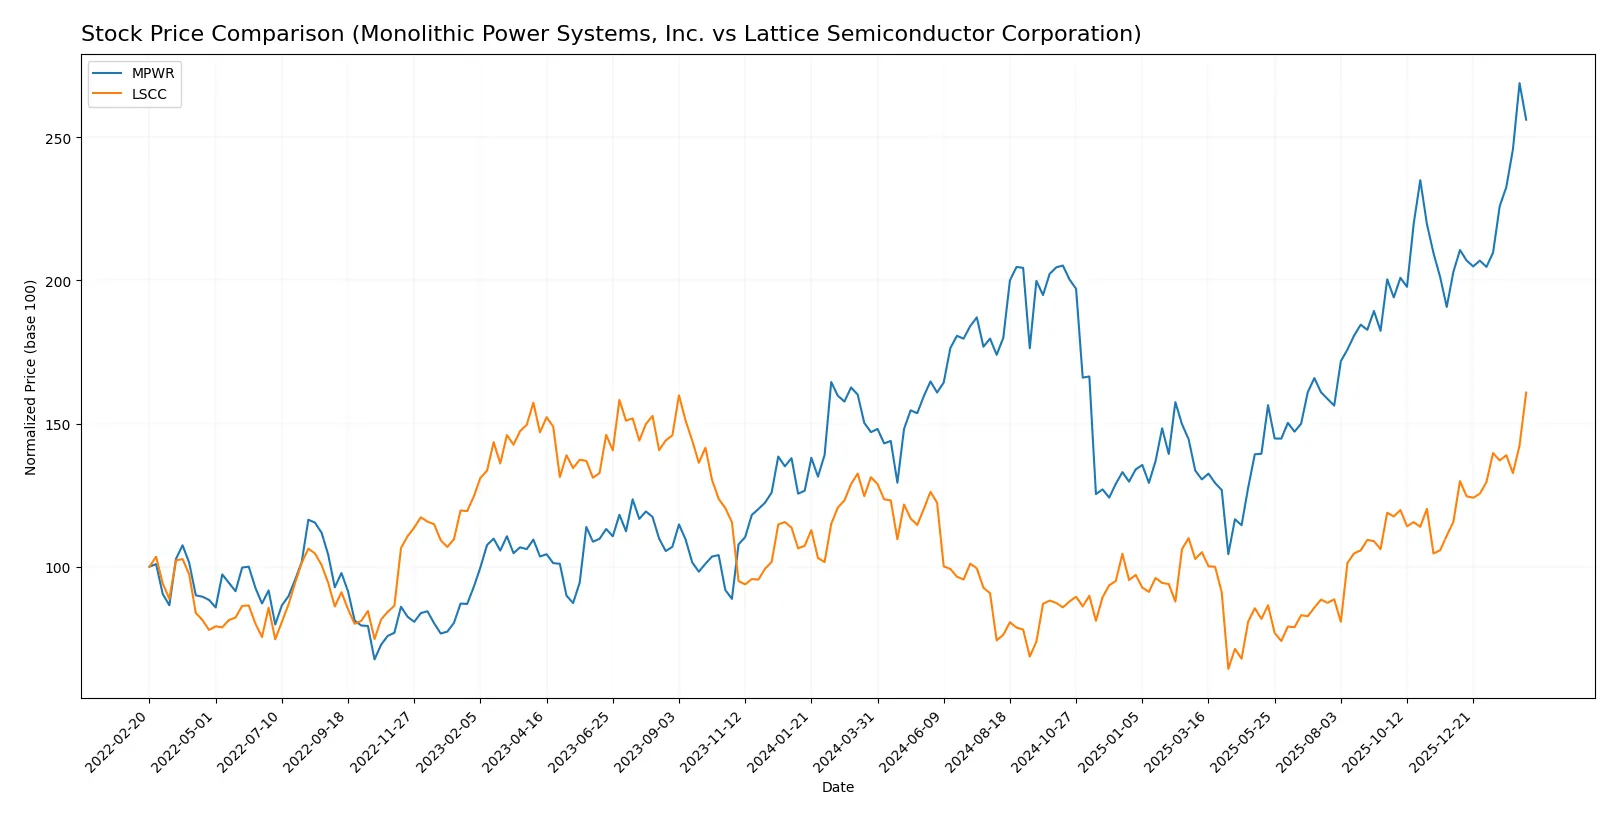
The past year shows distinct price momentum and trading patterns for Monolithic Power Systems and Lattice Semiconductor, highlighting divergent bullish trends with varying acceleration and volume dynamics.
Trend Comparison
Monolithic Power Systems (MPWR) posted a strong 74.25% price increase over the past year, with accelerating momentum and a high volatility level (std. dev. 155.46), reaching a peak of 1229.82 from a low of 477.39.
Lattice Semiconductor (LSCC) gained 22.53% over the same period, also accelerating but with far lower volatility (std. dev. 11.77), hitting a high of 97.63 and a low of 39.03.
MPWR outperformed LSCC significantly in market returns, delivering more than triple the price appreciation over the last year despite greater volatility.
Target Prices
Analyst consensus points to moderate upside potential for these semiconductor stocks.
| Company | Target Low | Target High | Consensus |
|---|---|---|---|
| Monolithic Power Systems, Inc. | 1,200 | 1,500 | 1,314 |
| Lattice Semiconductor Corporation | 80 | 125 | 105 |
Targets for Monolithic Power Systems suggest a 12% upside from current levels, reflecting confidence in its power management niche. Lattice Semiconductor’s targets imply a 7% potential gain, signaling cautious optimism amid industry cyclicality.

Don’t Let Luck Decide Your Entry Point
Optimize your entry points with our advanced ProRealTime indicators. You’ll get efficient buy signals with precise price targets for maximum performance. Start outperforming now!
How do institutions grade them?
Monolithic Power Systems, Inc. Grades
The following table summarizes recent institutional grades for Monolithic Power Systems, Inc.:
| Grading Company | Action | New Grade | Date |
|---|---|---|---|
| Citigroup | Maintain | Buy | 2026-02-09 |
| Keybanc | Maintain | Overweight | 2026-02-06 |
| Truist Securities | Maintain | Buy | 2026-02-06 |
| Needham | Maintain | Buy | 2026-02-06 |
| Rosenblatt | Maintain | Neutral | 2026-02-06 |
| Wells Fargo | Maintain | Overweight | 2026-02-06 |
| Stifel | Maintain | Buy | 2026-02-04 |
| Wells Fargo | Maintain | Overweight | 2026-01-26 |
| Wells Fargo | Upgrade | Overweight | 2026-01-15 |
| Truist Securities | Maintain | Buy | 2025-12-19 |
Lattice Semiconductor Corporation Grades
The following table summarizes recent institutional grades for Lattice Semiconductor Corporation:
| Grading Company | Action | New Grade | Date |
|---|---|---|---|
| Susquehanna | Maintain | Positive | 2026-02-11 |
| Jefferies | Maintain | Buy | 2026-02-11 |
| Keybanc | Maintain | Overweight | 2026-02-11 |
| Stifel | Maintain | Buy | 2026-02-11 |
| Needham | Maintain | Buy | 2026-02-11 |
| Benchmark | Maintain | Buy | 2026-02-11 |
| RBC Capital | Maintain | Outperform | 2026-02-11 |
| Rosenblatt | Maintain | Buy | 2026-02-11 |
| Susquehanna | Maintain | Positive | 2026-01-22 |
| Keybanc | Maintain | Overweight | 2026-01-13 |
Which company has the best grades?
Lattice Semiconductor holds consistently strong grades, including multiple “Buy” and “Outperform” ratings, reflecting broad institutional confidence. Monolithic Power Systems also shows mostly “Buy” and “Overweight” grades but includes a neutral rating, suggesting slightly more mixed sentiment. Investors should note these distinctions when assessing relative analyst optimism.
Risks specific to each company
The following categories identify critical pressure points and systemic threats facing Monolithic Power Systems, Inc. and Lattice Semiconductor Corporation in the 2026 market environment:
1. Market & Competition
Monolithic Power Systems, Inc.
- Strong market cap (56B) supports competitive positioning.
- Beta 1.455 indicates moderate market sensitivity.
Lattice Semiconductor Corporation
- Smaller market cap (13B) limits scale advantages.
- Higher beta 1.674 suggests greater volatility risk.
2. Capital Structure & Debt
Monolithic Power Systems, Inc.
- Zero debt reflects conservative financial leverage.
- Infinite interest coverage signals robust debt service capacity.
Lattice Semiconductor Corporation
- Low debt-to-equity (0.1) maintains manageable risk.
- Interest coverage of 5.27 is adequate but less robust.
3. Stock Volatility
Monolithic Power Systems, Inc.
- Beta of 1.455 implies moderate stock volatility.
- Price range 439-1250 shows wide trading band.
Lattice Semiconductor Corporation
- Beta of 1.674 points to higher price swings.
- Price range 35-108 indicates less price stability.
4. Regulatory & Legal
Monolithic Power Systems, Inc.
- No specific regulatory red flags reported.
- Operates globally, exposing to diverse compliance risks.
Lattice Semiconductor Corporation
- No major regulatory issues disclosed.
- Similar global footprint with comparable regulatory exposure.
5. Supply Chain & Operations
Monolithic Power Systems, Inc.
- Broad geographic sales reduce single-region supply risks.
- Larger workforce (4,017) supports operational scale.
Lattice Semiconductor Corporation
- Also diversified sales but smaller employee base (1,110).
- Smaller scale may limit supply chain resilience.
6. ESG & Climate Transition
Monolithic Power Systems, Inc.
- No explicit ESG data; semiconductor sector faces energy transition pressure.
- Larger size may enhance ability to invest in ESG initiatives.
Lattice Semiconductor Corporation
- Similar sector exposure with expected ESG compliance costs.
- Smaller scale could constrain ESG investments.
7. Geopolitical Exposure
Monolithic Power Systems, Inc.
- Global sales expose firm to geopolitical tensions, especially Asia.
- US headquarters may benefit from stable regulatory environment.
Lattice Semiconductor Corporation
- Comparable exposure to Asia-Pacific geopolitical risks.
- Also US-based, but smaller size increases vulnerability.
Which company shows a better risk-adjusted profile?
Monolithic Power Systems’ strongest risk is its stretched valuation metrics, with P/E over 70 raising concerns over price corrections. Lattice Semiconductor struggles with profitability and elevated stock volatility, posing operational and market risks. Overall, Monolithic Power Systems displays a better risk-adjusted profile, supported by zero debt, superior profitability (ROIC 14.9% vs. 0.5%), and a safer Altman Z-score well above distress thresholds. The recent surge in Monolithic’s stock price close to its 52-week high underscores valuation risk, while Lattice’s weak margins and higher beta highlight operational vulnerabilities.
Final Verdict: Which stock to choose?
Monolithic Power Systems (MPWR) boasts a superpower in unmatched capital efficiency, consistently generating returns well above its cost of capital. Its strong cash conversion and robust profitability underpin this strength. The point of vigilance lies in its lofty valuation multiples and stretched current ratio, which could pressure near-term stability. MPWR fits aggressive growth portfolios willing to pay a premium for sustained value creation.
Lattice Semiconductor (LSCC) presents a strategic moat grounded in high R&D intensity and specialized technology niche, supporting future innovation. Relative to MPWR, LSCC offers a more measured risk profile with a solid balance sheet and strong liquidity. However, its current financial performance and value metrics appear less compelling. LSCC suits GARP investors who seek growth potential balanced with reasonable financial conservatism.
If you prioritize superior capital returns and are comfortable with valuation premiums, MPWR outshines as the compelling choice due to its proven value creation and operational strength. However, if you seek a growth story with better financial stability and a defensible innovation moat, LSCC offers better stability despite weaker profitability. Both present distinct analytical scenarios tailored to differing investor risk appetites and strategic goals.
Disclaimer: Investment carries a risk of loss of initial capital. The past performance is not a reliable indicator of future results. Be sure to understand risks before making an investment decision.
Go Further
I encourage you to read the complete analyses of Monolithic Power Systems, Inc. and Lattice Semiconductor Corporation to enhance your investment decisions: