In the fast-evolving semiconductor industry, Micron Technology, Inc. (MU) and Lattice Semiconductor Corporation (LSCC) stand out for their distinct approaches to innovation and market focus. Micron leads with a broad portfolio in memory and storage solutions, while Lattice specializes in programmable logic devices. Comparing these companies offers valuable insight into different growth strategies within the same sector. Join me as we analyze which company presents the most compelling investment opportunity in 2026.
Table of contents
Companies Overview
I will begin the comparison between Micron Technology, Inc. and Lattice Semiconductor Corporation by providing an overview of these two companies and their main differences.
Micron Technology, Inc. Overview
Micron Technology, Inc. is a leading provider of memory and storage products worldwide, operating through four business units focused on compute, mobile, storage, and embedded markets. The company designs DRAM, NAND, and NOR memory products used in cloud servers, mobile devices, automotive, and industrial sectors. Founded in 1978 and headquartered in Boise, Idaho, Micron serves a wide range of markets through direct sales and distribution channels.
Lattice Semiconductor Corporation Overview
Lattice Semiconductor Corporation develops and sells semiconductor products, including field programmable gate arrays and video connectivity solutions. It licenses its technology portfolio and serves original equipment manufacturers in communications, computing, consumer, industrial, and automotive markets. Incorporated in 1983 and based in Hillsboro, Oregon, Lattice sells products both directly and through independent representatives and distributors.
Key similarities and differences
Both companies operate in the semiconductor industry and serve diverse technology markets, including automotive and industrial sectors. Micron specializes in memory and storage solutions with a broad product range, while Lattice focuses on programmable logic devices and IP licensing. Micron is significantly larger in market capitalization and employee count, reflecting its broader product portfolio and global reach compared to Lattice’s more niche focus.
Income Statement Comparison
The table below summarizes key income statement metrics for Micron Technology, Inc. and Lattice Semiconductor Corporation for their most recent fiscal years, providing a side-by-side financial snapshot.

| Metric | Micron Technology, Inc. (MU) | Lattice Semiconductor Corporation (LSCC) |
|---|---|---|
| Market Cap | 373B | 11.7B |
| Revenue | 37.4B | 509M |
| EBITDA | 18.5B | 107M |
| EBIT | 10.1B | 61M |
| Net Income | 8.54B | 61M |
| EPS | 7.65 | 0.44 |
| Fiscal Year | 2025 | 2024 |
Income Statement Interpretations
Micron Technology, Inc.
Micron Technology showed strong revenue growth from 2021 to 2025, with a 34.91% overall increase and a significant 48.85% jump in the most recent year. Net income improved markedly, rising 45.69% over the period and surging 637.35% in the last year. Margins strengthened, with a gross margin near 40% and net margin at 22.84%, indicating improved profitability in 2025.
Lattice Semiconductor Corporation
Lattice Semiconductor experienced revenue growth of 24.82% over 2020-2024 but faced a 30.9% decline in revenue in the latest year. Net income rose 28.99% over the period but fell sharply by 65.85% in 2024. Gross margin remains robust at 66.82%, though net margin dropped to 12%. Recent year results highlight margin compression and earnings pressure.
Which one has the stronger fundamentals?
Micron Technology demonstrates stronger fundamentals supported by consistent revenue and net income growth, alongside expanding margins and favorable income statement metrics. Lattice Semiconductor, despite solid margin levels, shows recent declines in revenue and profitability, with mixed margin trends. Overall, Micron’s income statement reflects more stable and favorable financial performance.
Financial Ratios Comparison
Below is a comparison of key financial ratios for Micron Technology, Inc. (MU) and Lattice Semiconductor Corporation (LSCC) for their most recent fiscal year.
| Ratios | Micron Technology, Inc. (2025) | Lattice Semiconductor Corp. (2024) |
|---|---|---|
| ROE | 15.8% | 8.6% |
| ROIC | 12.1% | 4.6% |
| P/E | 15.9 | 132.7 |
| P/B | 2.51 | 11.41 |
| Current Ratio | 2.52 | 3.66 |
| Quick Ratio | 1.79 | 2.62 |
| D/E (Debt-to-Equity) | 0.28 | 0.02 |
| Debt-to-Assets | 18.5% | 1.8% |
| Interest Coverage | 20.7 | 129.5 |
| Asset Turnover | 0.45 | 0.60 |
| Fixed Asset Turnover | 0.79 | 7.62 |
| Payout Ratio | 6.1% | 0% |
| Dividend Yield | 0.38% | 0% |
Interpretation of the Ratios
Micron Technology, Inc.
Micron presents a majority of favorable ratios, including strong net margin at 22.84% and a robust return on equity of 15.76%, though its weighted average cost of capital (WACC) is unfavorable at 10.52%. Liquidity and leverage ratios are solid, but asset turnover ratios are weak, signaling potential efficiency concerns. The company pays dividends, but with a low yield of 0.38%, which may reflect a cautious payout approach amid growth investments.
Lattice Semiconductor Corporation
Lattice Semiconductor shows mixed ratio results with a favorable net margin of 12% but weak returns on equity (8.6%) and invested capital (4.59%). Its valuation metrics like P/E and P/B ratios are high and unfavorable, suggesting a richly priced stock. Liquidity is generally strong, and interest coverage is excellent. The company does not pay dividends, likely prioritizing reinvestment and R&D efforts during its growth phase.
Which one has the best ratios?
Comparing the two, Micron Technology demonstrates a more favorable overall ratio profile with balanced profitability, liquidity, and leverage metrics despite some efficiency challenges. Lattice Semiconductor’s ratios are more mixed, with valuation and returns under pressure. Thus, Micron’s ratios appear comparatively stronger, reflecting a more stable financial footing.
Strategic Positioning
This section compares the strategic positioning of Micron Technology, Inc. and Lattice Semiconductor Corporation, focusing on market position, key segments, and exposure to technological disruption:
Micron Technology, Inc.
- Leading semiconductor company with $373B market cap; faces competitive pressure in memory and storage markets.
- Diverse segments: DRAM, NAND, storage, compute, mobile, embedded serving cloud, enterprise, automotive markets.
- Operates in mature memory tech markets with moderate disruption risk; product innovation critical for competitiveness.
Lattice Semiconductor Corporation
- Smaller player with $11.7B market cap; competes in programmable logic and connectivity semiconductors.
- Focus on field programmable gate arrays and IP licensing for communications, computing, consumer, industrial sectors.
- Faces disruption risks with evolving programmable logic technologies and IP licensing challenges.
Micron Technology, Inc. vs Lattice Semiconductor Corporation Positioning
Micron pursues a diversified approach across multiple memory and storage segments, benefiting from scale but facing broad market competition. Lattice is more concentrated on programmable logic and IP licensing, offering niche focus but with narrower revenue streams and higher exposure to technological shifts.
Which has the best competitive advantage?
Micron shows a slightly favorable moat with growing profitability, indicating improving competitive advantage. Lattice has a very unfavorable moat, with declining profitability and value destruction, suggesting weaker competitive positioning.
Stock Comparison
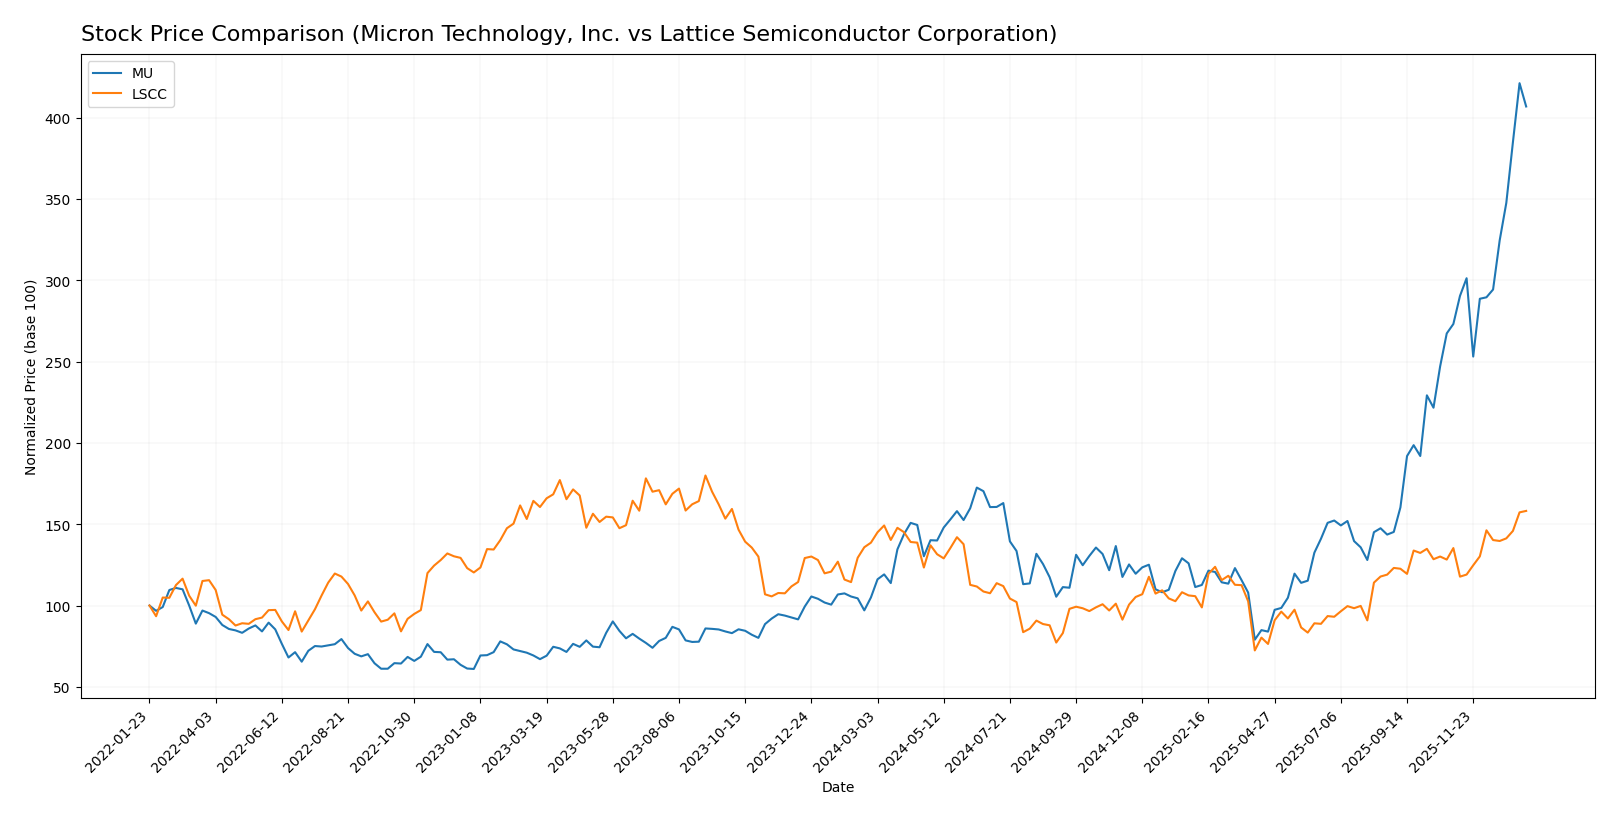
The stock price movements of Micron Technology, Inc. (MU) and Lattice Semiconductor Corporation (LSCC) over the past 12 months reveal distinct bullish trends, with MU showing a more pronounced acceleration and higher volatility than LSCC.
Trend Analysis
Micron Technology, Inc. (MU) experienced a strong bullish trend over the past year with a 287.62% price increase and accelerating momentum; volatility is high with a 57.56 standard deviation and notable highs near 345.09.
Lattice Semiconductor Corporation (LSCC) also showed a bullish trend with a 14.09% price increase and acceleration, but with lower volatility (11.01 std deviation) and a highest price of 85.28, indicating steadier growth.
Comparing both, MU delivered the highest market performance over the past year, outperforming LSCC significantly in percentage price gains and exhibiting stronger acceleration.
Target Prices
Analysts present a clear target price consensus for Micron Technology, Inc. and Lattice Semiconductor Corporation based on current market evaluations.
| Company | Target High | Target Low | Consensus |
|---|---|---|---|
| Micron Technology, Inc. | 450 | 190 | 328.22 |
| Lattice Semiconductor Corporation | 105 | 65 | 83 |
The target prices for Micron suggest moderate upside potential relative to its current price of 333.35 USD, while Lattice Semiconductor’s consensus of 83 USD aligns closely with its current price of 85.28 USD, reflecting balanced analyst expectations.
Analyst Opinions Comparison
This section compares analysts’ ratings and grades for Micron Technology, Inc. (MU) and Lattice Semiconductor Corporation (LSCC):
Rating Comparison
MU Rating
- Rating: B, considered very favorable by analysts.
- Discounted Cash Flow Score: 1, indicating very unfavorable valuation.
- ROE Score: 4, showing favorable profit generation from equity.
- ROA Score: 5, very favorable asset utilization.
- Debt To Equity Score: 3, moderate financial risk.
- Overall Score: 3, moderate overall financial standing.
LSCC Rating
- Rating: B-, also considered very favorable by analysts.
- Discounted Cash Flow Score: 3, indicating moderate valuation.
- ROE Score: 2, showing moderate profit generation from equity.
- ROA Score: 3, moderate asset utilization.
- Debt To Equity Score: 4, favorable financial risk profile.
- Overall Score: 2, moderate overall financial standing.
Which one is the best rated?
Based strictly on the provided data, MU holds a higher overall score and better profitability metrics (ROE and ROA), while LSCC has a slightly better debt-to-equity score and discounted cash flow score. MU is better rated in profitability and overall score.
Scores Comparison
Here is a comparison of the Altman Z-Score and Piotroski Score for Micron Technology, Inc. and Lattice Semiconductor Corporation:
MU Scores
- Altman Z-Score: 10.50, indicating a safe zone with low bankruptcy risk.
- Piotroski Score: 7, reflecting strong financial health and value potential.
LSCC Scores
- Altman Z-Score: 52.69, indicating a safe zone with very low bankruptcy risk.
- Piotroski Score: 5, reflecting average financial strength.
Which company has the best scores?
LSCC has a higher Altman Z-Score than MU, suggesting lower bankruptcy risk. However, MU has a stronger Piotroski Score, indicating better financial strength. Each company shows strengths in different score categories.
Grades Comparison
Here is a comparison of the recent grades assigned to Micron Technology, Inc. and Lattice Semiconductor Corporation by established grading companies:
Micron Technology, Inc. Grades
The following table presents recent grades from reputable firms for Micron Technology, Inc.:
| Grading Company | Action | New Grade | Date |
|---|---|---|---|
| Keybanc | Maintain | Overweight | 2026-01-13 |
| B of A Securities | Maintain | Buy | 2026-01-13 |
| Lynx Global | Maintain | Buy | 2026-01-12 |
| Mizuho | Maintain | Outperform | 2026-01-09 |
| UBS | Maintain | Buy | 2026-01-07 |
| Piper Sandler | Maintain | Overweight | 2026-01-07 |
| Piper Sandler | Maintain | Overweight | 2025-12-18 |
| Barclays | Maintain | Overweight | 2025-12-18 |
| Keybanc | Maintain | Overweight | 2025-12-18 |
| Wolfe Research | Maintain | Outperform | 2025-12-18 |
Micron Technology’s grades consistently indicate a positive outlook, with most firms maintaining Buy, Overweight, or Outperform ratings.
Lattice Semiconductor Corporation Grades
Below are recent grades from credible grading companies for Lattice Semiconductor Corporation:
| Grading Company | Action | New Grade | Date |
|---|---|---|---|
| Keybanc | Maintain | Overweight | 2026-01-13 |
| Stifel | Maintain | Buy | 2025-11-04 |
| Baird | Maintain | Outperform | 2025-11-04 |
| Needham | Maintain | Buy | 2025-11-04 |
| Rosenblatt | Maintain | Buy | 2025-11-04 |
| Benchmark | Maintain | Buy | 2025-11-04 |
| Susquehanna | Maintain | Positive | 2025-10-22 |
| Keybanc | Maintain | Overweight | 2025-09-30 |
| Needham | Maintain | Buy | 2025-09-22 |
| Benchmark | Maintain | Buy | 2025-09-11 |
Lattice Semiconductor also shows a strong pattern of positive ratings, predominantly Buy and Overweight, with multiple firms maintaining their positions.
Which company has the best grades?
Both Micron Technology and Lattice Semiconductor have received predominantly positive grades, largely Buy and Overweight, from several respected grading companies. Micron Technology has a higher count of recent grading activity and consistently includes Outperform ratings, which may suggest a stronger consensus on its potential. Investors might consider these patterns when assessing market sentiment and risk exposure for each stock.
Strengths and Weaknesses
Below is a comparison of key strengths and weaknesses for Micron Technology, Inc. (MU) and Lattice Semiconductor Corporation (LSCC) based on the most recent financial and operational data.
| Criterion | Micron Technology, Inc. (MU) | Lattice Semiconductor Corporation (LSCC) |
|---|---|---|
| Diversification | Highly diversified product segments, including DRAM ($28.6B) and NAND ($8.5B) in 2025 | Limited product scope, primarily focused on licensing and services (~$17M in 2022) |
| Profitability | Strong profitability with 22.8% net margin and growing ROIC at 12.1% (2025) | Moderate net margin at 12%, but declining ROIC at 4.6% indicates weakening profitability |
| Innovation | Moderate innovation indicated by slightly favorable moat and growing ROIC trend | Innovation challenges with very unfavorable moat status and declining ROIC trend |
| Global presence | Significant global footprint supported by large-scale manufacturing and product diversity | Smaller global presence with niche market focus and limited revenue scale |
| Market Share | Leading market share in memory products (DRAM and NAND) | Smaller market share in semiconductor space, focused on programmable logic devices |
In summary, Micron Technology demonstrates strong diversification, solid profitability, and a growing competitive advantage, making it a more stable investment option. Lattice Semiconductor, however, faces challenges in profitability and innovation, reflected in its declining ROIC and narrow product focus, signaling higher risk for investors.
Risk Analysis
Below is a comparative table of key risks for Micron Technology, Inc. (MU) and Lattice Semiconductor Corporation (LSCC) based on the most recent data from 2025 and 2024 respectively:
| Metric | Micron Technology, Inc. (MU) | Lattice Semiconductor Corporation (LSCC) |
|---|---|---|
| Market Risk | Beta 1.50 – Moderate volatility | Beta 1.72 – Higher volatility |
| Debt level | Debt-to-Equity 0.28 – Low risk | Debt-to-Equity 0.02 – Very low risk |
| Regulatory Risk | Moderate – US tech regulations impact | Moderate – Global semiconductor trade regulations |
| Operational Risk | Moderate – Complex manufacturing operations | Moderate – Smaller scale, reliance on IP licensing |
| Environmental Risk | Moderate – Industry-wide concerns on e-waste | Moderate – Compliance with environmental standards |
| Geopolitical Risk | High – Exposure to global supply chain disruptions | High – Sensitive to US-China trade tensions |
The most impactful and likely risks for both companies are geopolitical tensions affecting global semiconductor supply chains and market volatility, given their technology sector exposure. Micron’s larger scale also brings operational complexity, while Lattice’s valuation and profitability metrics suggest higher financial risk despite low debt levels.
Which Stock to Choose?
Micron Technology, Inc. (MU) exhibits a strongly favorable income evolution with 48.85% revenue growth in 2025 and consistently positive profitability metrics. Financial ratios show 57.14% favorable indicators including strong returns on equity (15.76%) and capital, low debt levels (D/E 0.28), and a solid current ratio (2.52). Its slightly favorable moat rating reflects growing ROIC despite being below WACC. The overall rating is very favorable with a “B” grade, supported by a safe-zone Altman Z-Score of 10.5 and a strong Piotroski score of 7.
Lattice Semiconductor Corporation (LSCC) presents a mixed income evolution, with a favorable long-term income growth but an unfavorable recent revenue decline of -30.9% in 2024. Its financial ratios are slightly unfavorable overall (42.86% favorable), with moderate returns on equity (8.6%) and invested capital (4.59%), low debt (D/E 0.02), but high valuation multiples (P/E 132.74). The company’s moat is very unfavorable due to declining ROIC well below WACC, and the rating, though very favorable at “B-“, includes moderate scores and a safe-zone Altman Z-Score of 52.7 but only an average Piotroski score of 5.
Investors focused on growth might find MU’s improving profitability and favorable financial ratios attractive, reflecting a company with increasing value creation. Conversely, those prioritizing risk management and financial stability could interpret LSCC’s low debt and safe Altman Z-Score as positive, though the recent income decline and unfavorable moat suggest caution. Thus, the choice may depend on an investor’s tolerance for recent volatility versus longer-term growth prospects.
Disclaimer: Investment carries a risk of loss of initial capital. The past performance is not a reliable indicator of future results. Be sure to understand risks before making an investment decision.
Go Further
I encourage you to read the complete analyses of Micron Technology, Inc. and Lattice Semiconductor Corporation to enhance your investment decisions: