In the fast-evolving semiconductor industry, Lattice Semiconductor Corporation (LSCC) and indie Semiconductor, Inc. (INDI) represent two distinct yet overlapping players focused on innovation and market expansion. LSCC is a seasoned provider of programmable logic devices, while INDI specializes in automotive semiconductors and software solutions. This comparison explores their strategies and market positions to help you decide which company offers the most compelling investment opportunity today.
Table of contents
Companies Overview
I will begin the comparison between Lattice Semiconductor Corporation and indie Semiconductor, Inc. by providing an overview of these two companies and their main differences.
Lattice Semiconductor Corporation Overview
Lattice Semiconductor Corporation develops and sells semiconductor products globally, focusing on field programmable gate arrays and video connectivity application-specific standard products. It serves original equipment manufacturers across communications, computing, consumer, industrial, and automotive markets. Founded in 1983 and headquartered in Hillsboro, Oregon, Lattice operates through direct sales and a network of independent distributors.
indie Semiconductor, Inc. Overview
indie Semiconductor, Inc. specializes in automotive semiconductors and software solutions for advanced driver assistance, connectivity, and electrification. Its products include devices for parking assistance, infotainment, LED lighting, and photonic components for optical communication markets. Founded in 2007 and based in Aliso Viejo, California, indie targets the automotive sector with innovative technology platforms.
Key similarities and differences
Both companies operate in the semiconductor industry and focus on specialized markets: Lattice on programmable gate arrays and connectivity, indie on automotive semiconductors and software. Lattice has a larger market cap of about 11.7B USD compared to indie’s 857M USD, indicating different scales of operation. While Lattice serves multiple sectors, indie is concentrated exclusively on automotive applications and advanced driver assistance technologies.
Income Statement Comparison
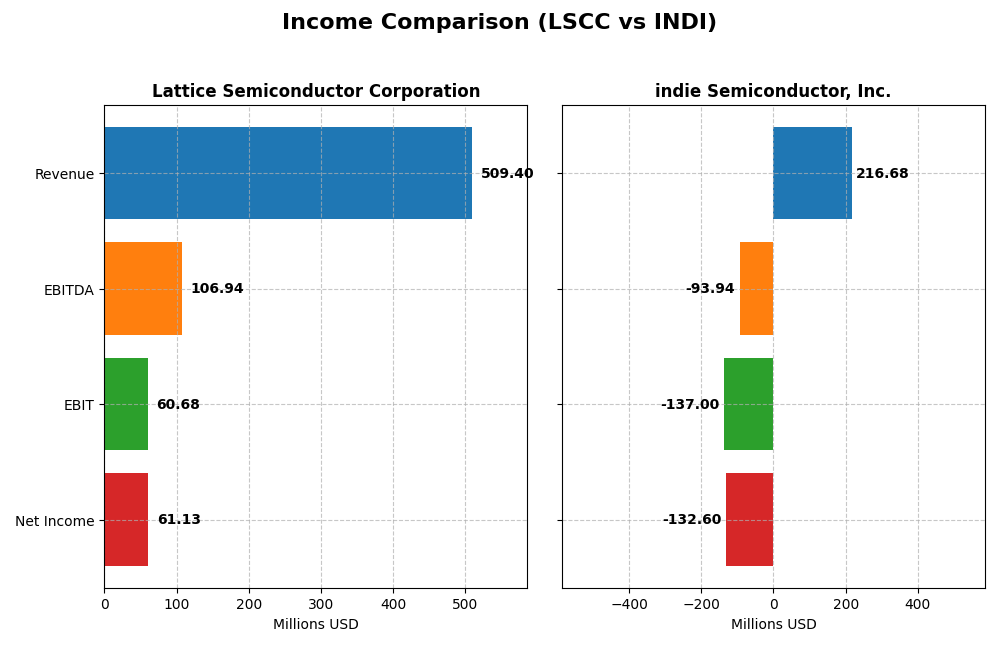
The table below presents a factual comparison of the most recent full fiscal year income statement metrics for Lattice Semiconductor Corporation and indie Semiconductor, Inc.
| Metric | Lattice Semiconductor Corporation | indie Semiconductor, Inc. |
|---|---|---|
| Market Cap | 11.7B USD | 857M USD |
| Revenue | 509M USD | 217M USD |
| EBITDA | 107M USD | -94M USD |
| EBIT | 61M USD | -137M USD |
| Net Income | 61M USD | -133M USD |
| EPS | 0.44 USD | -0.76 USD |
| Fiscal Year | 2024 | 2024 |
Income Statement Interpretations
Lattice Semiconductor Corporation
Lattice Semiconductor showed overall revenue growth of 24.82% and net income growth of 28.99% from 2020 to 2024, with stable gross and net margins around 67% and 12%, respectively. However, in 2024, revenue declined by 30.9% and net income dropped sharply by 65.85%, indicating a slowdown with compressed margins despite generally favorable margin levels over the period.
indie Semiconductor, Inc.
indie Semiconductor experienced strong revenue growth of 858.35% over 2020-2024 but posted a net income decline of 36.01%, reflecting ongoing losses. Gross margin improved significantly to 41.68%, though EBIT and net margins remained negative, with a further net margin deterioration of 16.11% in 2024. Overall, the company’s profitability remains challenged despite some margin improvements.
Which one has the stronger fundamentals?
Lattice Semiconductor demonstrates stronger fundamentals with consistent positive net income, favorable gross and net margins, and overall growth in profit metrics, despite a recent revenue and earnings dip. indie Semiconductor shows rapid revenue expansion but sustained negative earnings and margins, reflecting weaker profitability and higher risk. Thus, Lattice’s income statement reflects more stable and favorable financial health.
Financial Ratios Comparison
The table below presents a comparison of key financial ratios for Lattice Semiconductor Corporation (LSCC) and indie Semiconductor, Inc. (INDI) for the fiscal year 2024.
| Ratios | Lattice Semiconductor Corporation (LSCC) | indie Semiconductor, Inc. (INDI) |
|---|---|---|
| ROE | 8.6% | -31.7% |
| ROIC | 4.6% | -19.3% |
| P/E | 133 | -5.35 |
| P/B | 11.4 | 1.70 |
| Current Ratio | 3.66 | 4.82 |
| Quick Ratio | 2.62 | 4.23 |
| D/E (Debt-to-Equity) | 0.021 | 0.95 |
| Debt-to-Assets | 1.8% | 42.3% |
| Interest Coverage | 130 | -18.4 |
| Asset Turnover | 0.60 | 0.23 |
| Fixed Asset Turnover | 7.62 | 4.30 |
| Payout ratio | 0 | 0 |
| Dividend yield | 0 | 0 |
Interpretation of the Ratios
Lattice Semiconductor Corporation
Lattice Semiconductor shows mixed financial ratios with a strong net margin of 12.0% but unfavorable returns on equity (8.6%) and invested capital (4.59%). Its valuation metrics like P/E (132.74) and P/B (11.41) suggest overvaluation risks. The company does not pay dividends, reflecting a possible reinvestment focus or growth strategy. Strong interest coverage (228.11) and low debt levels indicate solid financial stability.
indie Semiconductor, Inc.
indie Semiconductor exhibits predominantly weak ratios with a negative net margin (-61.2%) and returns on equity (-31.73%) and invested capital (-19.25%), indicating operational challenges. While its P/E is negative, this is favorably viewed given losses. The company also does not pay dividends, likely due to negative earnings and emphasis on R&D (80.8% of revenue). High current ratio (4.82) coexists with poor asset turnover (0.23), signaling inefficiencies.
Which one has the best ratios?
Lattice Semiconductor presents a slightly unfavorable overall ratio profile but maintains better profitability and financial strength compared to indie Semiconductor, whose ratios are largely unfavorable and reflect significant operational difficulties. Lattice’s stronger margins, manageable debt, and coverage metrics outweigh indie’s negative returns and cash flow issues, suggesting a relatively healthier financial position.
Strategic Positioning
This section compares the strategic positioning of LSCC and INDI, focusing on market position, key segments, and exposure to technological disruption:
LSCC
- Well-established semiconductor firm with strong market cap of $11.7B facing typical NASDAQ competition.
- Diverse semiconductor products including FPGAs and video connectivity, serving communications, consumer, industrial, and automotive markets.
- No explicit information on disruption exposure; operates in mature semiconductor segments with licensing and IP monetization.
INDI
- Smaller $857M market cap semiconductor focusing on automotive, facing high volatility and risk.
- Specializes in automotive semiconductors and software for ADAS, connectivity, user experience.
- Involved in evolving automotive tech including photonics and connected car solutions, implying disruption risk.
LSCC vs INDI Positioning
LSCC offers a diversified semiconductor portfolio across multiple end markets, providing broad revenue streams, while INDI concentrates on automotive semiconductors and software, exposing it to niche but evolving market demands. LSCC has a larger market presence, whereas INDI targets specialized innovation areas.
Which has the best competitive advantage?
Both LSCC and INDI show very unfavorable MOAT evaluations with declining ROIC and value destruction. Neither currently sustains a competitive advantage based on capital efficiency and profitability trends from 2020 to 2024.
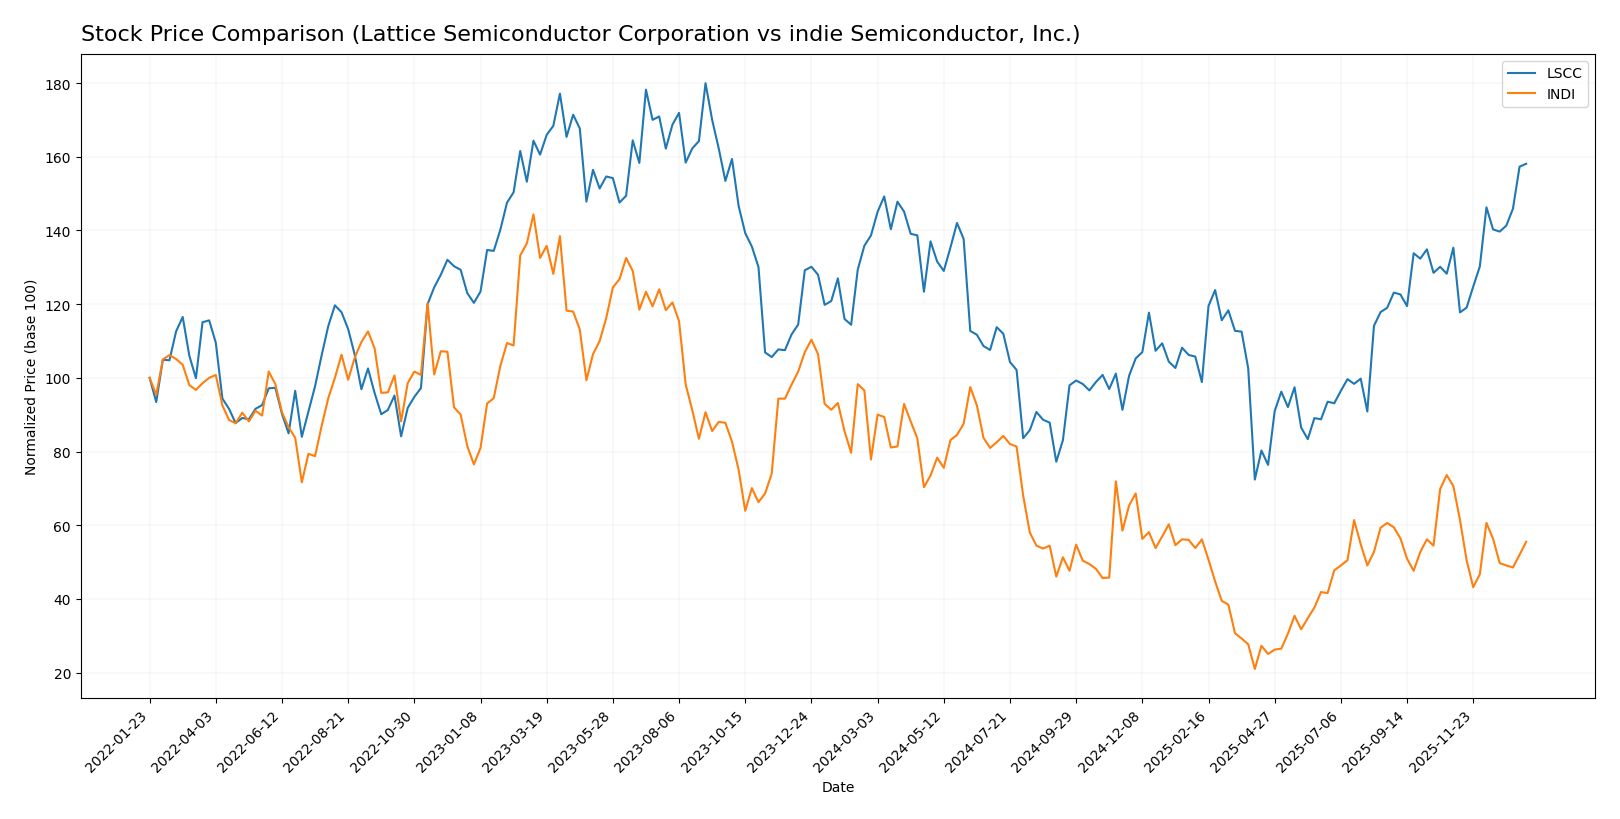
Stock Comparison
The stock price movements over the past year reveal a clear divergence, with Lattice Semiconductor Corporation exhibiting a strong bullish trend and indie Semiconductor, Inc. showing a significant bearish trend, reflecting contrasting trading dynamics and investor sentiment.
Trend Analysis
Lattice Semiconductor Corporation’s stock increased by 14.02% over the past 12 months, demonstrating a bullish trend with price acceleration and a high volatility level (std deviation 11.01). The stock reached a peak of 85.23 and a low of 39.03.
indie Semiconductor, Inc. experienced a 28.67% decline over the past year, indicating a bearish trend with deceleration and lower volatility (std deviation 1.35). The stock’s highest price was 7.43 and its lowest was 1.6.
Comparatively, Lattice Semiconductor outperformed indie Semiconductor, delivering the highest market performance with a positive and accelerating trend, while indie Semiconductor’s stock showed sustained losses and deceleration.
Target Prices
The consensus target prices for these semiconductor companies reflect moderate optimism from analysts.
| Company | Target High | Target Low | Consensus |
|---|---|---|---|
| Lattice Semiconductor Corporation | 105 | 65 | 83 |
| indie Semiconductor, Inc. | 8 | 8 | 8 |
Analysts project Lattice Semiconductor’s price to average around $83, slightly below its current $85.23, suggesting a cautious stance. Indie Semiconductor’s target at $8 is notably higher than its $4.23 trading price, indicating potential upside.
Analyst Opinions Comparison
This section compares analysts’ ratings and grades for Lattice Semiconductor Corporation (LSCC) and indie Semiconductor, Inc. (INDI):
Rating Comparison
LSCC Rating
- Rating: B- indicating a very favorable evaluation
- Discounted Cash Flow Score: 3, considered moderate
- ROE Score: 2, moderate performance on equity returns
- ROA Score: 3, moderate asset utilization
- Debt To Equity Score: 4, favorable financial stability
- Overall Score: 2, moderate overall financial standing
INDI Rating
- Rating: C- with a very unfavorable overall status
- Discounted Cash Flow Score: 1, rated very unfavorable
- ROE Score: 1, very unfavorable equity returns
- ROA Score: 1, very unfavorable asset utilization
- Debt To Equity Score: 1, very unfavorable balance sheet
- Overall Score: 1, very unfavorable overall standing
Which one is the best rated?
LSCC holds a clearly better rating with a B- and multiple moderate to favorable scores, particularly in debt management, compared to INDI’s C- rating and consistently very unfavorable scores across key financial metrics.
Scores Comparison
The following table compares the Altman Z-Score and Piotroski Score for Lattice Semiconductor Corporation and indie Semiconductor, Inc.:
Lattice Semiconductor Corporation Scores
- Altman Z-Score: 52.69, indicating a safe zone with low bankruptcy risk.
- Piotroski Score: 5, showing average financial strength.
indie Semiconductor, Inc. Scores
- Altman Z-Score: 0.12, indicating distress zone with high bankruptcy risk.
- Piotroski Score: 2, showing very weak financial strength.
Which company has the best scores?
Lattice Semiconductor Corporation has significantly better scores, with a score in the safe zone and average Piotroski strength. indie Semiconductor, Inc. shows high bankruptcy risk and very weak financial strength based on these metrics.
Grades Comparison
Here is the comparison of recent reliable grades for Lattice Semiconductor Corporation and indie Semiconductor, Inc.:
Lattice Semiconductor Corporation Grades
The following table summarizes recent grades from reputable grading companies for Lattice Semiconductor Corporation:
| Grading Company | Action | New Grade | Date |
|---|---|---|---|
| Keybanc | Maintain | Overweight | 2026-01-13 |
| Stifel | Maintain | Buy | 2025-11-04 |
| Baird | Maintain | Outperform | 2025-11-04 |
| Needham | Maintain | Buy | 2025-11-04 |
| Rosenblatt | Maintain | Buy | 2025-11-04 |
| Benchmark | Maintain | Buy | 2025-11-04 |
| Susquehanna | Maintain | Positive | 2025-10-22 |
| Keybanc | Maintain | Overweight | 2025-09-30 |
| Needham | Maintain | Buy | 2025-09-22 |
| Benchmark | Maintain | Buy | 2025-09-11 |
Overall, Lattice Semiconductor shows a strong consensus with mostly “Buy” and “Overweight” ratings maintained consistently across multiple reputable grading firms.
indie Semiconductor, Inc. Grades
The following table summarizes recent grades from reputable grading companies for indie Semiconductor, Inc.:
| Grading Company | Action | New Grade | Date |
|---|---|---|---|
| UBS | Maintain | Neutral | 2025-11-10 |
| Benchmark | Maintain | Buy | 2025-06-25 |
| Benchmark | Maintain | Buy | 2025-06-11 |
| Benchmark | Maintain | Buy | 2025-05-21 |
| Benchmark | Maintain | Buy | 2025-05-13 |
| Craig-Hallum | Maintain | Buy | 2025-05-13 |
| Keybanc | Maintain | Overweight | 2025-05-13 |
| Benchmark | Maintain | Buy | 2025-04-09 |
| Benchmark | Maintain | Buy | 2025-02-21 |
| Keybanc | Maintain | Overweight | 2025-02-21 |
indie Semiconductor exhibits mostly “Buy” and “Overweight” ratings, with one “Neutral” rating by UBS, indicating a generally positive but slightly more varied outlook compared to Lattice Semiconductor.
Which company has the best grades?
Lattice Semiconductor Corporation has received a more uniformly positive set of grades, predominantly “Buy” and “Overweight,” compared to indie Semiconductor, which also has mostly favorable grades but includes a “Neutral” rating. This consistency may influence investor confidence and risk assessment differently for each company.
Strengths and Weaknesses
Below is a comparison of Lattice Semiconductor Corporation (LSCC) and indie Semiconductor, Inc. (INDI) focusing on key aspects relevant to investors.
| Criterion | Lattice Semiconductor Corporation (LSCC) | indie Semiconductor, Inc. (INDI) |
|---|---|---|
| Diversification | Moderate: Revenue mainly from product sales with some licensing and services | Moderate: Revenue split between product and service segments |
| Profitability | Moderate profitability with 12% net margin but ROIC below WACC (4.6% vs 11.9%) signals value destruction | Negative profitability: net margin -61.2%, ROIC well below WACC, significant value destruction |
| Innovation | Stable innovation reflected in solid fixed asset turnover (7.62) | Moderate innovation levels with decent fixed asset turnover (4.3) |
| Global presence | Established global distribution channels | Growing global footprint but less mature than LSCC |
| Market Share | Larger market presence with consistent product revenue around 380M USD (2022) | Smaller but rapidly growing revenues, 216M USD total in 2024 |
Key takeaways: Both companies currently destroy shareholder value given ROIC trends below WACC, with indie Semiconductor facing more severe profitability challenges. LSCC shows stronger market presence and moderate profitability, while INDI’s growth is promising but riskier. Investors should weigh growth potential against financial stability carefully.
Risk Analysis
The table below summarizes key risks for Lattice Semiconductor Corporation (LSCC) and indie Semiconductor, Inc. (INDI) based on the most recent 2024 data.
| Metric | Lattice Semiconductor Corporation (LSCC) | indie Semiconductor, Inc. (INDI) |
|---|---|---|
| Market Risk | Beta 1.72, moderate volatility | Beta 2.54, high volatility |
| Debt level | Very low debt-to-equity 0.02, low leverage | High debt-to-equity 0.95, higher leverage |
| Regulatory Risk | Moderate, standard tech industry exposure | Moderate, automotive semiconductor regulations |
| Operational Risk | Moderate, stable operations with 1110 employees | Higher due to smaller size and weaker margins |
| Environmental Risk | Standard industry impact | Moderate, automotive focus increases scrutiny |
| Geopolitical Risk | Global sales exposure | Global sales exposure |
The most impactful risks are market volatility and financial leverage. INDI’s high beta and debt levels raise its risk profile significantly, compounded by negative profitability and weak financial scores. LSCC, with low debt and safer financial metrics, presents lower default risk but still faces market-driven fluctuations. Investors should weigh INDI’s growth potential against these heightened risks carefully.
Which Stock to Choose?
Lattice Semiconductor Corporation (LSCC) shows a favorable income statement with a 12.0% net margin despite a recent 30.9% revenue decline. Its financial ratios reveal a mixed picture: strong liquidity and low debt but high valuation multiples. Profitability remains moderate with an 8.6% ROE, and the company holds a very favorable B- rating.
indie Semiconductor, Inc. (INDI) presents a challenging profile with negative profitability metrics, including a -61.2% net margin and declining returns on assets and equity. Its income growth is uneven, showing strong revenue growth over five years but recent setbacks, alongside an overall unfavorable ratio evaluation and a very favorable C- rating despite financial distress signals.
For investors, LSCC might appear more suitable for those prioritizing stability and quality given its favorable income statement and moderate financial health, while INDI could be seen as a riskier option with potential appeal to risk-tolerant or speculative investors due to its volatile income and weak ratios. The very unfavorable moat status for both companies suggests caution regarding long-term value creation.
Disclaimer: Investment carries a risk of loss of initial capital. The past performance is not a reliable indicator of future results. Be sure to understand risks before making an investment decision.
Go Further
I encourage you to read the complete analyses of Lattice Semiconductor Corporation and indie Semiconductor, Inc. to enhance your investment decisions: