Home > Comparison > Consumer Cyclical > LVS vs WYNN
The strategic rivalry between Las Vegas Sands Corp. and Wynn Resorts, Limited shapes the future of the Gambling, Resorts & Casinos sector. Las Vegas Sands operates as a capital-heavy integrated resort giant with extensive properties in Asia and the US. Wynn Resorts, meanwhile, emphasizes luxury and high-touch experiences across its casino resorts. This analysis explores which operational model delivers superior risk-adjusted returns for a diversified portfolio amid evolving market dynamics.

Table of contents
Companies Overview
Las Vegas Sands Corp. and Wynn Resorts, Limited stand as pivotal players in the global integrated resorts sector.
Las Vegas Sands Corp.: Global Integrated Resort Powerhouse
Las Vegas Sands operates as a leader in integrated resorts, generating revenue through luxury accommodations, gaming, entertainment, and retail across Asia and the U.S. Its strategic focus in 2026 centers on expanding high-margin convention and exhibition facilities alongside premium hospitality services. This diverse portfolio underpins its competitive edge in the gambling and resorts industry.
Wynn Resorts, Limited: Luxury Resort Innovator
Wynn Resorts defines itself by delivering high-end integrated resort experiences, with a core revenue engine rooted in casino operations, luxury hotels, and entertainment venues. In 2026, it emphasizes enhancing customer exclusivity through upscale amenities and expanding its footprint in key gaming markets, focusing on customer retention and brand prestige to drive growth.
Strategic Collision: Similarities & Divergences
Both companies prioritize luxury integrated resorts but diverge philosophically; Las Vegas Sands invests heavily in convention infrastructure, while Wynn Resorts focuses on exclusive, upscale guest experiences. Their primary battleground is market share in Asia and the U.S. gaming hubs. Investors face contrasting profiles: Las Vegas Sands offers scale and diversification; Wynn Resorts bets on premium branding and experiential differentiation.
Income Statement Comparison
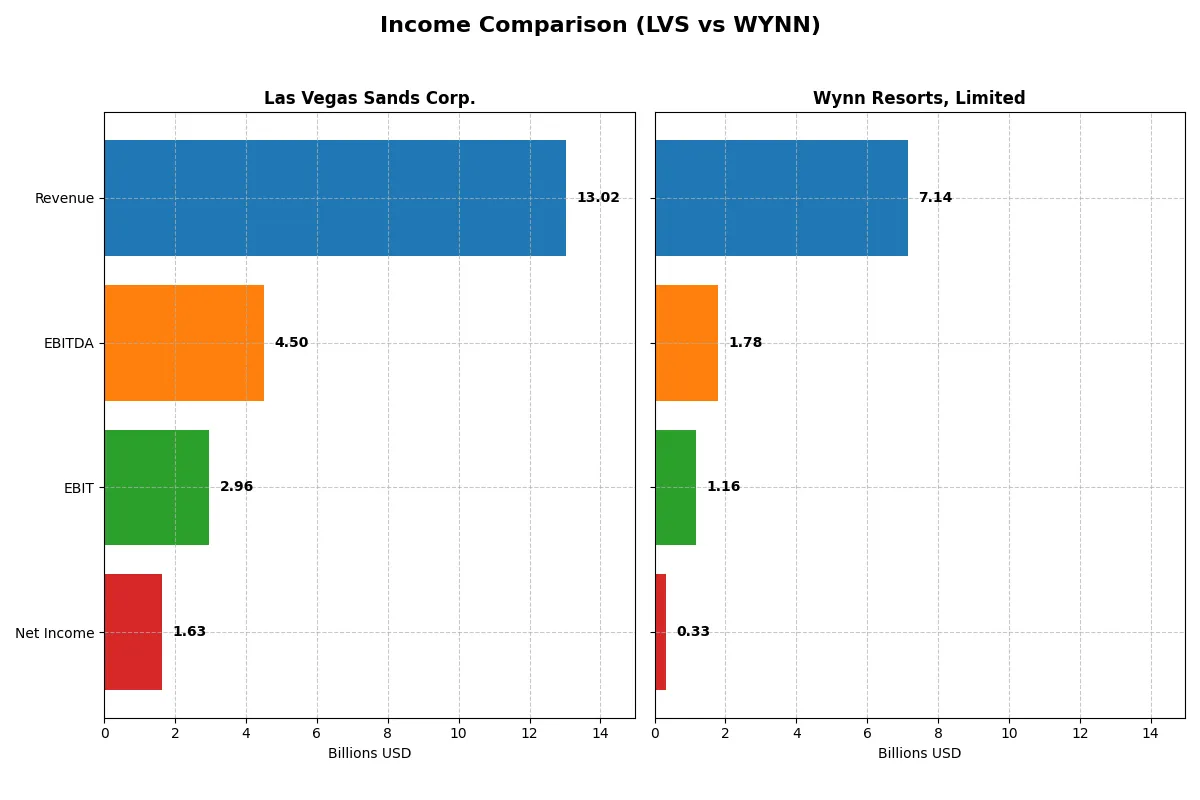
The following data dissects the core profitability and scalability of both corporate engines to reveal who dominates the bottom line:
| Metric | Las Vegas Sands Corp. (LVS) | Wynn Resorts, Limited (WYNN) |
|---|---|---|
| Revenue | 13.0B | 7.1B |
| Cost of Revenue | 9.3B | 4.8B |
| Operating Expenses | 579M | 1.2B |
| Gross Profit | 3.7B | 2.3B |
| EBITDA | 4.5B | 1.8B |
| EBIT | 3.0B | 1.2B |
| Interest Expense | 746M | 626M |
| Net Income | 1.6B | 327M |
| EPS | 2.35 | 3.16 |
| Fiscal Year | 2025 | 2025 |
Income Statement Analysis: The Bottom-Line Duel
This Income Statement comparison reveals which company runs its business more efficiently and delivers stronger profitability.
Las Vegas Sands Corp. Analysis
Las Vegas Sands shows a strong revenue climb from $4.1B in 2022 to $13B in 2025, with net income rising from a loss to $1.63B. Its gross margin hovers around 28%, and net margin at a favorable 12.5%. Recent years reflect solid momentum, with a 15% revenue jump and 10% EBIT growth in 2025.
Wynn Resorts, Limited Analysis
Wynn’s revenue grew from $3.75B in 2022 to $7.14B in 2025 but stalled in the last year. Net income improved from a $424M loss to $327M in 2025, showing weaker margin health—gross margin at 33% but net margin only 4.6%. The latest year saw declines in gross profit and EPS, indicating pressure on efficiency.
Margin Power vs. Revenue Scale
Las Vegas Sands outpaces Wynn with superior net margin and faster revenue growth, delivering $1.63B net income versus Wynn’s $327M in 2025. LVS’s robust margin expansion and EPS gains contrast with WYNN’s stagnation and margin compression. Investors favor LVS’s blend of scale and profitability for enduring value.
Financial Ratios Comparison
These vital ratios act as a diagnostic tool to expose the underlying fiscal health, valuation premiums, and capital efficiency of these companies:
| Ratios | Las Vegas Sands Corp. (LVS) | Wynn Resorts, Limited (WYNN) |
|---|---|---|
| ROE | 1.02 | 0 |
| ROIC | 0.14 | 0 |
| P/E | 27.6 | 38.1 |
| P/B | 28.3 | 0 |
| Current Ratio | 1.14 | 0 |
| Quick Ratio | 1.13 | 0 |
| D/E | 10.15 | 0 |
| Debt-to-Assets | 0.74 | 0 |
| Interest Coverage | 4.14 | 1.85 |
| Asset Turnover | 0.59 | 0 |
| Fixed Asset Turnover | 1.12 | 0 |
| Payout ratio | 0.51 | 0.32 |
| Dividend yield | 1.85% | 0.83% |
| Fiscal Year | 2025 | 2025 |
Efficiency & Valuation Duel: The Vital Signs
Financial ratios act as the company’s DNA, uncovering hidden risks and operational strengths that shape investor confidence and valuation.
Las Vegas Sands Corp.
Las Vegas Sands demonstrates exceptional profitability with a 102% ROE and a solid 12.5% net margin, signaling operational excellence. However, the stock appears stretched with a high P/E of 27.6 and P/B of 28.3. The company returns value with a modest 1.85% dividend yield, balancing capital allocation between dividends and reinvestment.
Wynn Resorts, Limited
Wynn shows weaker profitability, reflected in a 0% ROE and a low 4.6% net margin, indicating operational challenges. Its valuation is expensive with a P/E of 38.1, while lacking clear leverage and liquidity data. Shareholder returns are thin, offering a 0.83% dividend yield amid an unfavorable ratio profile.
Premium Valuation vs. Operational Safety
Las Vegas Sands offers superior profitability and a balanced risk-reward profile despite a stretched valuation. Wynn’s expensive valuation and weak profitability suggest higher risk. Investors seeking operational safety and consistent returns may favor Las Vegas Sands, while Wynn fits those tolerating greater uncertainty.
Which one offers the Superior Shareholder Reward?
I see Las Vegas Sands (LVS) yields 1.85% with a payout ratio near 51%, indicating a balanced, sustainable dividend supported by solid free cash flow (2.39/share). LVS also maintains steady buybacks, enhancing total return. Wynn Resorts (WYNN) yields less at 0.83% but boasts a lower payout ratio around 32%, signaling room to grow dividends. However, WYNN’s free cash flow data is unavailable, and its high leverage raises sustainability concerns. I conclude LVS offers a more attractive and sustainable shareholder reward in 2026, blending reliable dividends and buybacks with prudent capital allocation.
Comparative Score Analysis: The Strategic Profile
The radar chart reveals the fundamental DNA and trade-offs of Las Vegas Sands and Wynn Resorts, highlighting their financial strengths and weaknesses across key metrics:
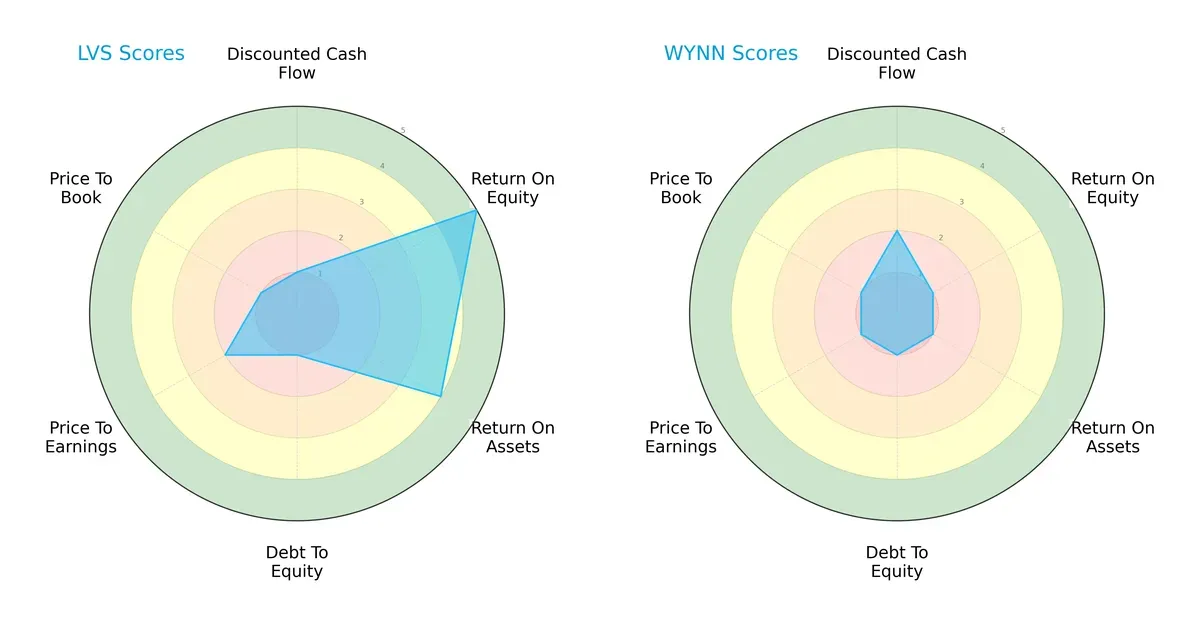
Las Vegas Sands shows a more balanced profile with strong ROE (5) and ROA (4) scores, but it struggles with debt-to-equity (1) and valuation metrics (P/E 2, P/B 1). Wynn Resorts lacks this balance, scoring very low in profitability (ROE 1, ROA 1) and valuation, relying mostly on a marginally better DCF score (2). LVS clearly leverages operational efficiency, while WYNN faces structural challenges.
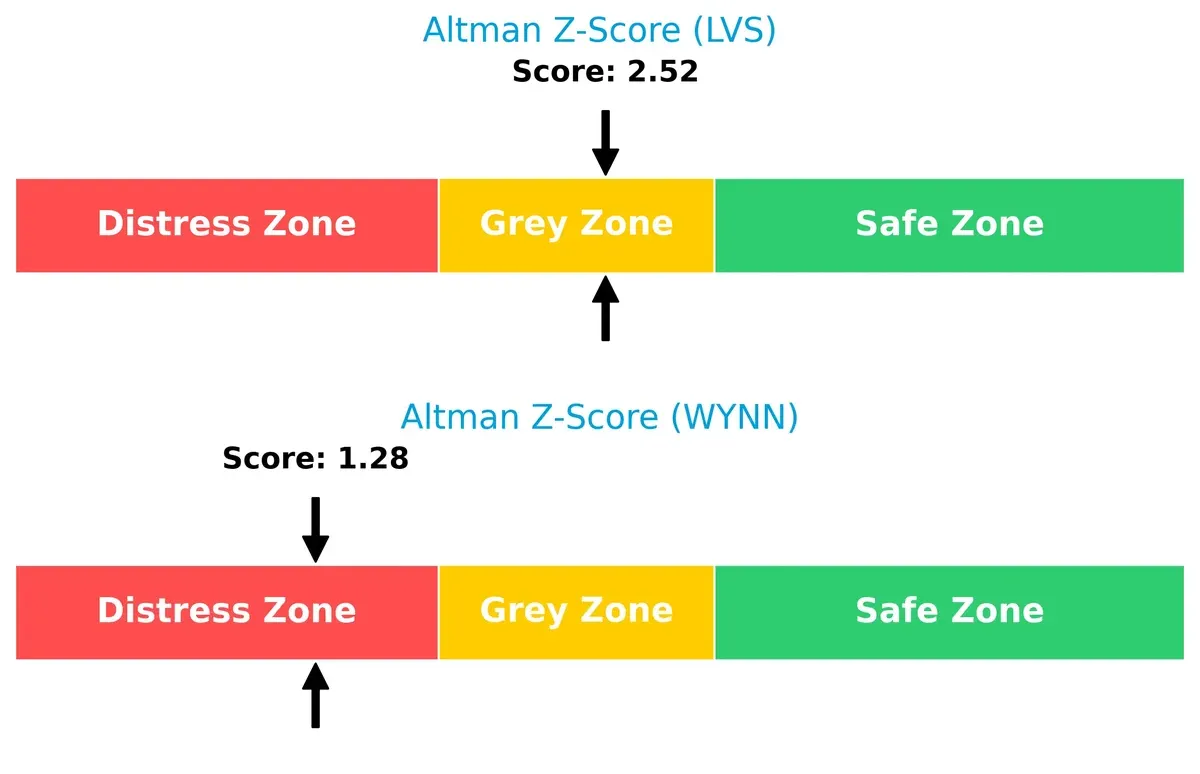
Bankruptcy Risk: Solvency Showdown
Las Vegas Sands’ Altman Z-Score of 2.52 places it in the grey zone, indicating moderate bankruptcy risk. Wynn Resorts’ 1.28 score lands in the distress zone, signaling significant solvency concerns in this cycle:
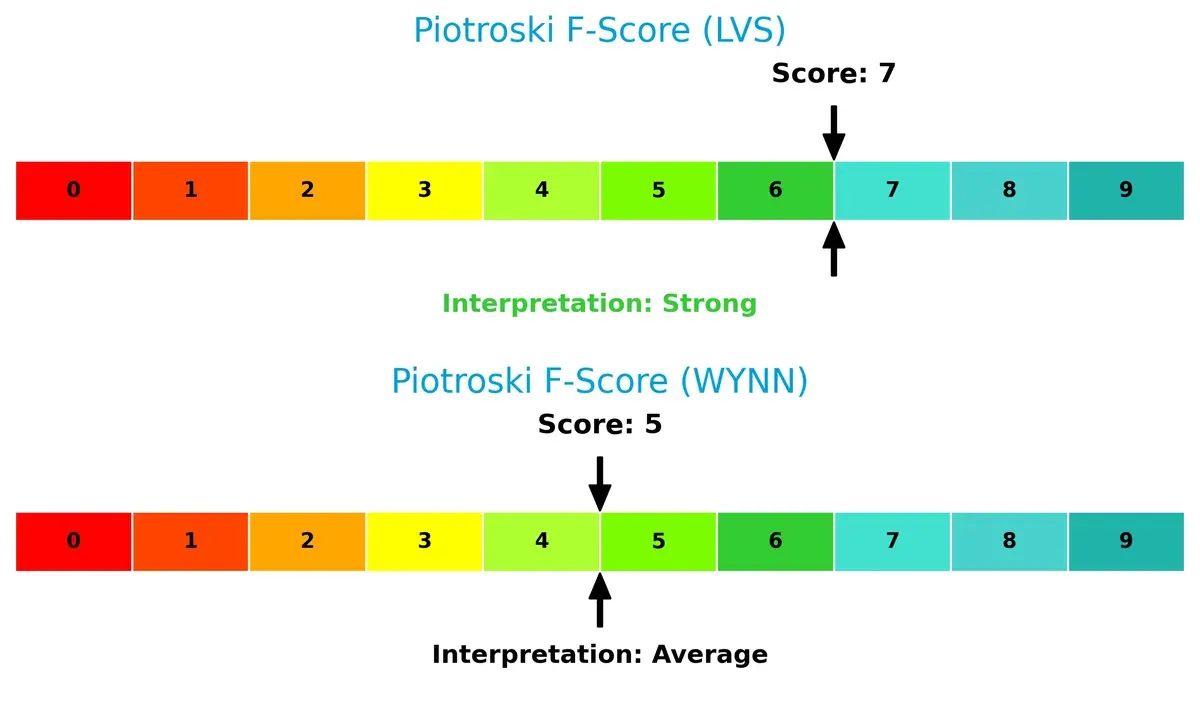
Financial Health: Quality of Operations
Las Vegas Sands’ Piotroski F-Score of 7 reflects strong financial health and operational quality. Wynn Resorts scores 5, indicating average health with potential red flags in internal metrics:
How are the two companies positioned?
This section dissects the operational DNA of LVS and WYNN by comparing revenue distribution and internal strengths and weaknesses. The goal is to confront their economic moats to reveal which model offers the most resilient competitive advantage today.
Revenue Segmentation: The Strategic Mix
This comparison dissects how Las Vegas Sands and Wynn Resorts diversify their income streams and reveals where each company places its primary sector bets:
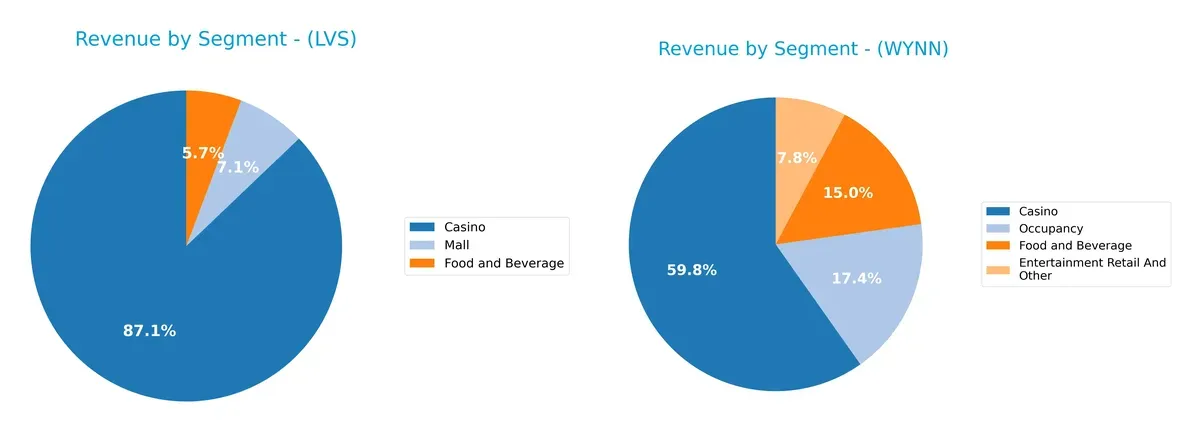
Las Vegas Sands anchors revenue heavily in its Casino segment with $9.79B in 2025, complemented by Food and Beverage ($644M) and Mall ($801M). Wynn Resorts shows a more balanced mix: Casino leads at $4.26B, but Occupancy ($1.24B) and Food and Beverage ($1.07B) also contribute significantly. LVS leans on casino dominance, risking concentration, while Wynn pivots to a diversified hospitality ecosystem, reducing dependence on one stream.
Strengths and Weaknesses Comparison
This table compares the Strengths and Weaknesses of Las Vegas Sands Corp. (LVS) and Wynn Resorts, Limited (WYNN):
LVS Strengths
- Diversified revenue from Casino, Food & Beverage, and Mall segments
- Strong profitability with ROE 102% and ROIC 13.8% above WACC 6.5%
- Favorable quick ratio 1.13 indicates liquidity
- Significant global presence with Marina Bay Sands generating $5.59B
WYNN Strengths
- Favorable debt ratios indicate low leverage
- Positive price-to-book ratio suggests market confidence
- Diversified geographic presence including Macau, Boston, and Las Vegas
- Consistent revenue from Casino and Occupancy segments
LVS Weaknesses
- High debt-to-assets ratio of 73.6% signals financial risk
- Unfavorable price-to-earnings and price-to-book ratios indicate valuation concerns
- Moderate current ratio 1.14 limits short-term flexibility
- Interest coverage near 4x is just adequate
WYNN Weaknesses
- Unfavorable net margin and zero ROE/ROIC highlight profitability challenges
- Lack of liquidity with zero current and quick ratios raises red flags
- Unfavorable interest coverage 1.85x limits financial stability
- Asset turnover and fixed asset turnover unavailable, hindering efficiency analysis
LVS shows robust profitability and diversified business segments but carries high financial leverage risks. WYNN faces profitability and liquidity challenges despite lower leverage and geographic diversification, suggesting strategic focus areas for financial health improvement.
The Moat Duel: Analyzing Competitive Defensibility
A structural moat is the only thing protecting long-term profits from the erosion of competition. Let’s dissect how these two casino giants defend their turf:
Las Vegas Sands Corp.: Integrated Resort Powerhouse
LVS builds its moat on diversified, iconic integrated resorts, leveraging strong brand and scale to sustain a high ROIC well above WACC. Expanding Asian markets and new amenities deepen this durable advantage in 2026.
Wynn Resorts, Limited: Luxury Experience Niche
WYNN’s moat centers on luxury branding and premium customer experience, contrasting LVS’s scale focus. Its ROIC is growing, but data gaps limit clarity. Expansion in Macau and Boston offers growth potential amid disruption risks.
Moat Strength: Scale Dominance vs. Luxury Exclusivity
LVS’s sustained ROIC outperformance and broad resort footprint create a wider moat than WYNN’s more niche luxury positioning. I view LVS as better equipped to defend market share through diversified scale and geographic reach.
Which stock offers better returns?
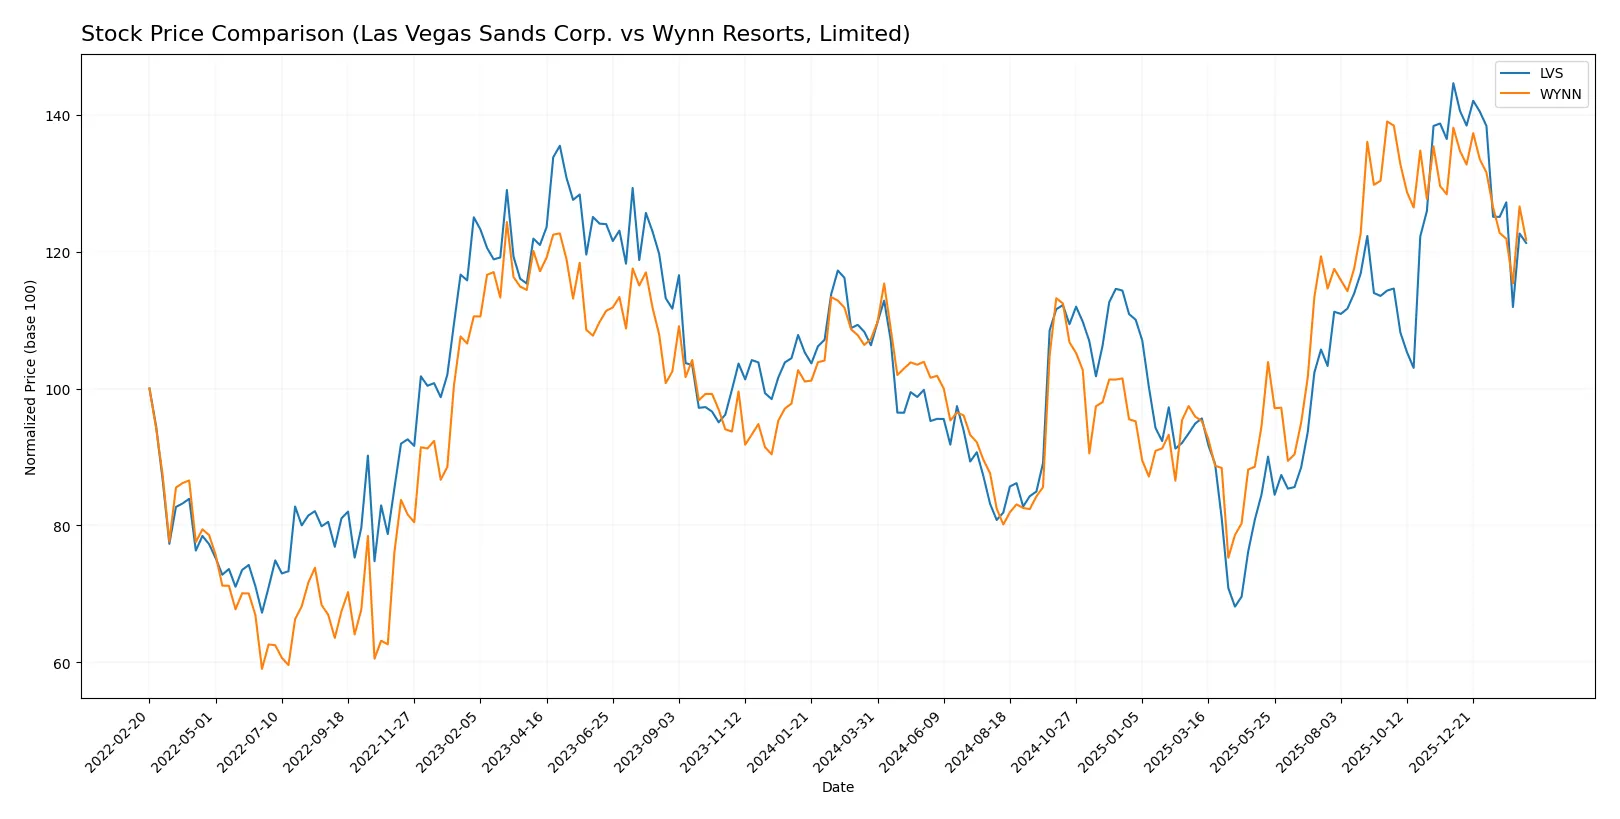
The past year shows both LVS and WYNN with bullish trends but decelerating gains, marked by significant price swings and recent short-term declines in trading momentum.
Trend Comparison
Las Vegas Sands Corp. (LVS) posted a 14.07% price increase over 12 months, signaling a bullish trend with decelerating growth and a volatility measure (std deviation) of 8.21. Recent months show a -16.15% drop, indicating a short-term bearish correction.
Wynn Resorts, Limited (WYNN) recorded a 13.51% gain across the same period, also bullish but decelerating. Volatility is higher at 16.17 std deviation. Its recent trend fell by -11.88%, reflecting a similar short-term bearish pullback.
LVS slightly outperformed WYNN over the year, despite both facing recent downward pressure. LVS’s steadier volatility supports a stronger overall market performance.
Target Prices
Analysts show a bullish consensus for both Las Vegas Sands and Wynn Resorts, with significant upside potential from current prices.
| Company | Target Low | Target High | Consensus |
|---|---|---|---|
| Las Vegas Sands Corp. | 63 | 80 | 70.5 |
| Wynn Resorts, Limited | 133 | 155 | 145.22 |
Las Vegas Sands trades at $57.15, well below its $70.5 consensus target, signaling potential undervaluation. Wynn Resorts, at $113.39, also offers upside versus its $145.22 consensus, reflecting optimistic growth expectations.

Don’t Let Luck Decide Your Entry Point
Optimize your entry points with our advanced ProRealTime indicators. You’ll get efficient buy signals with precise price targets for maximum performance. Start outperforming now!
How do institutions grade them?
The following tables summarize institutional grades for Las Vegas Sands Corp. and Wynn Resorts, Limited:
Las Vegas Sands Corp. Grades
This table presents recent grades assigned by established financial institutions to Las Vegas Sands Corp.:
| Grading Company | Action | New Grade | Date |
|---|---|---|---|
| Mizuho | maintain | Outperform | 2026-01-29 |
| Stifel | maintain | Buy | 2026-01-29 |
| Deutsche Bank | maintain | Buy | 2026-01-29 |
| Macquarie | maintain | Outperform | 2026-01-29 |
| Wells Fargo | maintain | Equal Weight | 2026-01-29 |
| Barclays | maintain | Overweight | 2026-01-16 |
| Morgan Stanley | maintain | Equal Weight | 2026-01-16 |
| Goldman Sachs | upgrade | Buy | 2025-12-15 |
| UBS | maintain | Neutral | 2025-12-08 |
| Argus Research | maintain | Buy | 2025-12-01 |
Wynn Resorts, Limited Grades
The following table shows the latest grades provided by major grading firms for Wynn Resorts, Limited:
| Grading Company | Action | New Grade | Date |
|---|---|---|---|
| Macquarie | maintain | Outperform | 2026-02-13 |
| Stifel | maintain | Buy | 2026-02-13 |
| Wells Fargo | maintain | Overweight | 2026-02-13 |
| UBS | maintain | Buy | 2026-01-16 |
| Barclays | maintain | Overweight | 2026-01-16 |
| Morgan Stanley | maintain | Overweight | 2026-01-16 |
| Stifel | maintain | Buy | 2025-12-08 |
| Macquarie | maintain | Outperform | 2025-12-08 |
| JP Morgan | maintain | Overweight | 2025-12-08 |
| Jefferies | maintain | Buy | 2025-12-08 |
Which company has the best grades?
Wynn Resorts, Limited consistently receives “Outperform,” “Buy,” and “Overweight” ratings from multiple institutions. Las Vegas Sands Corp. shows more mixed grades, including “Equal Weight” and “Neutral.” Investors may view Wynn as the stronger consensus pick, potentially reflecting more favorable growth or risk perceptions.
Risks specific to each company
The following categories identify critical pressure points and systemic threats facing Las Vegas Sands Corp. and Wynn Resorts in the 2026 market environment:
1. Market & Competition
Las Vegas Sands Corp.
- Large integrated resorts in Asia and US face intense competition from regional players and emerging online gaming.
Wynn Resorts, Limited
- Operates high-end resorts with luxury focus, vulnerable to shifts in consumer spending and regional competition.
2. Capital Structure & Debt
Las Vegas Sands Corp.
- High debt-to-assets ratio at 73.6% signals leverage risk despite adequate interest coverage of 3.97x.
Wynn Resorts, Limited
- No reported debt data; interest coverage low at 1.85x, raising concerns on financial flexibility and solvency.
3. Stock Volatility
Las Vegas Sands Corp.
- Beta of 0.885 indicates below-market volatility, suggesting more stable price movements.
Wynn Resorts, Limited
- Beta of 1.014 implies market-like volatility, increasing risk in turbulent market phases.
4. Regulatory & Legal
Las Vegas Sands Corp.
- Exposure to Macau and Singapore gaming regulations requires constant compliance vigilance.
Wynn Resorts, Limited
- Regulatory risks heightened by multi-jurisdictional operations including Boston Harbor and Las Vegas.
5. Supply Chain & Operations
Las Vegas Sands Corp.
- Large-scale resorts depend on complex supply chains for construction and hospitality services, vulnerable to disruptions.
Wynn Resorts, Limited
- Diverse operations with multiple facilities increase operational complexity and supply chain risk.
6. ESG & Climate Transition
Las Vegas Sands Corp.
- Increasing ESG pressures to reduce carbon footprint amid large resort energy consumption.
Wynn Resorts, Limited
- Faces similar ESG challenges with added scrutiny on waterfront and urban development projects.
7. Geopolitical Exposure
Las Vegas Sands Corp.
- Significant exposure to China’s political and economic environment through Macau operations.
Wynn Resorts, Limited
- Regional exposure diversified but still sensitive to US-China tensions impacting Asian resorts.
Which company shows a better risk-adjusted profile?
Las Vegas Sands’ highest risk lies in its elevated leverage and geopolitical exposure in China. Wynn’s critical risk is its weak financial stability and operational complexity. LVS’s lower stock volatility and stronger profitability metrics support a better risk-adjusted profile. LVS’s Altman Z-Score in the grey zone contrasts with WYNN’s distress zone, underscoring Wynn’s greater bankruptcy risk. Recent financial ratios reveal LVS’s superior capital efficiency and liquidity, justifying heightened caution on Wynn’s credit risk.
Final Verdict: Which stock to choose?
Las Vegas Sands stands out for its robust capital efficiency and strong value creation, delivering a growing ROIC well above its cost of capital. Its leverage level remains a point of vigilance, potentially adding financial risk. This company suits aggressive growth portfolios seeking sustained profitability and market rebound.
Wynn Resorts offers a strategic moat rooted in its premium brand and recurring revenue streams, providing a safer harbor in volatile markets. Its financial profile is more conservative relative to Las Vegas Sands, appealing to investors who prioritize stability and moderate growth. It fits well with GARP portfolios balancing risk and return.
If you prioritize capital efficiency and high return on invested capital, Las Vegas Sands is the compelling choice due to its demonstrated value creation and growth momentum. However, if you seek stability and brand-driven resilience, Wynn Resorts offers better stability and a defensive posture despite its current financial challenges. Both require careful risk assessment aligned with your investment strategy.
Disclaimer: Investment carries a risk of loss of initial capital. The past performance is not a reliable indicator of future results. Be sure to understand risks before making an investment decision.
Go Further
I encourage you to read the complete analyses of Las Vegas Sands Corp. and Wynn Resorts, Limited to enhance your investment decisions: