Home > Comparison > Consumer Cyclical > LVS vs MGM
The strategic rivalry between Las Vegas Sands Corp. and MGM Resorts International shapes the global gambling, resorts, and casinos sector. Las Vegas Sands operates integrated resorts with a strong Asian footprint, emphasizing luxury and convention facilities. MGM Resorts focuses on a diversified portfolio of casino and entertainment resorts across the U.S. and Macau, including digital gaming ventures. This analysis weighs their contrasting models to identify the superior risk-adjusted investment for a diversified portfolio.
Table of contents
Companies Overview
Las Vegas Sands Corp. and MGM Resorts International shape the global integrated resort and casino landscape with strong U.S. and Asian footprints.
Las Vegas Sands Corp.: Integrated Resort Innovator
Las Vegas Sands Corp. dominates the integrated resorts market with properties in Macao, Singapore, and Las Vegas. Its core revenue stems from gaming, hospitality, retail, and convention services. The firm’s 2026 strategy emphasizes expanding premium amenities and high-margin convention facilities to sustain its competitive edge in luxury and business travel.
MGM Resorts International: Diversified Gaming & Entertainment Leader
MGM Resorts International operates a broad portfolio of casino resorts across the U.S. and Macau. It generates revenue through gaming, hotels, entertainment, and notably online sports betting via BetMGM. In 2026, MGM focuses on digital expansion and regional market penetration, blending physical resorts with growth in iGaming to capture evolving customer segments.
Strategic Collision: Similarities & Divergences
Both firms leverage integrated resorts to deliver gaming and hospitality but differ in digital strategy and geographic focus. Las Vegas Sands prioritizes high-end, convention-driven venues in Asia, while MGM pursues a hybrid model including U.S. regional operations and online betting. Their competition centers on premium customer acquisition and experiential differentiation. Investors face contrasting profiles: a luxury resort powerhouse versus a diversified gaming and digital contender.
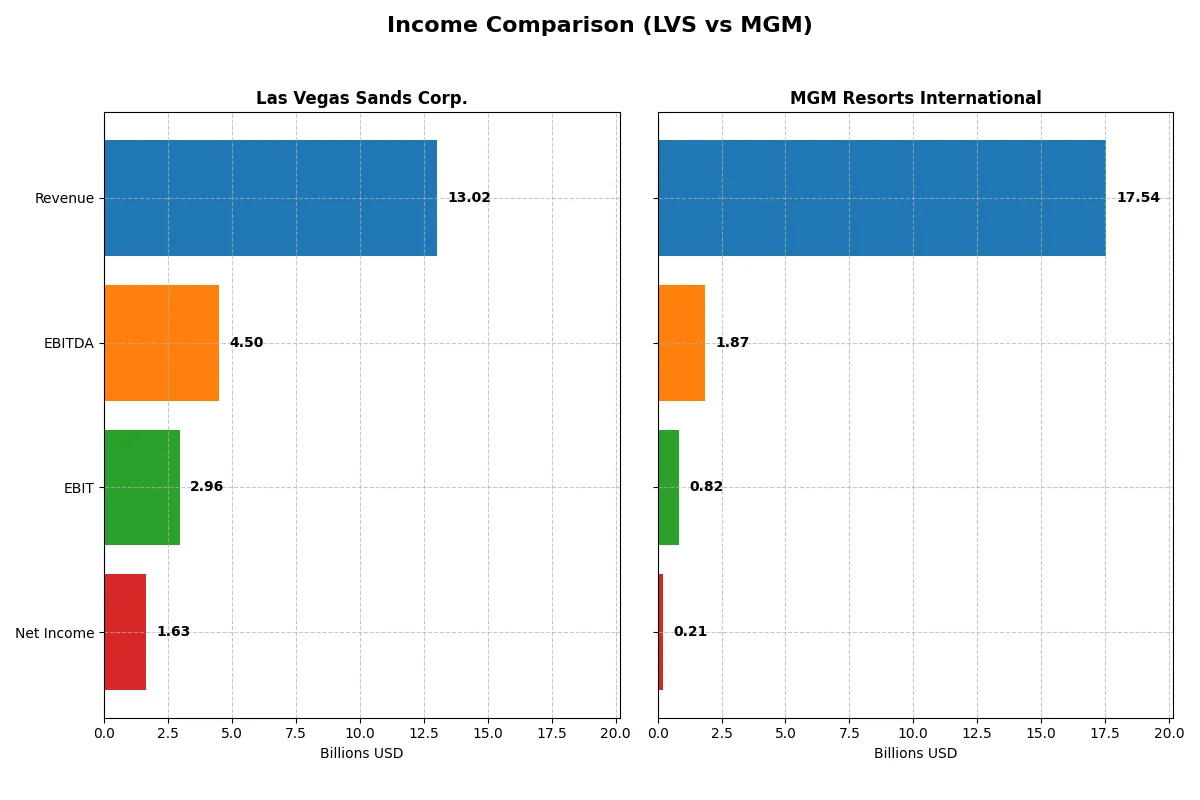
Income Statement Comparison
This table dissects the core profitability and scalability of both corporate engines to reveal who dominates the bottom line:
| Metric | Las Vegas Sands Corp. (LVS) | MGM Resorts International (MGM) |
|---|---|---|
| Revenue | 13.0B | 17.5B |
| Cost of Revenue | 9.3B | 9.8B |
| Operating Expenses | 579M | 6.8B |
| Gross Profit | 3.7B | 7.8B |
| EBITDA | 4.5B | 1.9B |
| EBIT | 3.0B | 821M |
| Interest Expense | 746M | 433M |
| Net Income | 1.6B | 206M |
| EPS | 2.35 | 0.77 |
| Fiscal Year | 2025 | 2025 |
Income Statement Analysis: The Bottom-Line Duel
This income statement comparison reveals the true efficiency and profitability momentum of two major players in the casino and resort sector.
Las Vegas Sands Corp. Analysis
Las Vegas Sands demonstrates strong revenue growth, reaching $13B in 2025 with a net income of $1.63B. Its gross margin remains healthy at 28.2%, while the net margin stands at 12.5%, reflecting solid profitability. Despite a slight dip in gross profit growth last year, the company sustains favorable EBIT and EPS growth, signaling operational momentum and improving efficiency.
MGM Resorts International Analysis
MGM’s revenue grew modestly to $17.5B in 2025, yet net income lagged at $206M, producing a thin net margin of 1.18%. The firm boasts a stronger gross margin at 44.4%, but EBIT margin is weak at 4.68%, indicating high operating costs. Recent declines in EBIT and net margin highlight challenges in converting revenue into bottom-line profits, suggesting operational inefficiencies.
Margin Strength vs. Earnings Momentum
Las Vegas Sands clearly outperforms MGM in net income growth and margin expansion over the period, with a robust 12.5% net margin versus MGM’s 1.18%. MGM’s superior gross margin is undermined by heavy operating expenses, leading to weaker profitability. For investors prioritizing earnings quality and sustainable margin improvement, Las Vegas Sands offers a more compelling profile.
Financial Ratios Comparison
These vital ratios act as a diagnostic tool to expose the underlying fiscal health, valuation premiums, and capital efficiency of each company:
| Ratios | Las Vegas Sands Corp. (LVS) | MGM Resorts International (MGM) |
|---|---|---|
| ROE | 102.3% | 8.5% |
| ROIC | 13.8% | 2.6% |
| P/E | 27.6 | 46.9 |
| P/B | 28.3 | 4.0 |
| Current Ratio | 1.14 | 1.23 |
| Quick Ratio | 1.13 | 1.20 |
| D/E | 10.15 | 23.11 |
| Debt-to-Assets | 73.6% | 135.7% |
| Interest Coverage | 4.14 | 2.31 |
| Asset Turnover | 0.59 | 0.42 |
| Fixed Asset Turnover | 1.12 | 0.60 |
| Payout ratio | 51.2% | 0% |
| Dividend yield | 1.85% | 0% |
| Fiscal Year | 2025 | 2025 |
Efficiency & Valuation Duel: The Vital Signs
Financial ratios serve as the company’s DNA, exposing operational strengths and hidden risks essential for sound investment decisions.
Las Vegas Sands Corp.
Las Vegas Sands exhibits impressive profitability with a ROE of 102.33% and a solid net margin of 12.5%, signaling operational excellence. However, its valuation appears stretched, reflected in a high P/E of 27.64 and P/B of 28.29. The company returns value with a modest 1.85% dividend yield, balancing capital allocation with reinvestment.
MGM Resorts International
MGM struggles with weak profitability; a ROE of 8.49% and net margin of 1.18% underscore operational inefficiency. It carries a steep valuation marked by a P/E of 46.86 and P/B of 3.98, intensifying risk. MGM pays no dividend, suggesting a focus on growth or debt management amid challenging fundamentals.
Premium Profitability vs. Stretched Valuation
Las Vegas Sands offers a superior balance of robust profitability despite a rich valuation. MGM’s weak returns and higher leverage, paired with an expensive multiple, raise red flags. Investors prioritizing operational strength and moderate income may prefer LVS, while MGM suits those chasing speculative growth amid elevated risk.
Which one offers the Superior Shareholder Reward?
I compare Las Vegas Sands (LVS) and MGM Resorts (MGM) on dividends and buybacks. LVS pays a 1.85% dividend yield with a 51% payout ratio, well-covered by free cash flow at 59%. MGM pays no dividend but invests heavily in growth. Both companies run buybacks, with MGM’s higher free cash flow per share ($5.5 vs. LVS’s $2.4) supporting more aggressive repurchases. LVS’s distribution model is more balanced and sustainable, combining steady dividends with buybacks. MGM’s reinvestment focus risks slower near-term shareholder rewards. I find LVS offers superior total shareholder return potential in 2026.
Comparative Score Analysis: The Strategic Profile
The radar chart reveals the fundamental DNA and trade-offs of Las Vegas Sands and MGM Resorts, highlighting key financial strengths and vulnerabilities:
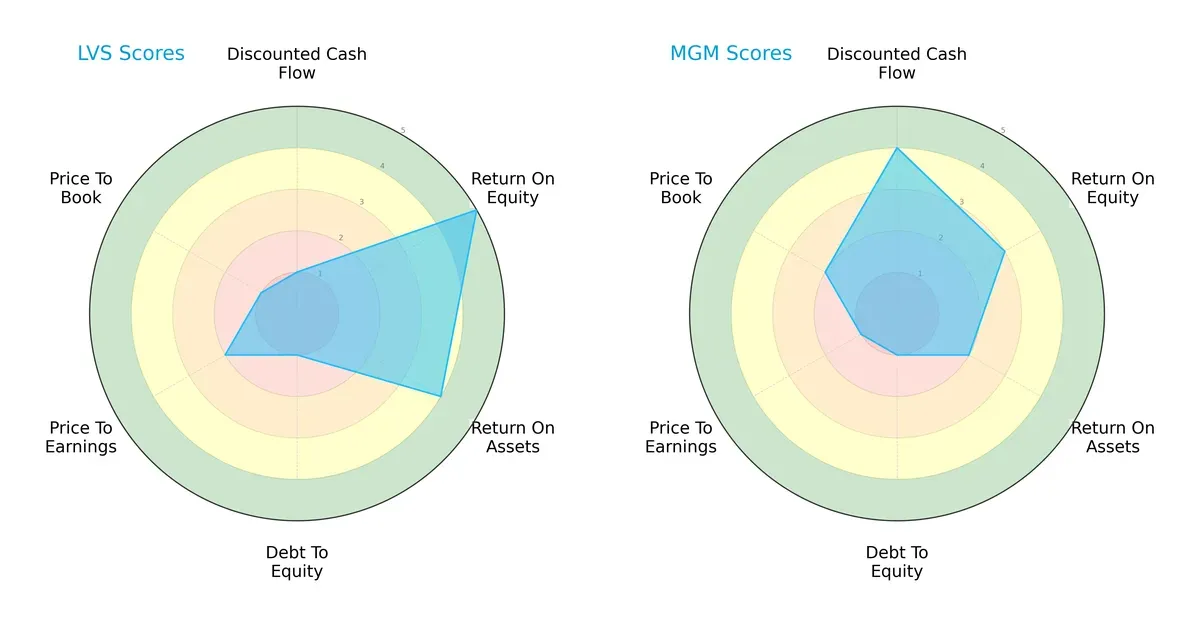
Las Vegas Sands excels in return on equity (ROE) and return on assets (ROA), signaling operational efficiency. Conversely, MGM leads in discounted cash flow (DCF) valuation, suggesting better future cash flow prospects. Both firms share weak debt-to-equity scores, indicating high leverage risk. Las Vegas Sands shows a more balanced profitability profile, while MGM relies heavily on valuation metrics.
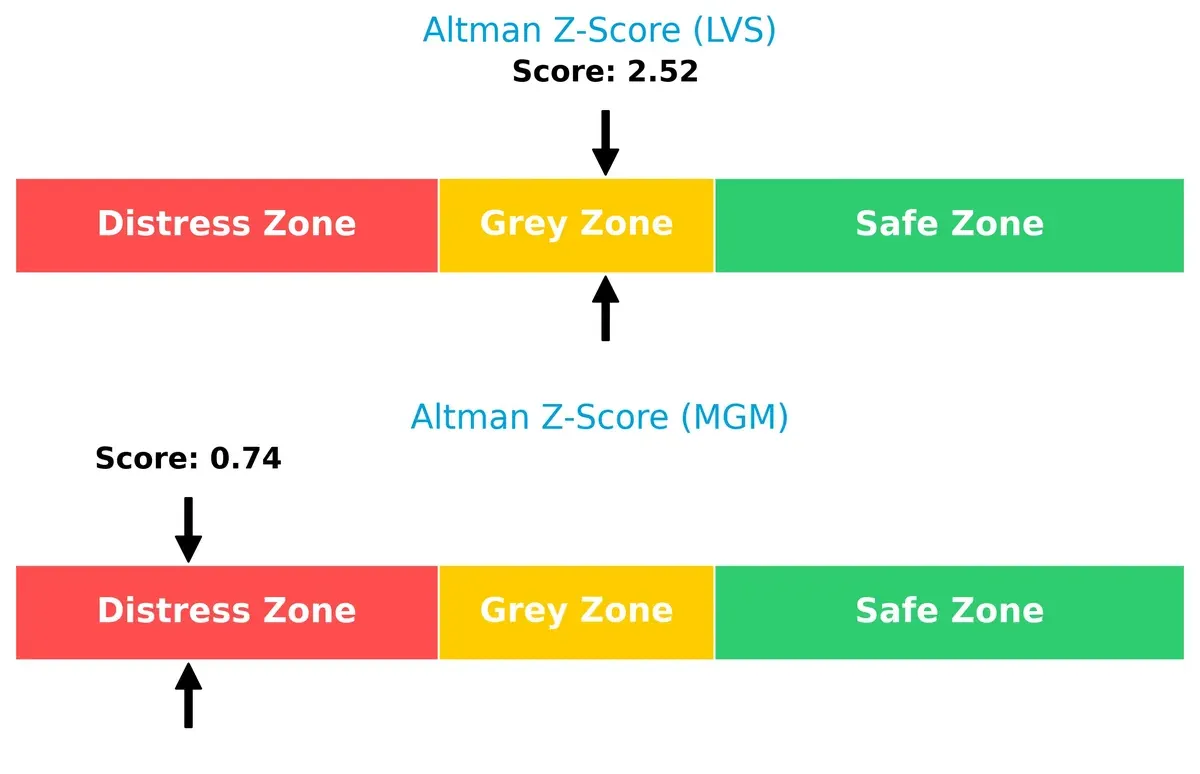
Bankruptcy Risk: Solvency Showdown
Las Vegas Sands’ Altman Z-Score of 2.52 places it in the grey zone, implying moderate bankruptcy risk, whereas MGM’s 0.74 signals distress and higher default probability in this cycle:
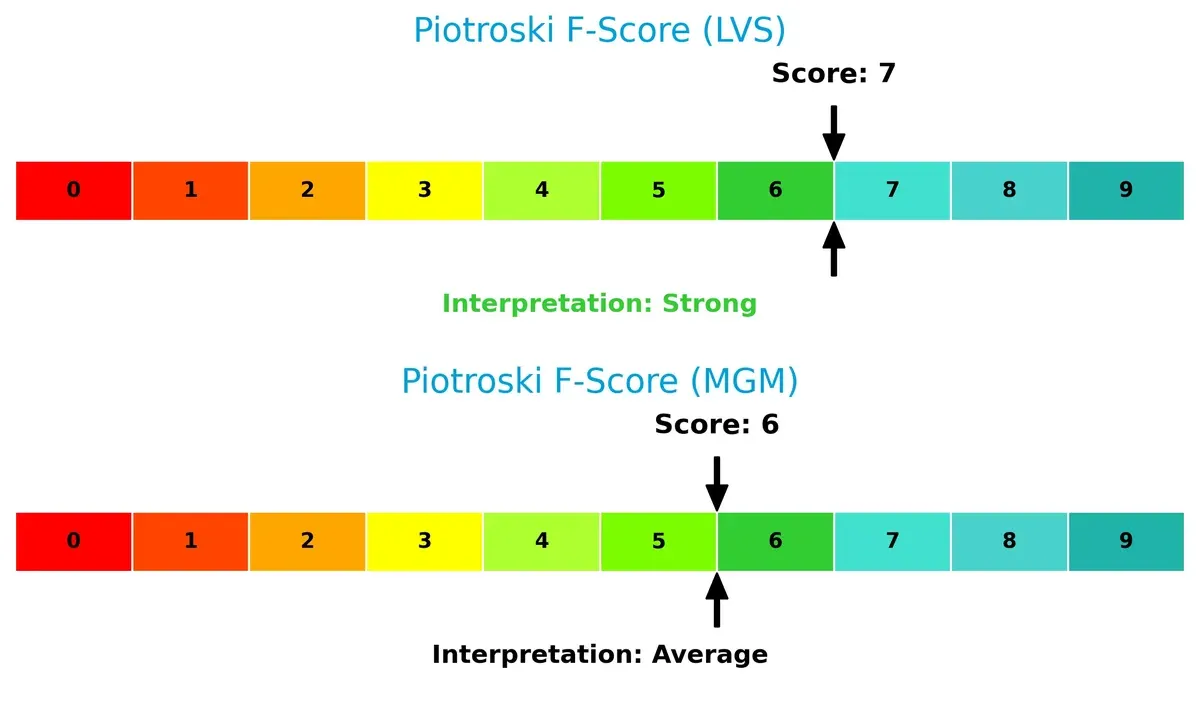
Financial Health: Quality of Operations
Las Vegas Sands outperforms MGM with a Piotroski F-Score of 7 versus 6, indicating stronger internal financial metrics and fewer operational red flags:
How are the two companies positioned?
This section dissects the operational DNA of LVS and MGM by comparing their revenue distribution and internal strengths and weaknesses. The final objective confronts their economic moats to identify which business model offers the most resilient, sustainable competitive advantage today.
Revenue Segmentation: The Strategic Mix
The following visual comparison dissects how Las Vegas Sands Corp. and MGM Resorts International diversify their income streams and where their primary sector bets lie:
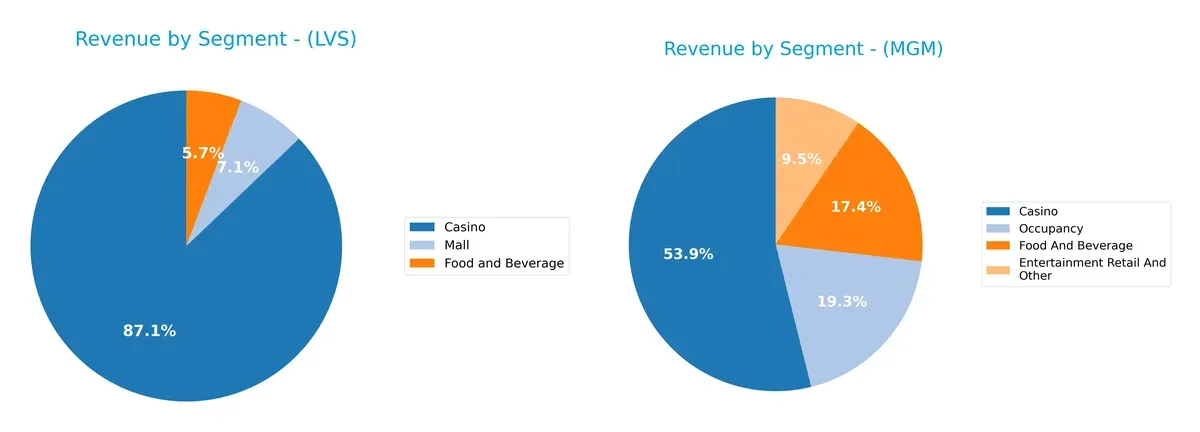
Las Vegas Sands anchors its revenue in Casinos with $9.8B in 2025, supplemented by modest Food & Beverage ($644M) and Mall ($801M) streams. MGM shows a more balanced spread: Casinos at $9.45B, but Food & Beverage ($3B) and Occupancy ($3.38B) significantly bolster its mix. MGM’s diversification reduces concentration risk, while LVS leans heavily on casino dominance, exposing it to sector cyclicality and regulatory shifts.
Strengths and Weaknesses Comparison
This table compares the strengths and weaknesses of Las Vegas Sands Corp. (LVS) and MGM Resorts International (MGM):
LVS Strengths
- Strong profitability with 12.5% net margin and 102.33% ROE
- Favorable ROIC of 13.82% above WACC
- Diversified revenue streams across Casino, Food & Beverage, Mall
- Significant global presence via Marina Bay Sands generating $5.59B
MGM Strengths
- Presence in major markets with $8.44B Las Vegas Strip Resorts revenue
- Favorable WACC at 3.8% indicating lower capital costs
- Moderate diversification including Entertainment Retail and Food & Beverage
- Favorable quick ratio of 1.2 supports short-term liquidity
LVS Weaknesses
- High debt-to-assets ratio at 73.62% signals leverage risk
- Elevated PE and PB ratios suggest premium valuation
- Debt-to-equity at 10.15 indicates aggressive leverage
- Neutral current ratio at 1.14 signals modest liquidity buffer
MGM Weaknesses
- Weak profitability with 1.18% net margin and 8.49% ROE
- Very high debt-to-assets at 135.73% and debt-to-equity of 23.11
- Unfavorable asset turnover ratios indicate operational inefficiency
- No dividend yield and low interest coverage of 1.9 raise financial risk
Overall, LVS exhibits superior profitability and global diversification but carries significant leverage risk. MGM’s financials reveal weaker profitability and higher financial risk, despite a solid market presence. Both companies must balance growth with prudent capital structure management to sustain competitive positioning.
The Moat Duel: Analyzing Competitive Defensibility
A structural moat is the only defense protecting long-term profits from relentless competition erosion. Here’s how these two casino giants compare:
Las Vegas Sands Corp.: Intangible Assets & Scale Moat
LVS leverages iconic integrated resorts and brand prestige to sustain high ROIC above WACC by 7.3%. Margin stability and 478% ROIC growth signal a widening moat as it expands in Asia and premium markets.
MGM Resorts International: Cost Disadvantage with Fragmented Scale
MGM’s moat hinges on a broad asset base but suffers from declining ROIC and shrinking margins. Unlike LVS, MGM’s capital inefficiency and 45% ROIC drop threaten its competitive positioning despite a strong Las Vegas presence.
Capital Efficiency vs. Market Breadth: The Moat Verdict
LVS’s deeper moat stems from superior capital allocation and intangible asset strength. MGM’s value destruction and margin pressure expose it to margin erosion. LVS stands better poised to defend and grow market share.
Which stock offers better returns?
Over the past year, Las Vegas Sands Corp. showed strong price gains despite recent weakness, while MGM Resorts International experienced a sustained decline with some stabilization late in the period.
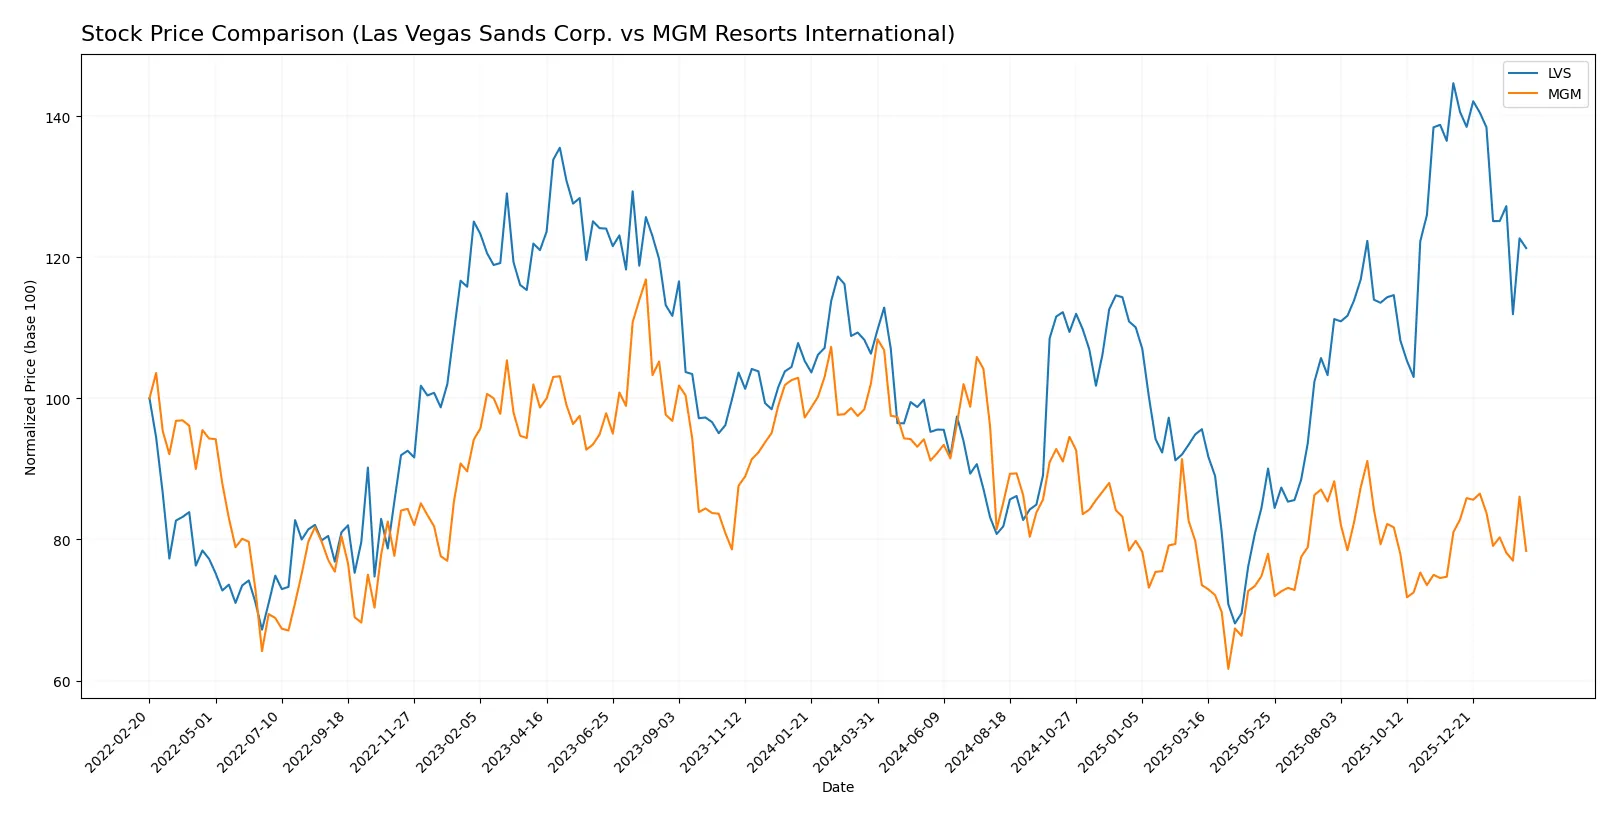
Trend Comparison
Las Vegas Sands Corp. posted a 14.07% price increase over 12 months, indicating a bullish trend with decelerating momentum and notable volatility (8.21 std deviation). The stock peaked at 68.16 and hit a low of 32.09.
MGM Resorts International declined 23.23% in the same period, marking a bearish trend with decelerating negative momentum and moderate volatility (4.1 std deviation). Its price ranged from 47.21 down to 26.86.
Comparing both, Las Vegas Sands Corp. delivered the highest market performance, outperforming MGM Resorts International by a wide margin over the past year.
Target Prices
Analysts present a mixed but constructive outlook on Las Vegas Sands and MGM Resorts.
| Company | Target Low | Target High | Consensus |
|---|---|---|---|
| Las Vegas Sands Corp. | 63 | 80 | 70.5 |
| MGM Resorts International | 33 | 62 | 41.86 |
Las Vegas Sands shows a target consensus 23% above its $57.15 current price, signaling optimism. MGM’s consensus is about 22% above its $34.14 price, indicating moderate upside potential.

Don’t Let Luck Decide Your Entry Point
Optimize your entry points with our advanced ProRealTime indicators. You’ll get efficient buy signals with precise price targets for maximum performance. Start outperforming now!
How do institutions grade them?
Las Vegas Sands Corp. Grades
Here are the recent grades assigned by various financial institutions to Las Vegas Sands Corp.:
| Grading Company | Action | New Grade | Date |
|---|---|---|---|
| Mizuho | maintain | Outperform | 2026-01-29 |
| Stifel | maintain | Buy | 2026-01-29 |
| Deutsche Bank | maintain | Buy | 2026-01-29 |
| Macquarie | maintain | Outperform | 2026-01-29 |
| Wells Fargo | maintain | Equal Weight | 2026-01-29 |
| Barclays | maintain | Overweight | 2026-01-16 |
| Morgan Stanley | maintain | Equal Weight | 2026-01-16 |
| Goldman Sachs | upgrade | Buy | 2025-12-15 |
| UBS | maintain | Neutral | 2025-12-08 |
| Argus Research | maintain | Buy | 2025-12-01 |
MGM Resorts International Grades
Here are the recent grades assigned by various financial institutions to MGM Resorts International:
| Grading Company | Action | New Grade | Date |
|---|---|---|---|
| Citigroup | maintain | Neutral | 2026-02-09 |
| Stifel | maintain | Buy | 2026-02-06 |
| JP Morgan | maintain | Neutral | 2026-02-06 |
| Macquarie | maintain | Outperform | 2026-02-06 |
| Truist Securities | maintain | Hold | 2026-02-06 |
| Morgan Stanley | downgrade | Underweight | 2026-01-16 |
| Truist Securities | downgrade | Hold | 2026-01-13 |
| Truist Securities | maintain | Buy | 2026-01-02 |
| Barclays | downgrade | Equal Weight | 2025-12-17 |
| Citigroup | downgrade | Neutral | 2025-11-21 |
Which company has the best grades?
Las Vegas Sands consistently receives Buy or Outperform ratings, reflecting stronger institutional confidence. MGM shows mixed grades with recent downgrades, indicating more cautious outlooks. This divergence may influence investor sentiment and risk assessments.
Risks specific to each company
The following categories identify critical pressure points and systemic threats facing Las Vegas Sands Corp. and MGM Resorts International in the 2026 market environment:
1. Market & Competition
Las Vegas Sands Corp.
- Strong market position with integrated resorts in Asia and US; faces intense regional competition.
MGM Resorts International
- Diverse portfolio but struggles with lower margins and intense competition on the Las Vegas Strip.
2. Capital Structure & Debt
Las Vegas Sands Corp.
- High debt-to-assets at 74%; interest coverage moderate at 3.97x; leverage poses financial risk.
MGM Resorts International
- Very high debt-to-assets at 136%; weak interest coverage at 1.9x; elevated default risk.
3. Stock Volatility
Las Vegas Sands Corp.
- Beta of 0.885 indicates lower volatility than market; relatively stable stock price.
MGM Resorts International
- Beta of 1.404 signals high volatility; stock price more sensitive to market swings.
4. Regulatory & Legal
Las Vegas Sands Corp.
- Exposure to regulatory changes in Asia and US gaming markets; potential licensing risks.
MGM Resorts International
- Regulatory scrutiny in US and Macau; online betting expansion faces compliance challenges.
5. Supply Chain & Operations
Las Vegas Sands Corp.
- Operations concentrated in resorts with complex supply needs; moderate operational efficiency.
MGM Resorts International
- Larger workforce and multiple resort segments increase operational complexity and risk.
6. ESG & Climate Transition
Las Vegas Sands Corp.
- Increasing pressure to improve environmental footprint in Asia and US markets.
MGM Resorts International
- ESG initiatives underway but lagging industry peers; reputational risk remains.
7. Geopolitical Exposure
Las Vegas Sands Corp.
- Significant exposure to China and Singapore geopolitical tensions affecting Macau operations.
MGM Resorts International
- US-centric with some Macau exposure; geopolitical risks less pronounced but still relevant.
Which company shows a better risk-adjusted profile?
Las Vegas Sands faces its biggest risk from heavy leverage and regional geopolitical exposure, while MGM struggles with high debt and operational inefficiencies. LVS’s lower stock volatility and stronger profitability improve its risk-adjusted profile. The recent Altman Z-Score places LVS in a moderate risk zone versus MGM’s distress zone, confirming LVS’s relatively better stability.
Final Verdict: Which stock to choose?
Las Vegas Sands Corp. (LVS) stands out with its robust ability to generate high returns on invested capital well above its cost of capital. This cash-generating machine displays a sustainable competitive edge and improving profitability. A point of vigilance is its elevated debt load, which could pressure financial flexibility. LVS suits aggressive growth portfolios willing to navigate leverage risks.
MGM Resorts International (MGM) holds a strategic moat rooted in its established brand and asset base, but it struggles with declining returns and value destruction. Its financial safety profile is weaker than LVS, marked by heavy indebtedness and lower profitability. MGM fits investors seeking value turnaround plays or GARP strategies that tolerate volatility for potential recovery.
If you prioritize durable economic moats and superior capital efficiency, LVS is the compelling choice due to its strong value creation and growth trajectory. However, if you seek a contrarian opportunity with turnaround potential, MGM offers better stability in brand presence despite financial headwinds. Each scenario demands strict risk awareness and portfolio alignment.
Disclaimer: Investment carries a risk of loss of initial capital. The past performance is not a reliable indicator of future results. Be sure to understand risks before making an investment decision.
Go Further
I encourage you to read the complete analyses of Las Vegas Sands Corp. and MGM Resorts International to enhance your investment decisions: