The J. M. Smucker Company (SJM) and Lamb Weston Holdings, Inc. (LW) are two prominent players in the packaged foods industry, each with distinct product portfolios and market approaches. Smucker offers a diverse range of branded food and beverage products, while Lamb Weston specializes in value-added frozen potato products. Their overlapping presence in consumer food markets and innovation in product offerings make them compelling candidates for comparison. In this article, I will help you determine which company presents the most attractive investment opportunity.
Table of contents
Companies Overview
I will begin the comparison between The J. M. Smucker Company and Lamb Weston Holdings, Inc. by providing an overview of these two companies and their main differences.
The J. M. Smucker Company Overview
The J. M. Smucker Company manufactures and markets branded food and beverage products worldwide. Operating in segments like U.S. Retail Pet Foods, Coffee, and Consumer Foods, it offers a broad portfolio including coffee, peanut butter, fruit spreads, pet food, and frozen snacks. Founded in 1897 and headquartered in Orrville, Ohio, Smucker serves diverse retail channels including food retailers, online stores, and pet specialty outlets.
Lamb Weston Holdings, Inc. Overview
Lamb Weston Holdings produces, distributes, and markets value-added frozen potato products globally. Its operations span four segments: Global, Foodservice, Retail, and Other, offering products under brands like Lamb Weston, Grown in Idaho, and Alexia. Incorporated in 1950 and based in Eagle, Idaho, Lamb Weston serves retail and foodservice customers, including grocery, mass merchants, restaurants, and convenience stores.
Key similarities and differences
Both companies operate in the packaged foods industry within the consumer defensive sector, serving retail and foodservice markets. Smucker has a more diversified product range across food and pet segments, while Lamb Weston focuses primarily on frozen potato products and related offerings. Smucker’s longer history contrasts with Lamb Weston’s more recent IPO in 2016, reflecting different growth and market positioning strategies.
Income Statement Comparison
The following table compares key income statement metrics for The J. M. Smucker Company and Lamb Weston Holdings, Inc. for the fiscal year 2025.

| Metric | The J. M. Smucker Company | Lamb Weston Holdings, Inc. |
|---|---|---|
| Market Cap | 10.7B | 5.8B |
| Revenue | 8.7B | 6.5B |
| EBITDA | -156M | 1.1B |
| EBIT | -658M | 665M |
| Net Income | -1.23B | 357M |
| EPS | -11.57 | 2.51 |
| Fiscal Year | 2025 | 2025 |
Income Statement Interpretations
The J. M. Smucker Company
From 2021 to 2025, Smucker’s revenue showed moderate growth of 9%, but net income declined sharply, reflecting deteriorating profitability. Gross margin remained favorable at 38.79%, yet EBIT and net margins turned negative in 2025, signaling margin compression. The latest fiscal year saw revenue growth slow to 6.7%, while earnings and margins worsened significantly, indicating operational challenges.
Lamb Weston Holdings, Inc.
Lamb Weston experienced strong revenue growth of 75.7% over 2021–2025, with net income rising 12.4%, supported by stable gross and EBIT margins. The 2025 fiscal year showed a slight revenue decline of 0.25% and a sharp drop in net margin and earnings, reflecting recent margin pressures. Despite the recent dip, Lamb Weston maintains positive margins and earnings growth over the longer term.
Which one has the stronger fundamentals?
Smucker’s weak EBIT and negative net margins in 2025 contrast with Lamb Weston’s positive EBIT and net margins, indicating stronger profitability fundamentals for Lamb Weston. While Lamb Weston’s recent year showed some margin deterioration, its overall revenue and earnings growth outpace Smucker’s declining profitability, resulting in a more balanced but still cautious fundamental outlook.
Financial Ratios Comparison
The table below presents a side-by-side comparison of key financial ratios for The J. M. Smucker Company (SJM) and Lamb Weston Holdings, Inc. (LW) based on their most recent fiscal year data.
| Ratios | The J. M. Smucker Company (SJM) | Lamb Weston Holdings, Inc. (LW) |
|---|---|---|
| ROE | -20.2% | 20.6% |
| ROIC | -5.1% | 7.4% |
| P/E | -10.1 | 22.2 |
| P/B | 2.03 | 4.56 |
| Current Ratio | 0.81 | 1.38 |
| Quick Ratio | 0.35 | 0.68 |
| D/E (Debt-to-Equity) | 1.28 | 2.39 |
| Debt-to-Assets | 44.2% | 56.2% |
| Interest Coverage | -1.88 | 3.70 |
| Asset Turnover | 0.50 | 0.87 |
| Fixed Asset Turnover | 2.73 | 1.68 |
| Payout ratio | -37.0% | 57.9% |
| Dividend yield | 3.68% | 2.61% |
Interpretation of the Ratios
The J. M. Smucker Company
The J. M. Smucker Company shows predominantly unfavorable financial ratios, including negative net margin (-14.1%) and return on equity (-20.23%), signaling profitability and efficiency challenges. Liquidity ratios are weak with a current ratio of 0.81 and high debt levels. The dividend yield is favorable at 3.68%, indicating consistent shareholder returns despite financial strain.
Lamb Weston Holdings, Inc.
Lamb Weston presents a mixed but relatively stronger ratio profile, with a positive net margin of 5.54% and a favorable return on equity of 20.56%. However, some liquidity and leverage ratios are less favorable, such as a debt-to-equity ratio of 2.39 and a quick ratio of 0.68. The dividend yield stands at 2.61%, supporting moderate shareholder income.
Which one has the best ratios?
Lamb Weston Holdings, Inc. holds a more balanced ratio structure with fewer unfavorable metrics compared to The J. M. Smucker Company, which struggles with profitability and liquidity. While both companies pay dividends, Lamb Weston’s stronger profitability and moderate leverage present a comparatively better financial standing.
Strategic Positioning
This section compares the strategic positioning of The J. M. Smucker Company (SJM) and Lamb Weston Holdings, Inc. (LW) including Market position, Key segments, and exposure to disruption:
The J. M. Smucker Company
- Established market leader in packaged foods with $10.7B market cap; faces moderate competitive pressure.
- Diverse segments: U.S. Retail Pet Foods, Coffee, Consumer Foods, and International sales driving growth.
- Limited exposure to technological disruption due to traditional packaged food products and established brands.
Lamb Weston Holdings, Inc.
- Mid-sized player with $5.8B market cap focusing on frozen potato products; competitive pressure from foodservice and retail sectors.
- Concentrated segments: Global, Foodservice, Retail, and Other frozen potato products dominate revenues.
- Moderate exposure linked to innovations in frozen foods and foodservice efficiency improvements.
The J. M. Smucker Company vs Lamb Weston Holdings, Inc. Positioning
SJM follows a diversified approach across multiple food categories, offering resilience but complexity, while LW concentrates on frozen potato products, allowing focused operational expertise but higher segment risk.
Which has the best competitive advantage?
LW shows a slightly favorable moat with value creation despite declining ROIC, whereas SJM is very unfavorable, destroying value with a sharply declining ROIC, indicating a weaker competitive advantage.
Stock Comparison
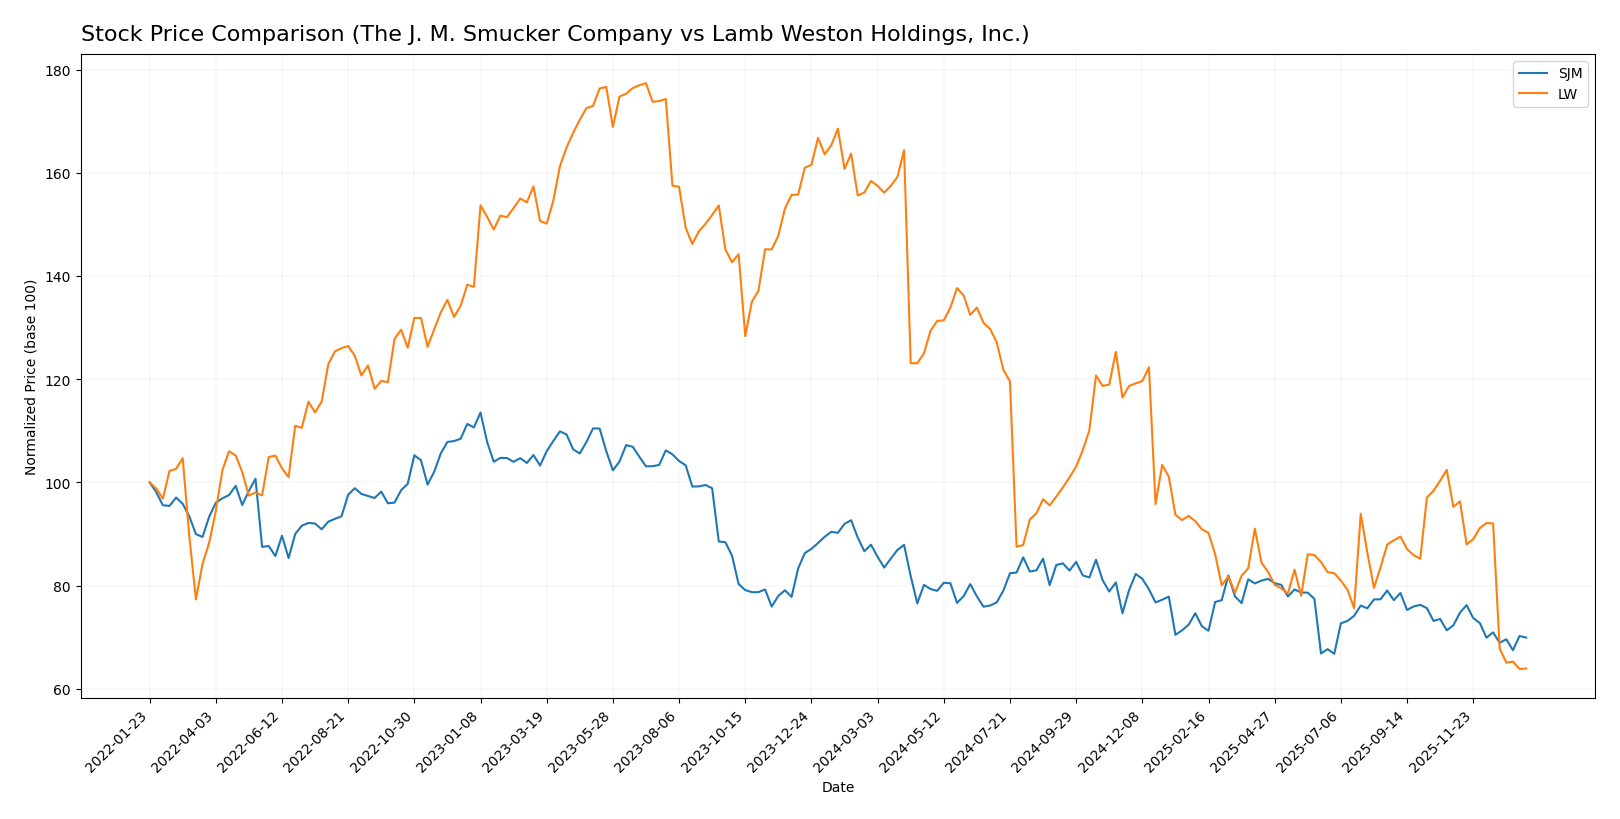
The stock price movements of The J. M. Smucker Company and Lamb Weston Holdings, Inc. over the past year reveal significant declines with distinct trading volume dynamics and trend decelerations.
Trend Analysis
The J. M. Smucker Company (SJM) exhibited a bearish trend with a -20.49% price decline over the past 12 months, showing deceleration and a standard deviation of 6.98. The price ranged between 125.92 and 95.63.
Lamb Weston Holdings, Inc. (LW) showed a stronger bearish trend, with a -59.65% price drop over the same period, also decelerating. It experienced higher volatility, with a standard deviation of 15.2 and prices fluctuating between 106.53 and 41.37.
Comparing the two, SJM delivered a higher market performance than LW, as its stock price decline was significantly less severe over the last 12 months.
Target Prices
Analysts present a clear target price consensus for both The J. M. Smucker Company and Lamb Weston Holdings, Inc.
| Company | Target High | Target Low | Consensus |
|---|---|---|---|
| The J. M. Smucker Company | 117 | 110 | 113.4 |
| Lamb Weston Holdings, Inc. | 68 | 46 | 52.67 |
The consensus target prices for both companies suggest moderate upside potential compared to current prices. Smucker’s consensus at 113.4 is notably above its current 100.12 USD price, while Lamb Weston’s 52.67 target also exceeds its present 41.43 USD price.
Analyst Opinions Comparison
This section compares analysts’ ratings and grades for The J. M. Smucker Company and Lamb Weston Holdings, Inc.:
Rating Comparison
The J. M. Smucker Company Rating
- Rating: C+ with a very favorable status
- Discounted Cash Flow Score: 5, indicating very favorable DCF
- ROE Score: 1, very unfavorable efficiency in equity use
- ROA Score: 1, very unfavorable asset utilization
- Debt To Equity Score: 1, very unfavorable financial risk
- Overall Score: 2, moderate overall financial standing
Lamb Weston Holdings, Inc. Rating
- Rating: B with a very favorable status
- Discounted Cash Flow Score: 4, indicating favorable DCF
- ROE Score: 5, very favorable efficiency in equity use
- ROA Score: 4, favorable asset utilization
- Debt To Equity Score: 1, very unfavorable financial risk
- Overall Score: 3, moderate overall financial standing
Which one is the best rated?
Based strictly on the provided data, Lamb Weston Holdings, Inc. holds a better overall rating (B) and higher scores in ROE and ROA, despite sharing a very unfavorable debt-to-equity score with The J. M. Smucker Company.
Scores Comparison
Here is a comparison of the Altman Z-Score and Piotroski Score for the two companies:
SJM Scores
- Altman Z-Score: 0.90, distress zone indicating high bankruptcy risk.
- Piotroski Score: 4, average financial strength.
LW Scores
- Altman Z-Score: 2.75, grey zone with moderate bankruptcy risk.
- Piotroski Score: 9, very strong financial health rating.
Which company has the best scores?
Based on the data, LW shows better scores with a higher Altman Z-Score in the grey zone and a very strong Piotroski Score of 9. SJM is in the distress zone with a lower Altman Z-Score and only an average Piotroski Score of 4.
Grades Comparison
Here is a comparison of recent grades assigned to The J. M. Smucker Company and Lamb Weston Holdings, Inc.:
The J. M. Smucker Company Grades
This table shows recent grades from reputable financial firms for The J. M. Smucker Company.
| Grading Company | Action | New Grade | Date |
|---|---|---|---|
| TD Cowen | Maintain | Hold | 2026-01-08 |
| Bernstein | Maintain | Market Perform | 2025-11-26 |
| Stifel | Maintain | Hold | 2025-11-26 |
| UBS | Maintain | Buy | 2025-11-26 |
| Morgan Stanley | Maintain | Overweight | 2025-11-26 |
| JP Morgan | Maintain | Overweight | 2025-11-26 |
| Stifel | Maintain | Hold | 2025-10-24 |
| Argus Research | Downgrade | Hold | 2025-09-12 |
| Barclays | Maintain | Equal Weight | 2025-08-29 |
| JP Morgan | Maintain | Overweight | 2025-08-28 |
The overall trend shows a mixed grading pattern with a majority of Hold and Overweight ratings, reflecting a moderate outlook.
Lamb Weston Holdings, Inc. Grades
This table presents recent analyst grades for Lamb Weston Holdings, Inc.
| Grading Company | Action | New Grade | Date |
|---|---|---|---|
| Wells Fargo | Maintain | Overweight | 2025-12-23 |
| Barclays | Maintain | Overweight | 2025-12-23 |
| B of A Securities | Maintain | Neutral | 2025-12-22 |
| Stifel | Maintain | Hold | 2025-12-22 |
| Deutsche Bank | Maintain | Hold | 2025-12-22 |
| Wells Fargo | Maintain | Overweight | 2025-10-01 |
| B of A Securities | Maintain | Neutral | 2025-10-01 |
| Barclays | Maintain | Overweight | 2025-07-25 |
| Wells Fargo | Maintain | Overweight | 2025-07-24 |
| Wells Fargo | Maintain | Overweight | 2025-07-09 |
Grades for Lamb Weston show a strong consistency of Overweight ratings with some Neutral and Hold grades, indicating positive sentiment overall.
Which company has the best grades?
Both companies hold a consensus rating of “Hold,” but Lamb Weston Holdings, Inc. has a higher proportion of Overweight ratings compared to The J. M. Smucker Company’s mixed Hold and Overweight grades. This difference may affect investor sentiment regarding growth potential and risk exposure.
Strengths and Weaknesses
Below is a comparative overview of key strengths and weaknesses for The J. M. Smucker Company (SJM) and Lamb Weston Holdings, Inc. (LW) based on the most recent financial and operational data.
| Criterion | The J. M. Smucker Company (SJM) | Lamb Weston Holdings, Inc. (LW) |
|---|---|---|
| Diversification | Highly diversified product portfolio with strong segments in U.S. Retail Pet Foods (1.66B), Coffee (2.81B), Consumer Foods (1.88B), and international presence | Diversified across Foodservice, Global, and Retail segments with growth in Global Segment (2.93B) and Foodservice (1.49B) |
| Profitability | Negative profitability trends: net margin -14.1%, ROE -20.23%, ROIC -5.09%, indicating value destruction | Moderate profitability: net margin 5.54%, ROE 20.56%, ROIC 7.43%, showing value creation but with declining ROIC |
| Innovation | Limited recent innovation evidence; profitability and ROIC trends indicate challenges in sustaining competitive advantage | Innovation supported by global expansion and segment growth, though ROIC trend is slightly declining |
| Global presence | Steady international sales (~1.2B), but primarily US-focused with slower growth abroad | Strong global segment growth (2.93B), indicating expanding international footprint |
| Market Share | Established brand presence in multiple categories but facing profitability pressures | Growing market share in frozen foods with increasing revenue in global and foodservice segments |
Key takeaways: Lamb Weston shows stronger value creation and moderate profitability with expanding global reach, while The J. M. Smucker Company struggles with negative profitability and value destruction despite diversified product lines. Investors should weigh LW’s growth potential against SJM’s current financial headwinds.
Risk Analysis
Below is a comparison of key risks for The J. M. Smucker Company (SJM) and Lamb Weston Holdings, Inc. (LW) as of 2025:
| Metric | The J. M. Smucker Company (SJM) | Lamb Weston Holdings, Inc. (LW) |
|---|---|---|
| Market Risk | Low beta (0.22) indicates lower market volatility | Moderate beta (0.44), moderate volatility |
| Debt level | Debt-to-equity 1.28 (unfavorable), interest coverage negative (-1.84) | High debt-to-equity 2.39 (unfavorable), interest coverage 3.69 (neutral) |
| Regulatory Risk | Moderate, food and beverage regulations | Moderate, frozen food and agricultural regulations |
| Operational Risk | Medium, diversified product lines but low current/quick ratios | Medium, reliance on frozen potato products |
| Environmental Risk | Moderate, exposure via agricultural supply chains | Moderate, agricultural inputs and processing impact |
| Geopolitical Risk | Low, primarily US-focused operations | Low to moderate, global distribution presence |
The most impactful risks are SJM’s weak financial health with negative profitability, poor liquidity, and distress-level Altman Z-score, signaling bankruptcy risk. LW shows better profitability and financial strength but carries higher debt levels, posing moderate financial risk. Both face typical regulatory and environmental risks inherent in the food industry.
Which Stock to Choose?
The J. M. Smucker Company (SJM) exhibits a mixed income evolution with favorable gross margin but unfavorable net and EBIT margins. Its financial ratios reveal mostly unfavorable profitability measures and weak liquidity, with a very favorable overall rating of C+ despite value destruction indicated by its declining ROIC below WACC.
Lamb Weston Holdings, Inc. (LW) shows a neutral income statement trend with generally favorable profitability ratios and moderate financial stability. However, it carries higher debt levels and mixed valuation metrics, supported by a slightly favorable moat and a very favorable B rating reflecting stronger return on equity and asset utilization.
Investors focused on value creation and stronger profitability metrics might see LW as more favorable due to its positive ROIC versus WACC and better ratings, while those prioritizing discounted cash flow valuation and dividend yield could interpret SJM’s profile differently. Risk-averse investors might weigh LW’s moderate financial stability against SJM’s weaker liquidity and value destruction signals.
Disclaimer: Investment carries a risk of loss of initial capital. The past performance is not a reliable indicator of future results. Be sure to understand risks before making an investment decision.
Go Further
I encourage you to read the complete analyses of The J. M. Smucker Company and Lamb Weston Holdings, Inc. to enhance your investment decisions: