Investors seeking value in the packaged foods industry often weigh options between Pilgrim’s Pride Corporation (PPC) and Lamb Weston Holdings, Inc. (LW). Both companies operate in consumer defensive sectors with strong market presence and innovation in food processing and distribution. PPC focuses on poultry and pork products, while LW specializes in frozen potato products. This article will analyze their strengths to help you decide which company could be the better investment choice for your portfolio.

Table of contents
Companies Overview
I will begin the comparison between Pilgrim’s Pride Corporation and Lamb Weston Holdings, Inc. by providing an overview of these two companies and their main differences.
Pilgrim’s Pride Corporation Overview
Pilgrim’s Pride Corporation specializes in the production, processing, marketing, and distribution of fresh, frozen, and value-added chicken and pork products. Operating internationally, the company serves retailers, distributors, and foodservice operators. Its portfolio includes a wide range of meat products marketed under multiple brand names. Founded in 1946 and headquartered in Greeley, Colorado, Pilgrim’s Pride is a subsidiary of JBS S.A. and employs approximately 62,600 people.
Lamb Weston Holdings, Inc. Overview
Lamb Weston Holdings, Inc. produces and markets value-added frozen potato products globally. Its operations include segments for global, foodservice, retail, and others, offering products under the Lamb Weston brand as well as licensed and retailer brands. Founded in 1950 and based in Eagle, Idaho, the company serves a variety of customers including grocery stores, restaurants, and educational institutions. Lamb Weston employs about 10,700 full-time workers.
Key similarities and differences
Both Pilgrim’s Pride and Lamb Weston operate in the packaged foods industry, serving retail and foodservice markets with value-added products. Pilgrim’s Pride focuses on meat products such as chicken and pork, while Lamb Weston specializes in frozen potato items. The companies differ in scale, with Pilgrim’s Pride having a significantly larger workforce and broader international reach compared to Lamb Weston’s more specialized product line and smaller employee base.
Income Statement Comparison
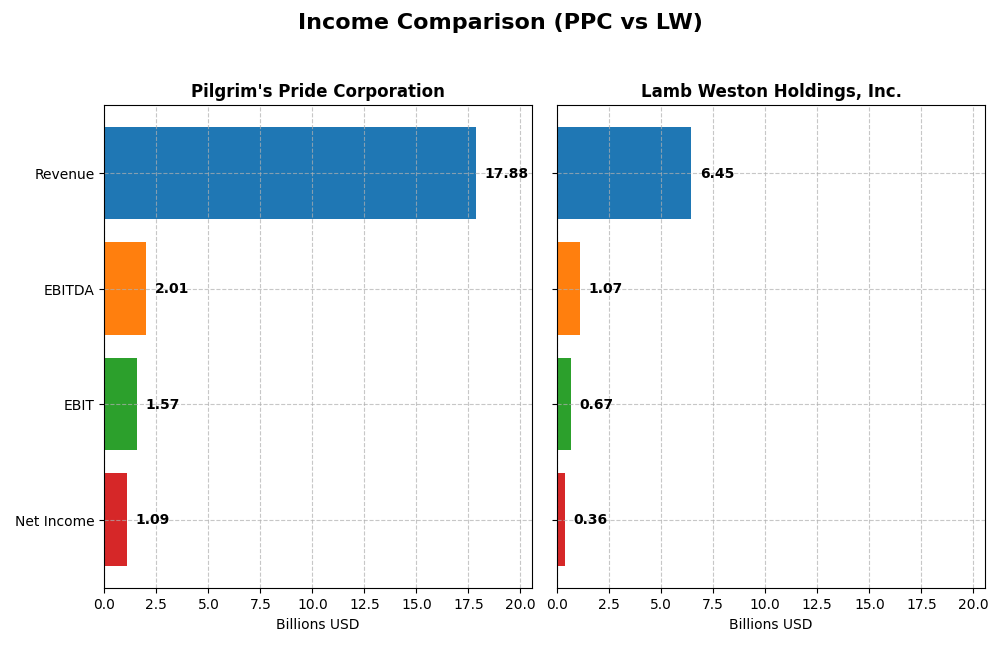
This table presents a side-by-side comparison of key income statement metrics for Pilgrim’s Pride Corporation and Lamb Weston Holdings, Inc. based on their most recent fiscal year data.
| Metric | Pilgrim’s Pride Corporation | Lamb Weston Holdings, Inc. |
|---|---|---|
| Market Cap | 9.5B | 5.8B |
| Revenue | 17.9B | 6.5B |
| EBITDA | 2.0B | 1.1B |
| EBIT | 1.6B | 1.1B |
| Net Income | 1.1B | 357M |
| EPS | 4.58 | 2.51 |
| Fiscal Year | 2024 | 2025 |
Income Statement Interpretations
Pilgrim’s Pride Corporation
Pilgrim’s Pride showed a steady revenue increase from 12.1B in 2020 to 17.9B in 2024, with net income rising sharply from 95M to 1.09B. Margins generally improved, notably net margin reaching 6.08% in 2024. The latest year saw slower revenue growth of 3%, but strong gains in gross profit and net income indicate enhanced profitability and operational efficiency.
Lamb Weston Holdings, Inc.
Lamb Weston’s revenue grew from 3.67B in 2021 to 6.45B in 2025, while net income fluctuated, peaking at 1.01B in 2023 before declining to 357M in 2025. Margins remained relatively favorable but deteriorated recently, with net margin falling to 5.54%. The most recent year reflected a slight revenue decline and significant drops in profitability metrics, signaling margin pressures.
Which one has the stronger fundamentals?
Pilgrim’s Pride demonstrates stronger fundamentals with consistent revenue and net income growth, improving margins, and a favorable overall income statement evaluation. Lamb Weston, despite sizeable revenue gains, faces challenges from recent margin contractions and net income declines, resulting in a neutral income statement outlook. Pilgrim’s Pride’s profitability improvements contrast with Lamb Weston’s recent profitability setbacks.
Financial Ratios Comparison
The table below presents a side-by-side comparison of key financial ratios for Pilgrim’s Pride Corporation (PPC) and Lamb Weston Holdings, Inc. (LW) based on their most recent fiscal year data.
| Ratios | Pilgrim’s Pride Corporation (2024) | Lamb Weston Holdings, Inc. (2025) |
|---|---|---|
| ROE | 25.6% | 20.6% |
| ROIC | 14.2% | 7.4% |
| P/E | 9.9 | 22.2 |
| P/B | 2.54 | 4.56 |
| Current Ratio | 2.01 | 1.38 |
| Quick Ratio | 1.31 | 0.68 |
| D/E (Debt to Equity) | 0.82 | 2.39 |
| Debt-to-Assets | 32.5% | 56.2% |
| Interest Coverage | 9.34 | 3.70 |
| Asset Turnover | 1.68 | 0.87 |
| Fixed Asset Turnover | 5.27 | 1.68 |
| Payout Ratio | 0% | 58% |
| Dividend Yield | 0% | 2.61% |
Interpretation of the Ratios
Pilgrim’s Pride Corporation
Pilgrim’s Pride shows mostly favorable ratios, including a strong return on equity (25.63%) and return on invested capital (14.2%), supported by a solid current ratio of 2.01 and high interest coverage of 9.76. The company’s dividend yield is zero, reflecting a reinvestment strategy likely prioritizing growth or operational needs over cash payouts to shareholders.
Lamb Weston Holdings, Inc.
Lamb Weston’s ratios are mixed with a favorable return on equity of 20.56% but neutral to unfavorable leverage metrics, such as a high debt-to-equity ratio of 2.39 and a low quick ratio of 0.68. The company pays dividends with a 2.61% yield, indicating shareholder returns through dividends despite some financial leverage concerns and a slightly unfavorable overall ratio profile.
Which one has the best ratios?
Pilgrim’s Pride holds a more favorable ratio profile overall, with 64.29% favorable metrics and strong liquidity and profitability indicators. Lamb Weston’s higher debt levels and weaker liquidity ratios contribute to a slightly unfavorable evaluation, despite its dividend payments and solid return on equity.
Strategic Positioning
This section compares the strategic positioning of Pilgrim’s Pride Corporation and Lamb Weston Holdings, Inc., covering Market position, Key segments, and Exposure to technological disruption:
Pilgrim’s Pride Corporation
- Large market cap of 9.5B, operates globally with diversified poultry and pork products facing competitive pressure in food sectors.
- Key segments include fresh, frozen chicken and pork products sold to retailers, foodservice, and international markets.
- Exposure to technological disruption not explicitly mentioned, implying stable production and distribution focus.
Lamb Weston Holdings, Inc.
- Market cap of 5.8B, focused on frozen potato products with global and foodservice segments under competitive pressure in packaged foods.
- Key segments are Global, Foodservice, Retail, and Other, driven by frozen potatoes and complementary products distribution worldwide.
- No explicit mention of technological disruption exposure, suggesting traditional manufacturing and distribution operations.
Pilgrim’s Pride Corporation vs Lamb Weston Holdings, Inc. Positioning
Pilgrim’s Pride has a diversified product range across multiple meat categories and international markets, while Lamb Weston concentrates on value-added frozen potato products with defined segments. Diversification offers broader market coverage; concentration may focus operational efficiency.
Which has the best competitive advantage?
Pilgrim’s Pride shows a very favorable MOAT with growing ROIC and strong value creation, indicating a durable competitive advantage. Lamb Weston creates value but faces a declining ROIC trend, reflecting a slightly favorable MOAT and less durable profitability.
Stock Comparison
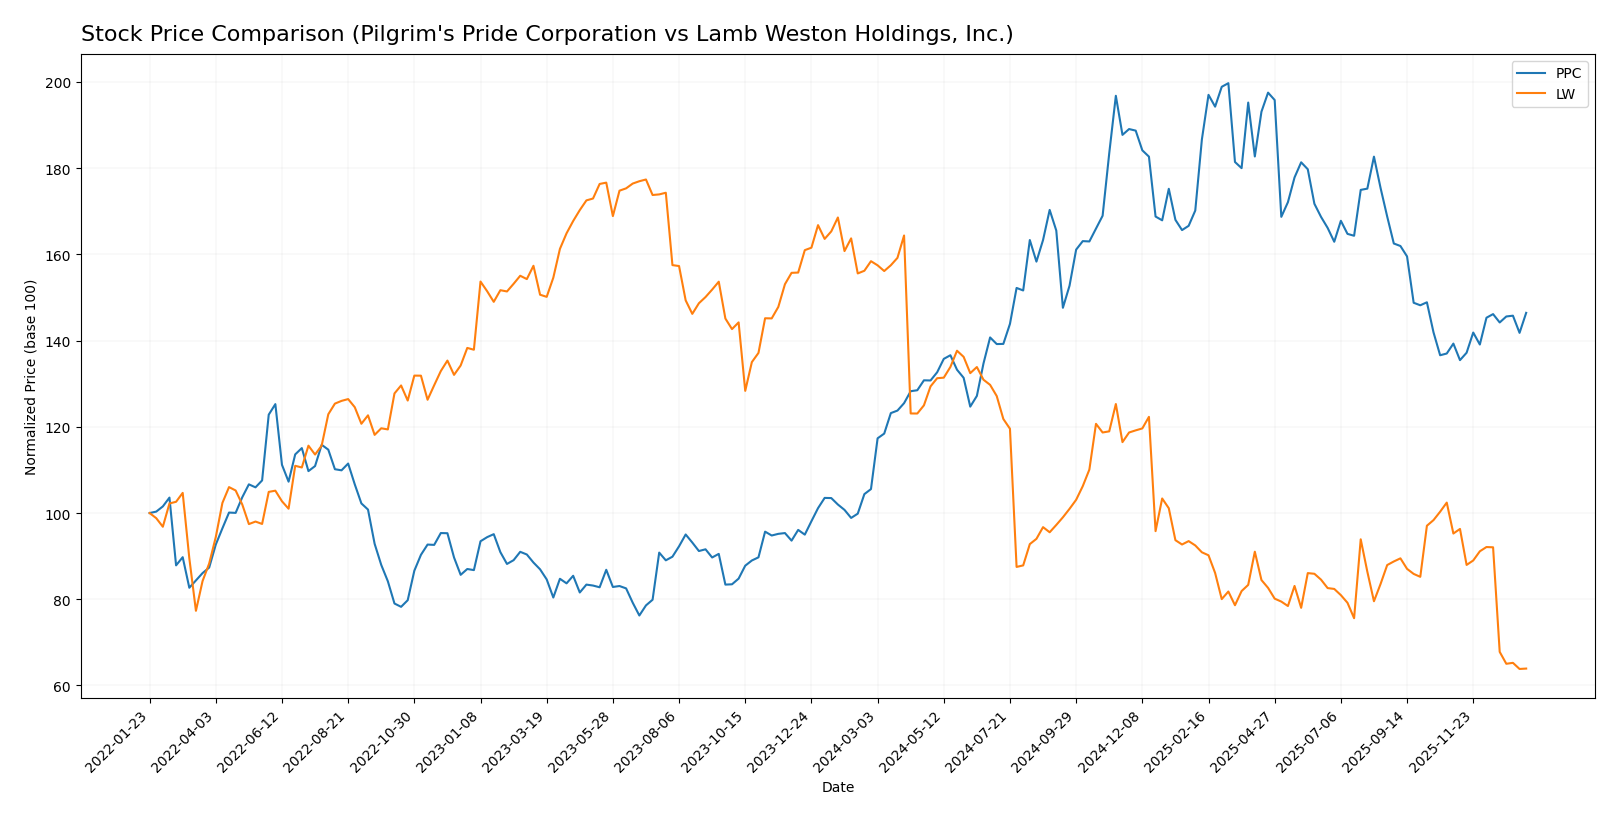
The stock price chart illustrates significant divergence over the past year, with Pilgrim’s Pride Corporation showing a strong upward momentum while Lamb Weston Holdings, Inc. experiences a pronounced decline in trading value.
Trend Analysis
Pilgrim’s Pride Corporation (PPC) exhibited a bullish trend over the past 12 months with a 38.73% price increase and accelerating momentum, peaking at 54.62 and maintaining moderate volatility with a 6.11 standard deviation.
Lamb Weston Holdings, Inc. (LW) experienced a bearish trend during the same period, declining by 59.65% with decelerating losses, hitting a low of 41.37 and showing higher volatility at a 15.2 standard deviation.
Comparing both stocks, PPC delivered the highest market performance with a significant price appreciation, contrasting with LW’s substantial depreciation over the past year.
Target Prices
Analysts present a moderately bullish consensus for Pilgrim’s Pride Corporation and Lamb Weston Holdings, Inc.
| Company | Target High | Target Low | Consensus |
|---|---|---|---|
| Pilgrim’s Pride Corporation | 56 | 45 | 50.5 |
| Lamb Weston Holdings, Inc. | 68 | 46 | 52.67 |
The consensus target prices for both companies exceed their current stock prices, suggesting analysts expect moderate upside potential. Pilgrim’s Pride trades at 40.05 while Lamb Weston is at 41.43, both below their respective target consensuses.
Analyst Opinions Comparison
This section compares analysts’ ratings and financial scores for Pilgrim’s Pride Corporation and Lamb Weston Holdings, Inc.:
Rating Comparison
PPC Rating
- Rating: A+, considered very favorable overall.
- Discounted Cash Flow Score: 4, favorable rating.
- Return on Equity Score: 5, very favorable rating.
- Return on Assets Score: 5, very favorable rating.
- Debt To Equity Score: 4, favorable rating.
LW Rating
- Rating: B, considered very favorable overall.
- Discounted Cash Flow Score: 4, favorable rating.
- Return on Equity Score: 5, very favorable rating.
- Return on Assets Score: 4, favorable rating.
- Debt To Equity Score: 1, very unfavorable rating.
Which one is the best rated?
Pilgrim’s Pride Corporation holds a stronger overall rating (A+) and higher scores in return on assets and debt-to-equity compared to Lamb Weston Holdings, which has a lower overall score and significantly weaker debt-to-equity rating.
Scores Comparison
Here is a comparison of the financial scores for Pilgrim’s Pride Corporation and Lamb Weston Holdings, Inc.:
PPC Scores
- Altman Z-Score: 3.75, in the safe zone, indicating low bankruptcy risk.
- Piotroski Score: 5, indicating average financial strength.
LW Scores
- Altman Z-Score: 2.75, in the grey zone, indicating moderate bankruptcy risk.
- Piotroski Score: 9, indicating very strong financial strength.
Which company has the best scores?
Lamb Weston has a higher Piotroski Score of 9 compared to Pilgrim’s Pride’s 5, indicating stronger financial health. However, Pilgrim’s Pride’s Altman Z-Score of 3.75 is safer than Lamb Weston’s 2.75, which is in the grey zone.
Grades Comparison
Here is a comparison of the recent grades assigned to Pilgrim’s Pride Corporation and Lamb Weston Holdings, Inc.:
Pilgrim’s Pride Corporation Grades
This table summarizes the recent grades and actions from reputable financial institutions for Pilgrim’s Pride Corporation.
| Grading Company | Action | New Grade | Date |
|---|---|---|---|
| Barclays | Maintain | Equal Weight | 2025-12-09 |
| Goldman Sachs | Maintain | Neutral | 2025-10-13 |
| BMO Capital | Maintain | Market Perform | 2025-03-17 |
| Barclays | Maintain | Equal Weight | 2024-11-01 |
| BMO Capital | Maintain | Market Perform | 2024-11-01 |
| Barclays | Maintain | Equal Weight | 2024-09-09 |
| Argus Research | Maintain | Buy | 2024-08-28 |
| B of A Securities | Downgrade | Neutral | 2024-08-15 |
| BMO Capital | Downgrade | Market Perform | 2024-08-12 |
| Barclays | Maintain | Equal Weight | 2024-08-02 |
Pilgrim’s Pride shows a consistent trend toward neutral or hold ratings with occasional downgrades and some buy opinions, reflecting a cautious consensus.
Lamb Weston Holdings, Inc. Grades
Below is a summary of recent grades and recommendations from established grading firms for Lamb Weston Holdings, Inc.
| Grading Company | Action | New Grade | Date |
|---|---|---|---|
| Wells Fargo | Maintain | Overweight | 2025-12-23 |
| Barclays | Maintain | Overweight | 2025-12-23 |
| B of A Securities | Maintain | Neutral | 2025-12-22 |
| Stifel | Maintain | Hold | 2025-12-22 |
| Deutsche Bank | Maintain | Hold | 2025-12-22 |
| Wells Fargo | Maintain | Overweight | 2025-10-01 |
| B of A Securities | Maintain | Neutral | 2025-10-01 |
| Barclays | Maintain | Overweight | 2025-07-25 |
| Wells Fargo | Maintain | Overweight | 2025-07-24 |
| Wells Fargo | Maintain | Overweight | 2025-07-09 |
Lamb Weston consistently receives overweight ratings, indicating positive sentiment and confidence from analysts over the period.
Which company has the best grades?
Lamb Weston Holdings, Inc. has received generally stronger grades, with multiple overweight ratings, compared to Pilgrim’s Pride Corporation’s predominantly neutral and hold ratings. This could suggest that investors might see Lamb Weston as having better growth prospects or relative strength in its sector.
Strengths and Weaknesses
Below is a comparative overview of key strengths and weaknesses for Pilgrim’s Pride Corporation (PPC) and Lamb Weston Holdings, Inc. (LW) based on recent financial and operational data.
| Criterion | Pilgrim’s Pride Corporation (PPC) | Lamb Weston Holdings, Inc. (LW) |
|---|---|---|
| Diversification | Primarily focused on poultry products; limited diversification but strong in its niche. | Diversified revenue streams with Foodservice, Global, and Retail segments totaling over $5B. |
| Profitability | High ROIC (14.2%) and ROE (25.63%), with favorable margins and efficient capital use. | Moderate ROIC (7.43%) and ROE (20.56%), profitability declining but still creating value. |
| Innovation | Moderate innovation focus; stable but less emphasis on product innovation. | Strong innovation in frozen food processing and global supply chain expansion. |
| Global presence | Mainly US-based with some international operations; less global reach. | Significant global footprint with nearly $3B from Global Segment, expanding international markets. |
| Market Share | Leading poultry producer in the US market. | Major player in frozen potato products globally but facing competitive pressures. |
Key takeaway: PPC shows stronger profitability and capital efficiency with a focused market presence, while LW offers greater diversification and global reach but is experiencing a decline in profitability trends. Investors should weigh PPC’s robust financial health against LW’s growth potential and international exposure.
Risk Analysis
Below is a comparative table summarizing key risk metrics for Pilgrim’s Pride Corporation (PPC) and Lamb Weston Holdings, Inc. (LW) as of the most recent fiscal years:
| Metric | Pilgrim’s Pride Corporation (PPC) | Lamb Weston Holdings, Inc. (LW) |
|---|---|---|
| Market Risk | Low beta (0.445) suggests lower volatility | Low beta (0.442) suggests lower volatility |
| Debt level | Moderate debt-to-equity (0.82), debt-to-assets 32.55% | High debt-to-equity (2.39), debt-to-assets 56.21% |
| Regulatory Risk | Moderate; food industry subject to health and safety regulations | Moderate; similar regulatory environment in packaged foods |
| Operational Risk | Large scale operations with 62.6K employees; supply chain complexity | Smaller scale with 10.7K employees; dependency on frozen potato supply chain |
| Environmental Risk | Exposure to livestock farming environmental impacts | Exposure to agricultural production and processing environmental factors |
| Geopolitical Risk | Moderate; exports to multiple regions but US-focused | Moderate; global distribution but US-centric operations |
Synthesis: The most impactful risk for Lamb Weston is its high leverage, with debt-to-equity above 2.3, increasing financial vulnerability especially if market conditions deteriorate. Pilgrim’s Pride shows a safer financial structure with moderate debt and strong interest coverage. Operational complexity and regulatory pressures remain relevant for both but are manageable. Investors should consider LW’s higher financial risk despite its strong Piotroski score, while PPC offers a more balanced risk profile with favorable financial health indicators.
Which Stock to Choose?
Pilgrim’s Pride Corporation (PPC) shows a favorable income evolution with strong growth in net income and EPS over 2020-2024. Its financial ratios are largely favorable, reflecting solid profitability, moderate debt levels, and a very favorable overall rating of A+. The company’s very favorable moat status indicates durable competitive advantage and efficient capital use.
Lamb Weston Holdings, Inc. (LW) displays a neutral income statement evolution marked by recent declines in margin and earnings. Its financial ratios are mixed, with some unfavorable debt metrics and a slightly unfavorable global ratios opinion. LW holds a favorable rating of B, supported by a very strong Piotroski score but shows a slightly favorable moat status with declining profitability.
For investors prioritizing strong profitability and financial stability, PPC’s very favorable rating and durable moat might appear more attractive. Conversely, those focusing on value and potential turnaround scenarios may find LW’s profile, despite recent challenges, to be worth monitoring. The choice could depend on individual risk tolerance and investment strategy.
Disclaimer: Investment carries a risk of loss of initial capital. The past performance is not a reliable indicator of future results. Be sure to understand risks before making an investment decision.
Go Further
I encourage you to read the complete analyses of Pilgrim’s Pride Corporation and Lamb Weston Holdings, Inc. to enhance your investment decisions: