Home > Comparison > Technology > LRCX vs TSEM
The strategic rivalry between Lam Research Corporation and Tower Semiconductor Ltd. defines the current trajectory of the semiconductor industry. Lam Research operates as a capital-intensive equipment manufacturer, focusing on complex wafer fabrication tools. Tower Semiconductor, by contrast, runs a specialized foundry model offering analog and mixed-signal semiconductor manufacturing. This analysis pits scale and technological breadth against niche customization to identify the superior risk-adjusted investment for a diversified portfolio.
Table of contents
Companies Overview
Lam Research Corporation and Tower Semiconductor Ltd. hold pivotal roles in the semiconductor industry, shaping chip manufacturing worldwide.
Lam Research Corporation: Semiconductor Equipment Innovator
Lam Research Corporation dominates as a leading supplier of semiconductor processing equipment. Its core revenue derives from designing and servicing advanced wafer fabrication tools, including plasma etch and deposition systems. In 2026, Lam’s strategic focus centers on expanding its product portfolio to support next-generation chip architectures and enhance manufacturing yield globally.
Tower Semiconductor Ltd.: Specialized Foundry Leader
Tower Semiconductor Ltd. stands out as an independent foundry specializing in analog and mixed-signal devices. It generates revenue by offering customizable wafer fabrication and process technologies to fabless companies and integrated device manufacturers. Tower’s 2026 strategy emphasizes broadening its technology offerings in RF CMOS and MEMS, targeting diverse markets such as automotive and medical devices.
Strategic Collision: Similarities & Divergences
Lam and Tower share a commitment to semiconductor innovation but diverge sharply in business models. Lam operates a capital-intensive equipment ecosystem, while Tower focuses on flexible foundry services. Their primary battleground lies in the semiconductor value chain—equipment versus fabrication. This contrast defines distinct investment profiles: Lam offers exposure to manufacturing technology leadership, Tower to specialized production agility.
Income Statement Comparison
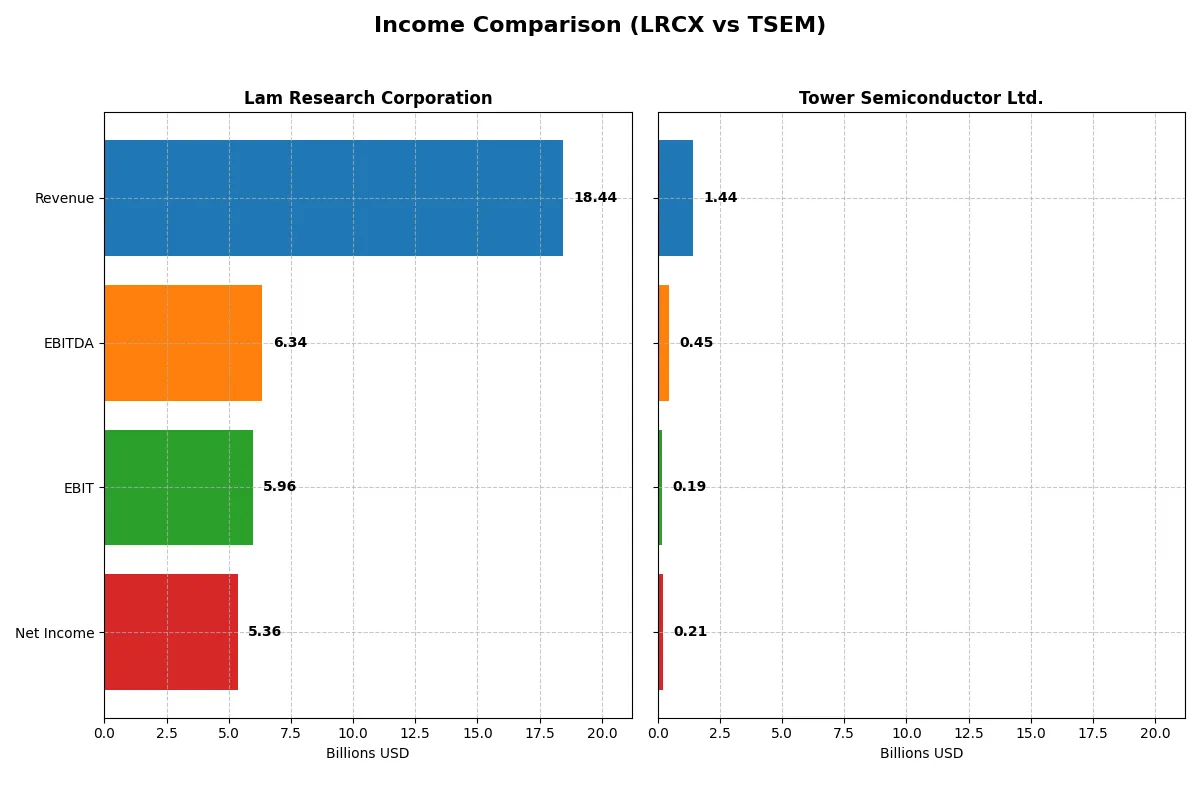
This data dissects the core profitability and scalability of both corporate engines to reveal who dominates the bottom line:
| Metric | Lam Research Corporation (LRCX) | Tower Semiconductor Ltd. (TSEM) |
|---|---|---|
| Revenue | 18.4B | 1.44B |
| Cost of Revenue | 9.46B | 1.10B |
| Operating Expenses | 3.08B | 148M |
| Gross Profit | 8.98B | 339M |
| EBITDA | 6.34B | 451M |
| EBIT | 5.96B | 185M |
| Interest Expense | 178M | 5.86M |
| Net Income | 5.36B | 208M |
| EPS | 4.17 | 1.87 |
| Fiscal Year | 2025 | 2024 |
Income Statement Analysis: The Bottom-Line Duel
This income statement comparison exposes each company’s core efficiency and profit-generation strength over recent years.
Lam Research Corporation Analysis
Lam Research shows a strong upward trend with revenue rising from 14.6B in 2021 to 18.4B in 2025. Net income surged from 3.9B to 5.4B, reflecting robust margin expansion. Its gross margin stands at a healthy 48.7%, while net margin hits 29.1%, signaling excellent cost control and operational efficiency in 2025.
Tower Semiconductor Ltd. Analysis
Tower Semiconductor’s revenue hovered around 1.4B from 2023 to 2024, showing minimal growth. Net income dropped sharply from 518M to 208M, causing net margin to fall to 14.5%. Gross margin at 23.6% and EBIT margin at 12.9% highlight margin pressure and declining operational momentum in the latest fiscal year.
Margin Strength vs. Revenue Momentum
Lam Research dominates with superior margin health and consistent revenue growth, delivering strong profit expansion. Tower Semiconductor suffers from recent margin compression and flat revenue, despite longer-term gains. For investors prioritizing durable profitability, Lam’s profile offers a clearer fundamental advantage.
Financial Ratios Comparison
These vital ratios act as a diagnostic tool to expose the underlying fiscal health, valuation premiums, and capital efficiency of the companies compared below:
| Ratios | Lam Research Corporation (LRCX) | Tower Semiconductor Ltd. (TSEM) |
|---|---|---|
| ROE | 54.33% (2025) | 7.83% (2024) |
| ROIC | 33.99% (2025) | 6.41% (2024) |
| P/E | 23.36 (2025) | 27.54 (2024) |
| P/B | 12.69 (2025) | 2.16 (2024) |
| Current Ratio | 2.21 (2025) | 6.18 (2024) |
| Quick Ratio | 1.55 (2025) | 5.23 (2024) |
| D/E | 0.48 (2025) | 0.07 (2024) |
| Debt-to-Assets | 22.28% (2025) | 5.87% (2024) |
| Interest Coverage | 33.11 (2025) | 32.64 (2024) |
| Asset Turnover | 0.86 (2025) | 0.47 (2024) |
| Fixed Asset Turnover | 7.59 (2025) | 1.11 (2024) |
| Payout ratio | 21.45% (2025) | 0% (2024) |
| Dividend yield | 0.92% (2025) | 0% (2024) |
| Fiscal Year | 2025 | 2024 |
Efficiency & Valuation Duel: The Vital Signs
Financial ratios serve as a company’s DNA, uncovering hidden operational strengths and risks that raw numbers alone cannot reveal.
Lam Research Corporation
Lam Research demonstrates outstanding profitability with a 54.33% ROE and a robust 29.06% net margin, signaling strong operational efficiency. Its P/E of 23.36 remains reasonable relative to its sector, though the price-to-book at 12.69 appears stretched. Despite a low dividend yield of 0.92%, Lam reinvests heavily in R&D, fueling future growth and sustaining shareholder value.
Tower Semiconductor Ltd.
Tower Semiconductor shows a modest 7.83% ROE and a 14.47% net margin, reflecting moderate profitability. The stock trades at a high P/E of 27.54, implying an expensive valuation, while the price-to-book ratio of 2.16 is fair. Tower pays no dividends, instead focusing on reinvesting in operations, although its free cash flow yield is weak, hinting at limited capital return efficiency.
Premium Valuation vs. Operational Safety
Lam Research offers a superior balance of high profitability and efficient capital allocation, justifying its premium valuation despite some stretched book value metrics. Tower Semiconductor’s lower profitability and stretched P/E ratio increase risk without commensurate returns. Investors prioritizing operational strength may prefer Lam, while those seeking growth potential at a discount should scrutinize Tower more closely.
Which one offers the Superior Shareholder Reward?
Lam Research (LRCX) offers a more balanced and sustainable shareholder reward than Tower Semiconductor (TSEM). LRCX pays a modest dividend yield near 0.9% with a conservative payout ratio around 21%, supported by strong free cash flow of 4.2/share. It also executes steady buybacks, enhancing total returns without compromising growth. In contrast, TSEM pays no dividends and reinvests heavily, yet its free cash flow is minimal at 0.11/share, limiting buyback capacity. While TSEM’s reinvestment fuels growth, its elevated price-to-free-cash-flow ratio (457x) signals rich valuation risk. I conclude LRCX delivers superior total return potential in 2026, blending income and capital gains with prudent capital allocation.
Comparative Score Analysis: The Strategic Profile
The radar chart reveals the fundamental DNA and trade-offs of Lam Research Corporation and Tower Semiconductor Ltd., highlighting their core financial strengths and vulnerabilities:
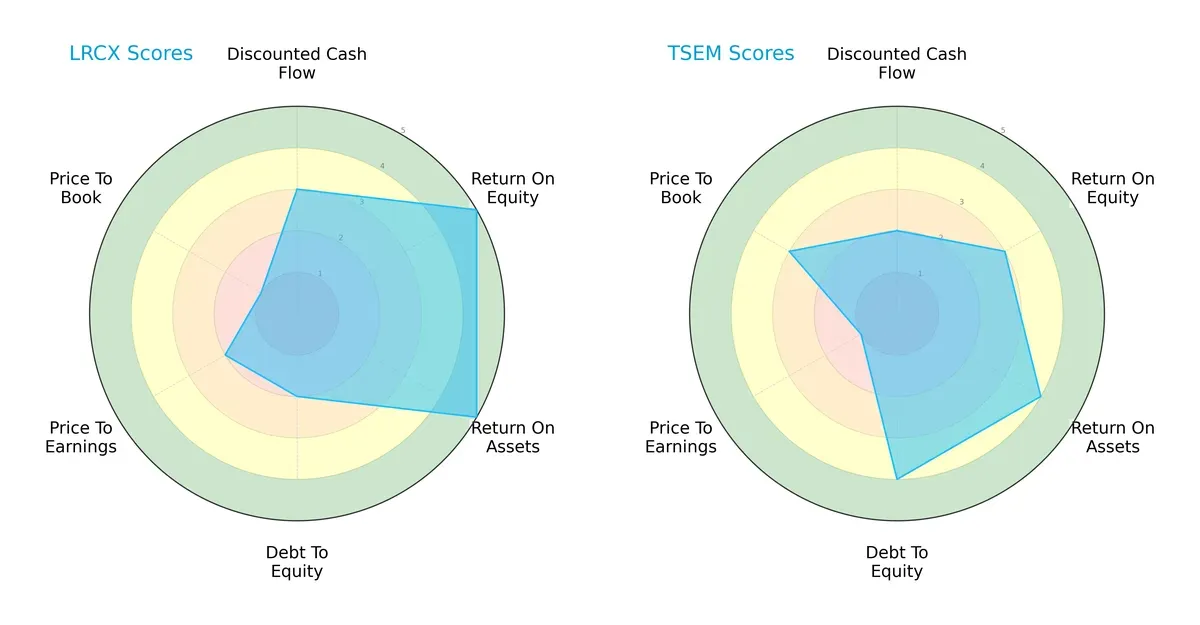
Lam Research leads in profitability metrics with superior ROE (5 vs. 3) and ROA (5 vs. 4) scores, reflecting efficient capital and asset use. Tower Semiconductor shows stronger balance sheet discipline, evident in a lower debt-to-equity score (4 vs. 2). Valuation metrics favor Lam Research’s P/E score slightly, but its P/B ratio scores very poorly compared to Tower. Overall, Lam Research relies on operational efficiency, whereas Tower offers a more balanced financial risk profile.
Bankruptcy Risk: Solvency Showdown
Lam Research and Tower Semiconductor both sit comfortably in the safe zone for Altman Z-Scores (21.18 vs. 22.74), indicating minimal bankruptcy risk through this cycle:
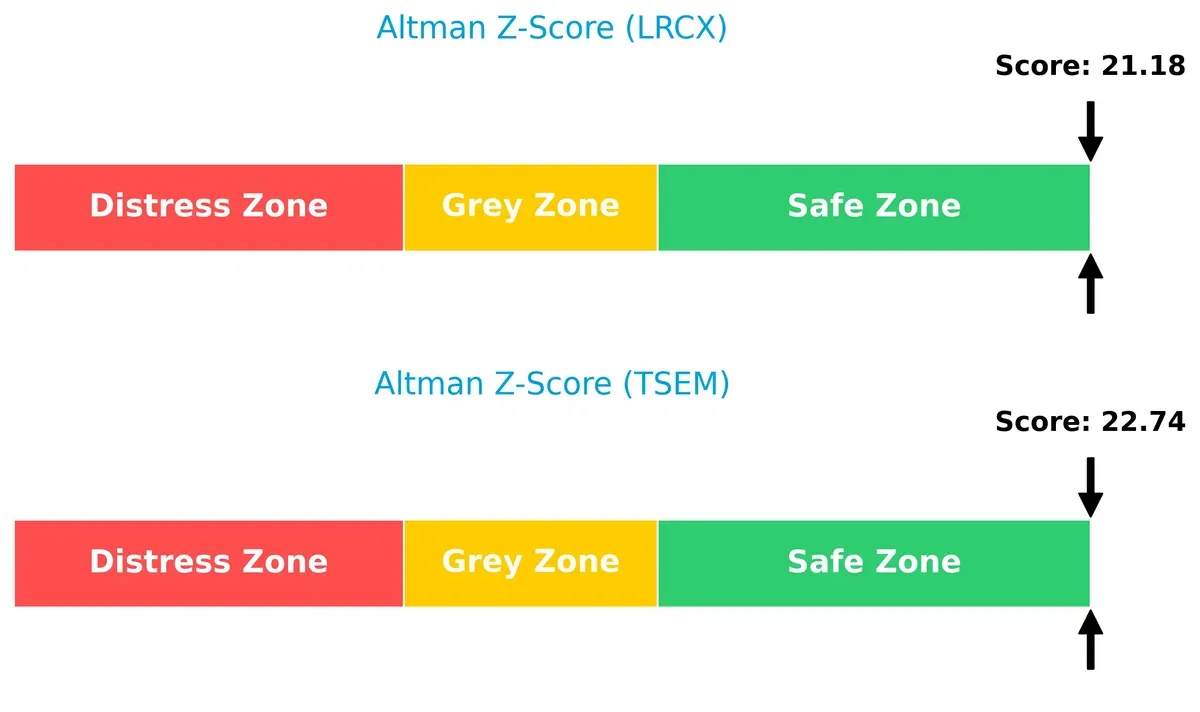
Both companies demonstrate robust solvency, with scores far above the distress threshold of 1.8. This suggests they possess strong financial buffers and ability to meet obligations, a critical advantage during market volatility.
Financial Health: Quality of Operations
Lam Research scores an 8, signaling very strong financial health, slightly outperforming Tower Semiconductor’s 7, which still denotes strong fundamentals:
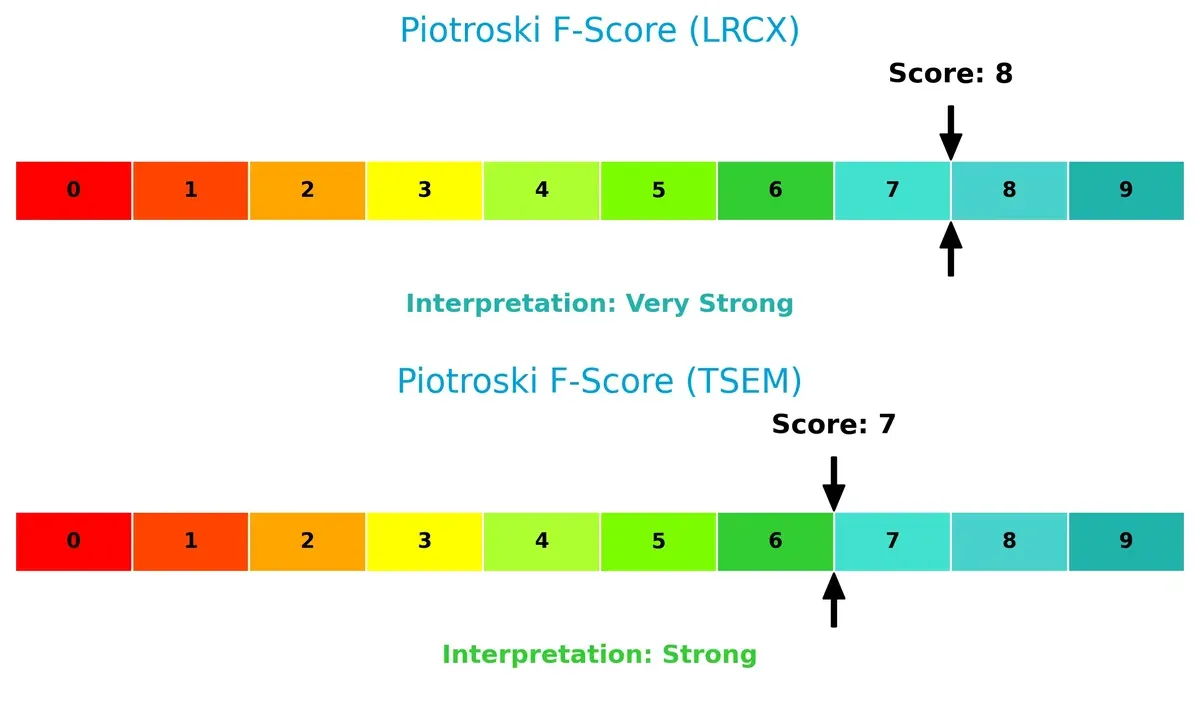
Lam Research’s higher Piotroski score reflects more consistent profitability, liquidity, and operational efficiency. Tower Semiconductor’s score remains solid but hints at minor internal metric weaknesses investors should monitor. Both firms maintain strong operational quality, supporting durable investment cases.
How are the two companies positioned?
This section dissects Lam Research and Tower Semiconductor’s operational DNA by comparing their revenue distribution and internal strengths and weaknesses. The goal is to confront their economic moats to identify which model delivers the most resilient competitive advantage today.
Revenue Segmentation: The Strategic Mix
This visual comparison dissects how Lam Research Corporation and Tower Semiconductor Ltd. diversify their income streams and reveals their primary sector bets:
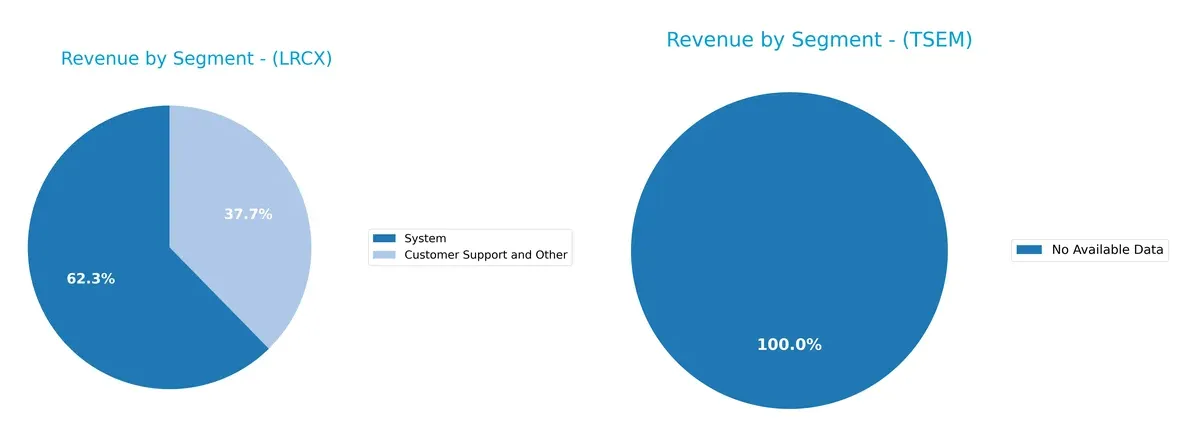
Lam Research anchors its revenue heavily in Systems, with $11.5B in 2025, while Customer Support contributes $6.9B. Tower Semiconductor lacks available segmentation data. Lam’s reliance on Systems signals infrastructure dominance but exposes it to concentration risk. Its support segment provides some diversification, balancing aftermarket stability against cyclical system sales. This mix reflects a strategic ecosystem lock-in, reinforcing its capital-intensive moat in semiconductor equipment.
Strengths and Weaknesses Comparison
This table compares the Strengths and Weaknesses of Lam Research Corporation and Tower Semiconductor Ltd.:
Lam Research Corporation Strengths
- Strong net margin at 29%
- High ROE of 54%
- Robust ROIC at 34%
- Favorable current and quick ratios
- Moderate debt levels with strong interest coverage
- Significant global presence across China, Korea, Taiwan, US
Tower Semiconductor Ltd. Strengths
- Favorable net margin at 14%
- Low debt and strong interest coverage
- Favorable WACC supports capital efficiency
- Solid quick ratio
- Reasonable PB ratio
- Stable dividend yield
Lam Research Corporation Weaknesses
- High WACC at 12%
- Unfavorable PB ratio at 12.69
- Dividend yield below 1%
- Neutral asset turnover
- Moderate market dependence on Asia-Pacific
Tower Semiconductor Ltd. Weaknesses
- Low ROE at 7.8%
- Unfavorable PE at 27.54
- Unfavorable current ratio at 6.18
- Unfavorable asset turnover at 0.47
- No dividend yield
Lam Research shows strong profitability and solid financial health, leveraging global diversification. Tower Semiconductor demonstrates financial prudence but faces challenges in profitability and valuation metrics, impacting its operational efficiency and market positioning.
The Moat Duel: Analyzing Competitive Defensibility
A structural moat is the sole barrier protecting long-term profits from relentless competitive pressures. Let’s dissect the moat dynamics of two semiconductor peers:
Lam Research Corporation: Technological and Scale Moat
Lam Research exploits advanced process technology and scale economies, reflected in a robust 21.9% ROIC above WACC and stable 48.7% gross margins. In 2026, innovations in atomic layer deposition could deepen its edge amid rising wafer complexity.
Tower Semiconductor Ltd.: Niche Process Specialization
Tower leverages niche analog and mixed-signal process expertise, yet shows a negative ROIC spread indicating value erosion. Despite growing profitability, its 23.6% gross margin lags peers. Expansion into emerging markets offers growth but risks margin pressure.
Verdict: Scale and Innovation vs. Niche Focus
Lam’s wider, technology-driven moat outpaces Tower’s specialized but financially weaker position. Lam Research stands better equipped to defend its market share through innovation and scale advantages in 2026.
Which stock offers better returns?
Both Lam Research Corporation (LRCX) and Tower Semiconductor Ltd. (TSEM) have exhibited strong bullish trends over the past year, with significant price appreciation and buyer dominance shaping their trading dynamics.
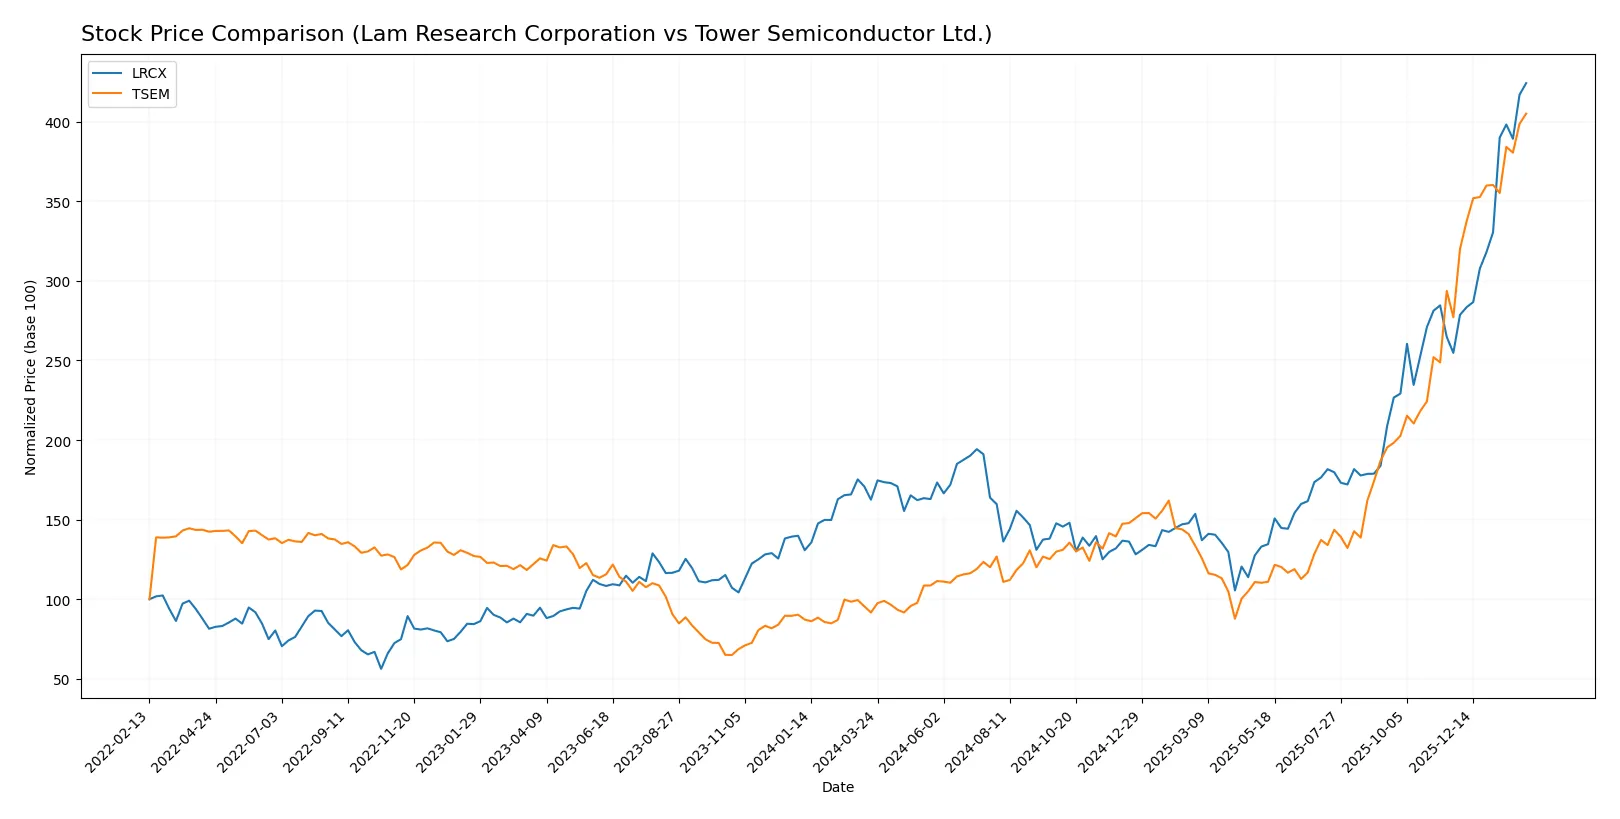
Trend Comparison
Lam Research Corporation (LRCX) posted a 161% price increase over the last 12 months, reflecting a bullish trend with accelerating momentum. The stock reached a high of 237.5 and a low of 59.09, with volatility marked by a 39.19 standard deviation.
Tower Semiconductor Ltd. (TSEM) outperformed with a 342% price gain over the same period, also showing bullish acceleration. Its price fluctuated between 29.65 and 136.89, with lower volatility of 27.35 standard deviation, indicating steadier upward movement.
Comparing the two, TSEM delivered the highest market performance with a 342% gain versus LRCX’s 161%, both supported by strong buyer dominance and increasing volume trends.
Target Prices
Analysts present a mixed target consensus for Lam Research Corporation and Tower Semiconductor Ltd., reflecting varied expectations in the semiconductor sector.
| Company | Target Low | Target High | Consensus |
|---|---|---|---|
| Lam Research Corporation | 127 | 325 | 266.76 |
| Tower Semiconductor Ltd. | 66 | 125 | 96 |
Lam Research’s consensus target of $266.76 sits well above its current $237.5 price, signaling upside potential. Tower Semiconductor’s $96 target lags its current $136.89 price, indicating possible downside or market caution.

Don’t Let Luck Decide Your Entry Point
Optimize your entry points with our advanced ProRealTime indicators. You’ll get efficient buy signals with precise price targets for maximum performance. Start outperforming now!
How do institutions grade them?
Here are the latest institutional grades for Lam Research Corporation and Tower Semiconductor Ltd.:
Lam Research Corporation Grades
The table below shows recent grades assigned to Lam Research Corporation by major institutions.
| Grading Company | Action | New Grade | Date |
|---|---|---|---|
| UBS | Maintain | Buy | 2026-01-29 |
| Wells Fargo | Maintain | Overweight | 2026-01-29 |
| JP Morgan | Maintain | Overweight | 2026-01-29 |
| RBC Capital | Maintain | Outperform | 2026-01-29 |
| Citigroup | Maintain | Buy | 2026-01-29 |
| Stifel | Maintain | Buy | 2026-01-29 |
| Morgan Stanley | Maintain | Equal Weight | 2026-01-29 |
| Needham | Maintain | Buy | 2026-01-29 |
| Susquehanna | Maintain | Positive | 2026-01-29 |
| Goldman Sachs | Maintain | Buy | 2026-01-29 |
Tower Semiconductor Ltd. Grades
Below is the summary of recent grades for Tower Semiconductor Ltd. from key grading firms.
| Grading Company | Action | New Grade | Date |
|---|---|---|---|
| Benchmark | Maintain | Buy | 2026-01-09 |
| Wedbush | Downgrade | Neutral | 2025-12-31 |
| Benchmark | Maintain | Buy | 2025-11-11 |
| Susquehanna | Maintain | Positive | 2025-11-11 |
| Wedbush | Maintain | Outperform | 2025-11-11 |
| Barclays | Maintain | Equal Weight | 2025-11-11 |
| Benchmark | Maintain | Buy | 2025-09-08 |
| Susquehanna | Maintain | Positive | 2025-08-05 |
| Benchmark | Maintain | Buy | 2025-08-05 |
| Benchmark | Maintain | Buy | 2025-08-04 |
Which company has the best grades?
Lam Research consistently earns high marks: multiple Buy, Overweight, and Outperform ratings. Tower Semiconductor shows mixed signals, with some downgrades and Neutral ratings. Lam Research’s stronger consensus may signal greater institutional confidence, potentially influencing investor sentiment more positively.
Risks specific to each company
The following categories identify the critical pressure points and systemic threats facing both firms in the 2026 market environment:
1. Market & Competition
Lam Research Corporation
- Dominates high-end semiconductor equipment with strong product innovation and global reach.
Tower Semiconductor Ltd.
- Faces tough competition in analog and mixed-signal foundry with limited scale and niche focus.
2. Capital Structure & Debt
Lam Research Corporation
- Maintains moderate leverage (D/E 0.48) with strong interest coverage (33.4x), reflecting financial stability.
Tower Semiconductor Ltd.
- Exhibits very low leverage (D/E 0.07) and solid interest coverage (31.6x), showing conservative capital structure.
3. Stock Volatility
Lam Research Corporation
- High beta at 1.78 signals elevated market sensitivity and price swings.
Tower Semiconductor Ltd.
- Lower beta at 0.89 indicates more stable stock price with less volatility.
4. Regulatory & Legal
Lam Research Corporation
- Exposed to US-China trade tensions affecting semiconductor equipment exports.
Tower Semiconductor Ltd.
- Faces complex regulatory landscape in Israel, US, and Asia impacting supply and operations.
5. Supply Chain & Operations
Lam Research Corporation
- Global supply chain complexity increases risk amid geopolitical disruptions and component shortages.
Tower Semiconductor Ltd.
- Smaller scale may limit bargaining power; dependence on specialized materials poses operational risks.
6. ESG & Climate Transition
Lam Research Corporation
- Strong governance and initiatives on energy efficiency in manufacturing but faces industry-wide environmental pressures.
Tower Semiconductor Ltd.
- ESG efforts improving but lag behind larger peers; climate transition costs could pressure margins.
7. Geopolitical Exposure
Lam Research Corporation
- Significant exposure to US-China tensions and export controls on advanced technology.
Tower Semiconductor Ltd.
- Geographically diversified but sensitive to Middle East volatility and US export regulations.
Which company shows a better risk-adjusted profile?
Lam Research faces higher stock volatility and geopolitical risks but benefits from superior profitability, robust capital structure, and strong financial health metrics. Tower Semiconductor has lower market risk and debt but suffers from weaker operational scale, profitability, and regulatory complexity. I judge Lam Research’s risk-adjusted profile as stronger due to its dominant market position and financial resilience despite external pressures. Notably, Lam’s 29% net margin and 34% ROIC far outperform Tower’s 14% margin and 6% ROIC, underscoring Lam’s better capacity to absorb shocks.
Final Verdict: Which stock to choose?
Lam Research Corporation’s superpower lies in its durable competitive advantage, evidenced by consistently high ROIC well above its cost of capital. It efficiently converts invested capital into profits, driving strong growth and solid financial health. A point of vigilance remains its premium valuation, which could pressure returns. It fits best in an aggressive growth portfolio.
Tower Semiconductor offers a strategic moat through its strong balance sheet and cash flow stability, supported by a conservative debt profile and a high current ratio. While its profitability metrics trail Lam Research, it provides a safer harbor for investors wary of volatility. Tower caters well to those seeking GARP—growth at a reasonable price.
If you prioritize robust value creation and market-leading efficiency, Lam Research outshines due to its proven ability to generate excess returns sustainably. However, if you seek better stability with moderate growth, Tower Semiconductor offers a compelling scenario with a solid financial footing and less valuation risk. Each appeals to distinct investor profiles balancing growth and risk tolerance.
Disclaimer: Investment carries a risk of loss of initial capital. The past performance is not a reliable indicator of future results. Be sure to understand risks before making an investment decision.
Go Further
I encourage you to read the complete analyses of Lam Research Corporation and Tower Semiconductor Ltd. to enhance your investment decisions: