Home > Comparison > Technology > LRCX vs TXN
The strategic rivalry between Lam Research Corporation and Texas Instruments Incorporated shapes the semiconductor industry’s evolution. Lam Research excels as a capital-intensive semiconductor equipment manufacturer, while Texas Instruments operates as a diversified analog and embedded processing semiconductor provider. This head-to-head contrasts capital-heavy precision tooling against broad-based semiconductor product innovation. This analysis will clarify which company’s trajectory offers a superior risk-adjusted return for a diversified portfolio focused on technology sector leadership.
Table of contents
Companies Overview
Lam Research Corporation and Texas Instruments Incorporated stand as pillars in the semiconductor industry, shaping technology’s future.
Lam Research Corporation: Semiconductor Equipment Innovator
Lam Research Corporation leads in semiconductor processing equipment, designing and servicing tools critical for integrated circuit fabrication. Its revenue stems from selling advanced etching, deposition, and cleaning systems globally. In 2026, Lam emphasizes innovation in precision manufacturing technologies to sustain its competitive edge and meet evolving chipmakers’ demands.
Texas Instruments Incorporated: Analog and Embedded Powerhouse
Texas Instruments Incorporated dominates in analog and embedded semiconductor solutions, generating revenue through diverse power management and signal processing products. Its strategy in 2026 focuses on expanding microcontroller and digital signal processor offerings across automotive, industrial, and consumer markets to leverage broad end-use applications.
Strategic Collision: Similarities & Divergences
Both companies operate in the semiconductor space but differ fundamentally: Lam invests heavily in fabrication equipment, while Texas Instruments centers on semiconductor components. They battle primarily in technology innovation and customer reach—Lam in wafer processing, Texas Instruments in chip functionality. Their distinct business models offer investors contrasting exposure to semiconductor industry cycles and value drivers.
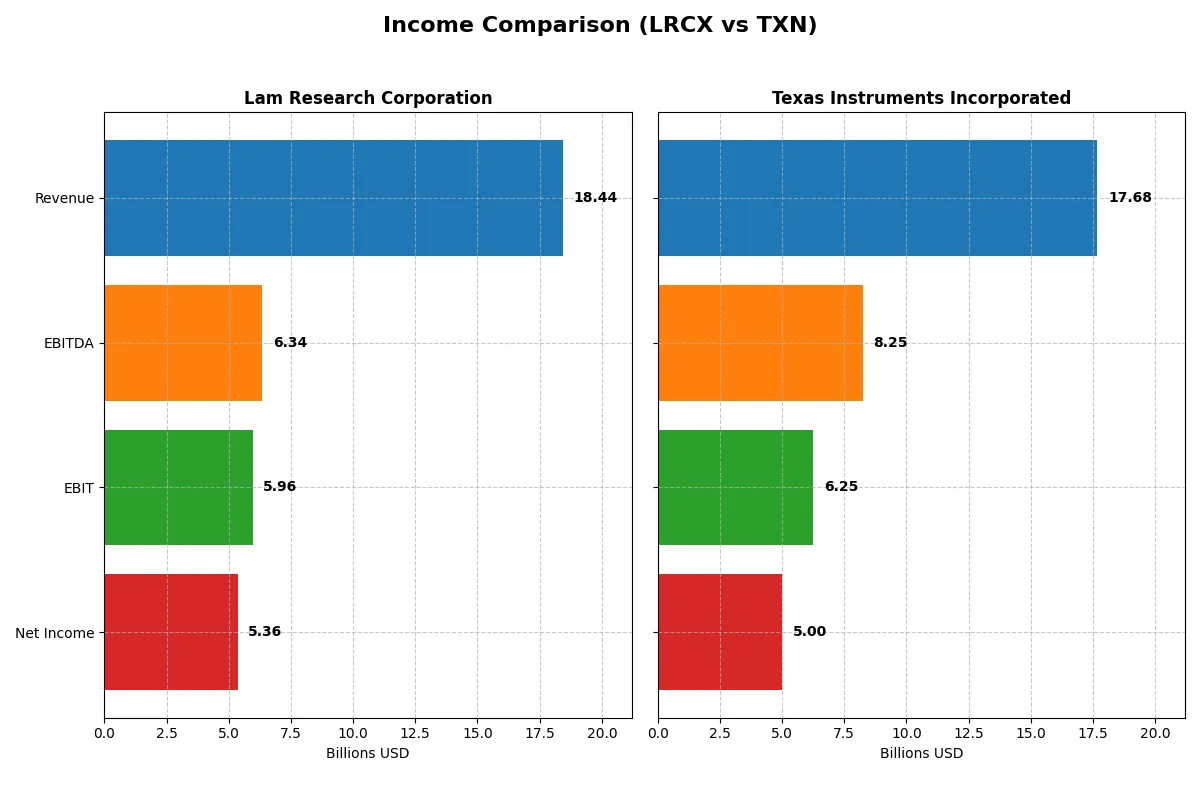
Income Statement Comparison
This data dissects the core profitability and scalability of both corporate engines to reveal who dominates the bottom line:
| Metric | Lam Research Corporation (LRCX) | Texas Instruments Incorporated (TXN) |
|---|---|---|
| Revenue | 18.4B | 17.7B |
| Cost of Revenue | 9.5B | 7.6B |
| Operating Expenses | 3.1B | 4.1B |
| Gross Profit | 9.0B | 10.1B |
| EBITDA | 6.3B | 8.3B |
| EBIT | 6.0B | 6.3B |
| Interest Expense | 178M | 543M |
| Net Income | 5.4B | 5.0B |
| EPS | 4.17 | 5.45 |
| Fiscal Year | 2025 | 2025 |
Income Statement Analysis: The Bottom-Line Duel
This income statement comparison reveals the true efficiency and growth dynamics of two industry leaders over recent years.
Lam Research Corporation Analysis
Lam Research’s revenue surged 23.7% in 2025 to $18.4B, with net income climbing 40% to $5.36B. Its gross margin stands at a robust 48.7%, and net margin improved to 29.1%. The company demonstrates strong momentum, with operating expenses growing proportionally to revenue, reflecting disciplined cost management and expanding profitability.
Texas Instruments Incorporated Analysis
Texas Instruments reported $17.7B revenue in 2025, up 13% year-over-year, with net income at $5B. Gross margin remains high at 57%, but net margin slightly declined to 28.3%. Despite solid revenue growth, net margin contraction and modest EBIT growth indicate some pressure on profitability, contrasting with a longer-term decline in revenue and net income over the past five years.
Margin Expansion vs. Revenue Resilience
Lam Research outpaces Texas Instruments in growth and margin expansion, posting stronger revenue and net income gains with improving efficiency. Texas Instruments exhibits higher gross margins but faces challenges maintaining net margin and earnings growth. Investors seeking accelerating profitability and consistent margin improvement may find Lam Research’s profile more compelling.
Financial Ratios Comparison
These vital ratios act as a diagnostic tool to expose the underlying fiscal health, valuation premiums, and capital efficiency of the companies analyzed:
| Ratios | Lam Research (LRCX) | Texas Instruments (TXN) |
|---|---|---|
| ROE | 54.3% | 30.7% |
| ROIC | 34.0% | 16.5% |
| P/E | 23.4x | 31.5x |
| P/B | 12.7x | 9.7x |
| Current Ratio | 2.21 | 4.35 |
| Quick Ratio | 1.55 | 2.83 |
| D/E | 0.48 | 0.86 |
| Debt-to-Assets | 22.3% | 40.6% |
| Interest Coverage | 33.1x | 11.1x |
| Asset Turnover | 0.86 | 0.51 |
| Fixed Asset Turnover | 7.59 | 1.44 |
| Payout Ratio | 21.5% | 100.0% |
| Dividend Yield | 0.92% | 3.17% |
| Fiscal Year | 2025 | 2025 |
Efficiency & Valuation Duel: The Vital Signs
Financial ratios serve as a company’s DNA, uncovering hidden risks and operational strengths essential for evaluating investment potential.
Lam Research Corporation
Lam Research delivers exceptional profitability with a 54.33% ROE and a strong 29.06% net margin, signaling operational excellence. Its valuation at a 23.36 P/E ratio remains neutral but is supported by a favorable 34% ROIC far above WACC. Dividend yield is low at 0.92%, suggesting reinvestment into growth and R&D.
Texas Instruments Incorporated
Texas Instruments shows solid profitability with a 30.73% ROE and a 28.28% net margin but at a stretched valuation, reflected in a 31.53 P/E ratio. ROIC of 16.52% doubles WACC, yet the debt profile is more leveraged. A 3.17% dividend yield rewards shareholders, highlighting cash return over aggressive reinvestment.
Premium Valuation vs. Operational Safety
Lam Research offers a superior balance of high returns on equity and capital with prudent leverage, despite a modest dividend. Texas Instruments trades at a premium valuation with stronger shareholder payouts but carries higher leverage risk. Investors preferring operational safety and growth may favor Lam, while income-focused profiles might lean toward Texas Instruments.
Which one offers the Superior Shareholder Reward?
I compare Lam Research (LRCX) and Texas Instruments (TXN) on dividends and buybacks. Lam Research yields ~0.9%, with a sustainable payout ratio near 21%, supported by strong free cash flow (4.2/share). Its buybacks are moderate but consistent. Texas Instruments offers a much higher dividend yield around 3.2%, but with a payout ratio near 100%, raising sustainability concerns given its lower free cash flow coverage (0.36). However, TXN maintains aggressive buybacks contributing significantly to total return. Lam’s model balances cash return with reinvestment prudently, while TXN prioritizes immediate yield at possible long-term risk. For 2026, I favor Lam Research for more sustainable, superior total shareholder reward.
Comparative Score Analysis: The Strategic Profile
The radar chart reveals the fundamental DNA and trade-offs of Lam Research Corporation and Texas Instruments Incorporated, highlighting their financial strengths and weaknesses:
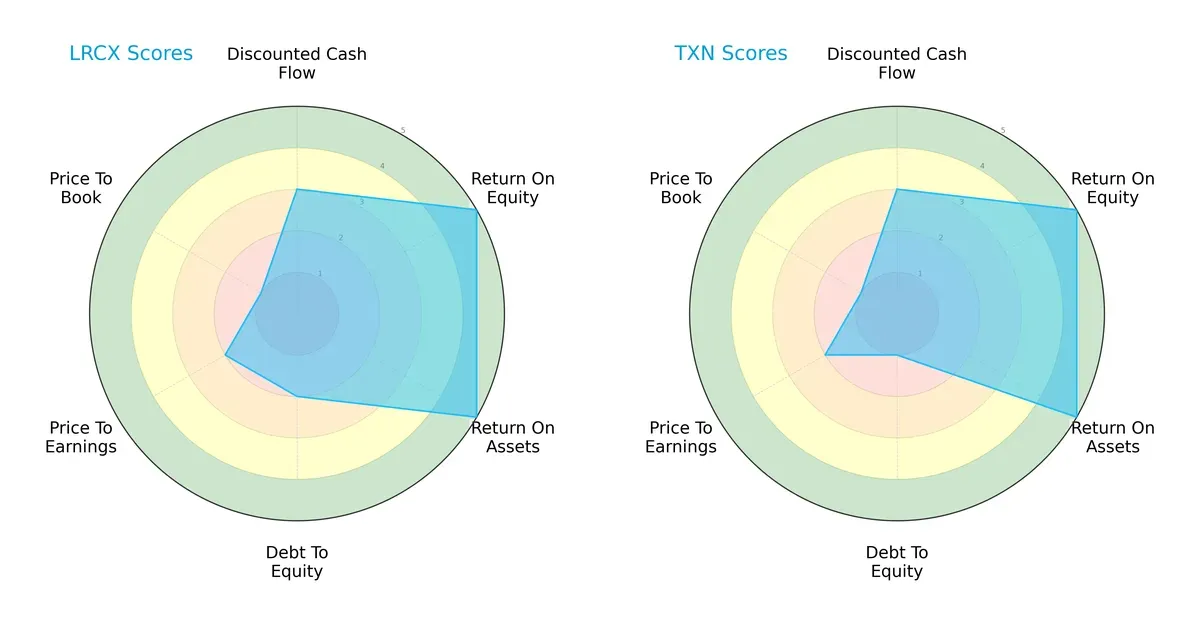
Both companies deliver strong profitability, reflected in top ROE and ROA scores of 5. Lam Research shows a more balanced credit profile with a moderate debt-to-equity score of 2, compared to Texas Instruments’ weaker 1, signaling higher leverage risk. Valuation metrics (P/E and P/B) are similarly moderate to unfavorable for both, indicating neither stock is deeply undervalued. Overall, Lam Research’s profile is more balanced, while Texas Instruments leans on operational efficiency but carries higher financial risk.
Bankruptcy Risk: Solvency Showdown
Lam Research’s Altman Z-Score of 21.2 vastly outperforms Texas Instruments’ 9.4, both residing safely above the distress threshold but diverging in margin of safety:
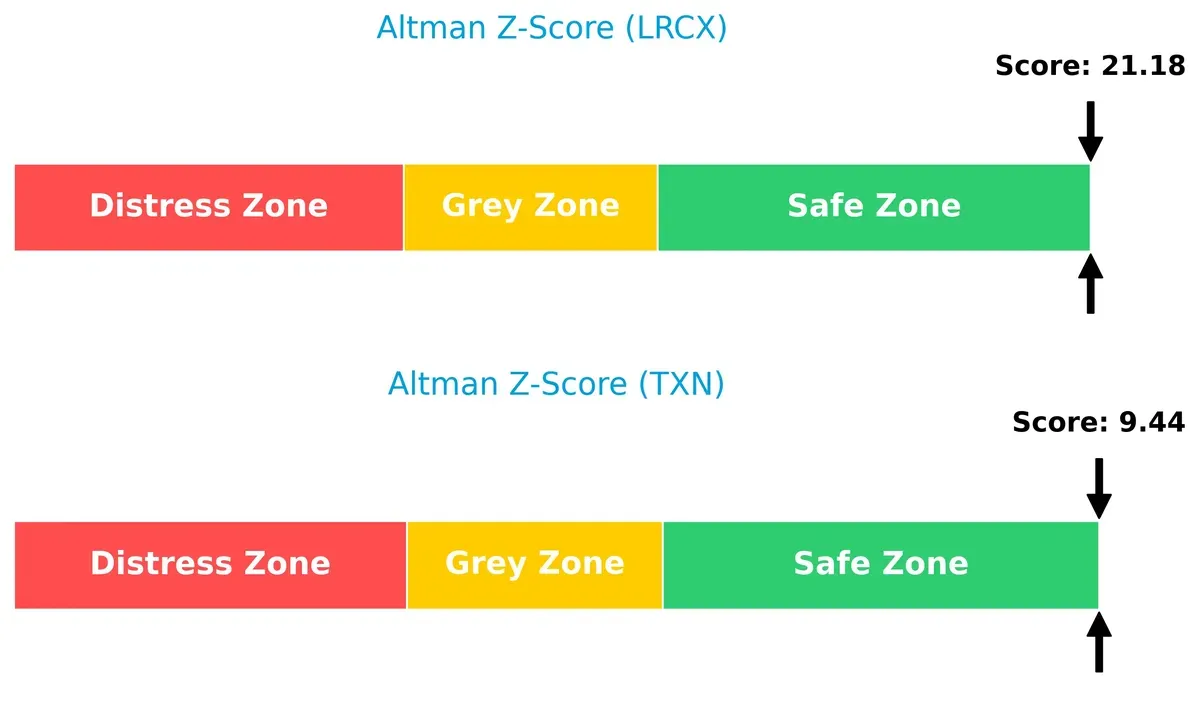
This wide gap indicates Lam Research’s far stronger solvency and lower bankruptcy risk in the current cycle. Texas Instruments remains safe, but its lower score suggests more vulnerability to economic shocks.
Financial Health: Quality of Operations
Lam Research scores an 8 on the Piotroski F-Score, outperforming Texas Instruments’ 7, indicating superior internal financial health and operational quality:
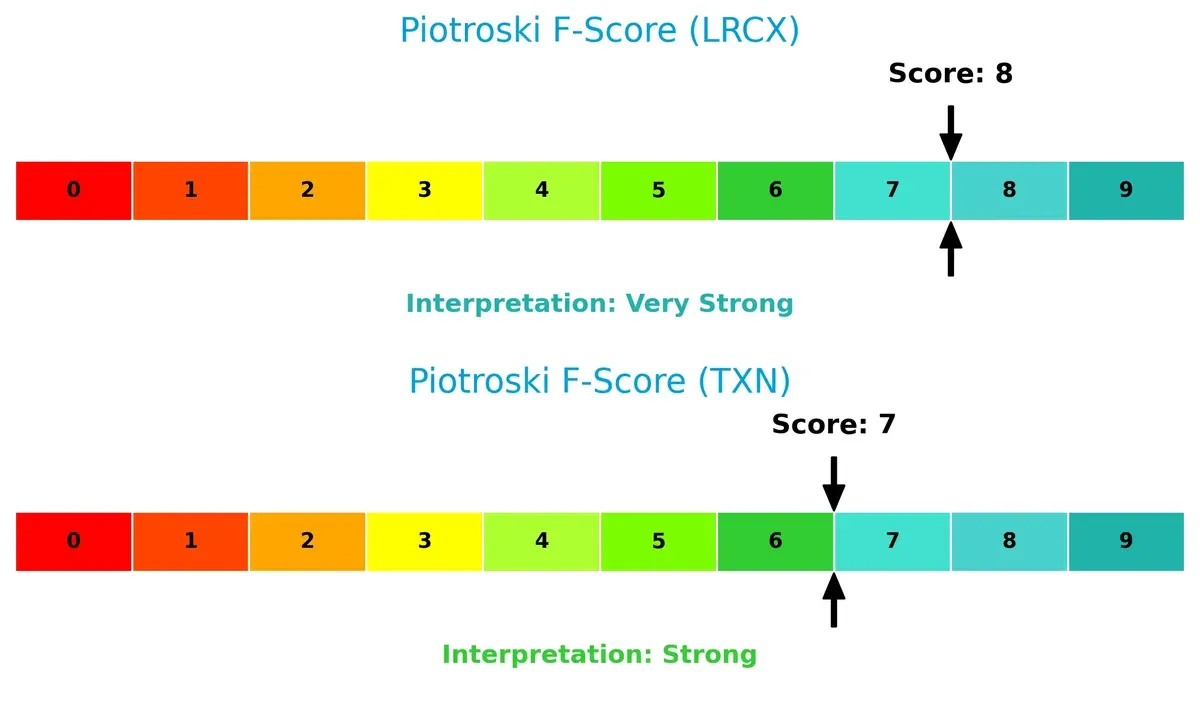
Both firms show strong financial management, but Lam Research’s higher score signals fewer red flags in profitability, leverage, and liquidity metrics. Texas Instruments is solid but slightly less robust in internal fundamentals.
How are the two companies positioned?
This section dissects the operational DNA of Lam Research and Texas Instruments by comparing their revenue distribution and internal dynamics. The goal is to confront their economic moats to reveal which model holds the most resilient and sustainable advantage today.
Revenue Segmentation: The Strategic Mix
This visual comparison dissects how Lam Research Corporation and Texas Instruments Incorporated diversify their income streams and where their primary sector bets lie:
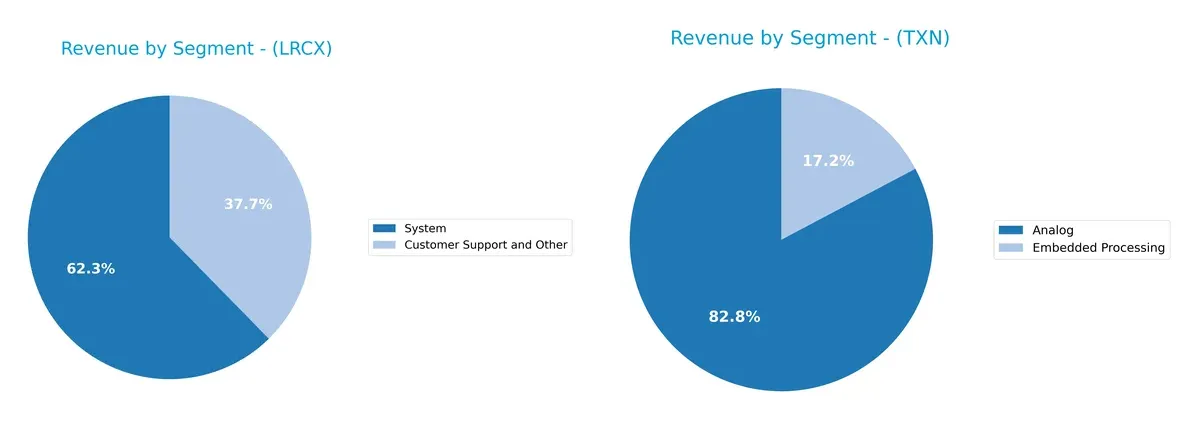
Lam Research pivots primarily on two segments: Systems at $11.5B and Customer Support at $6.9B in 2025. Texas Instruments dwarfs with a dominant Analog segment hitting $12.2B and Embedded Processing at $2.5B in 2024. TI’s broader spread into “All Other Segments” adds diversification, while Lam Research’s reliance on Systems highlights infrastructure dominance but exposes concentration risk. TI benefits from a more balanced ecosystem lock-in.
Strengths and Weaknesses Comparison
This table compares the Strengths and Weaknesses of Lam Research Corporation and Texas Instruments Incorporated:
Lam Research Corporation Strengths
- High profitability with 29.06% net margin
- Exceptional ROE at 54.33%
- Strong ROIC at 34.0% exceeding WACC
- Solid liquidity ratios and low leverage
- Diversified revenue between System and Customer Support
- Significant presence in Asian markets, especially China and Korea
Texas Instruments Incorporated Strengths
- Strong net margin at 28.28%
- Good ROE and solid ROIC
- High dividend yield of 3.17% appeals to income investors
- Balanced revenue segmentation including Analog and Embedded Processing
- Large global footprint with strong U.S. and Asia sales
- Favorable interest coverage ratio supports debt servicing
Lam Research Corporation Weaknesses
- WACC of 12.09% outpaces ROIC, indicating higher capital costs
- High price-to-book ratio at 12.69 suggests overvaluation
- Relatively low dividend yield at 0.92%
- Neutral to unfavorable asset turnover metrics limit efficiency signals
Texas Instruments Incorporated Weaknesses
- Unfavorable price-to-earnings and price-to-book ratios
- Unfavorable current ratio at 4.35, signaling possible inefficiency in working capital
- Higher debt-to-assets ratio at 40.62% raises leverage concerns
- Lower fixed asset turnover suggests less efficient asset use
Lam Research demonstrates strong profitability and capital efficiency but faces valuation pressure and capital cost challenges. Texas Instruments offers a solid dividend and broad diversification but contends with valuation and leverage risks. Each company’s financial traits imply distinct strategic priorities in managing growth, capital allocation, and market positioning.
The Moat Duel: Analyzing Competitive Defensibility
A structural moat safeguards long-term profits from competitive erosion. Without it, gains vanish swiftly under market pressure:
Lam Research Corporation: Precision Engineering Moat
Lam Research’s moat stems from specialized equipment complexity and high switching costs. Its ROIC exceeds WACC by 21.9%, showing strong value creation and margin stability. New etch and deposition innovations in 2026 could widen this technological lead.
Texas Instruments Incorporated: Cost Leadership and Scale Moat
Texas Instruments leverages cost advantages and a vast analog product portfolio, contrasting Lam’s niche tech. It creates value with an 8.3% ROIC premium over WACC but faces a declining ROIC trend. Expansion in embedded processing offers moderate growth potential.
Moat Battle: Specialized Precision vs. Scale Efficiency
Lam Research holds a deeper, more durable moat with growing ROIC and expanding technological barriers. Texas Instruments creates value but risks margin pressure from slowing profitability. Lam is better positioned to defend and grow its market share.
Which stock offers better returns?
Over the past 12 months, Lam Research and Texas Instruments showed strong price appreciation with notable acceleration in their upward trends and increasing buyer dominance in trading volumes.
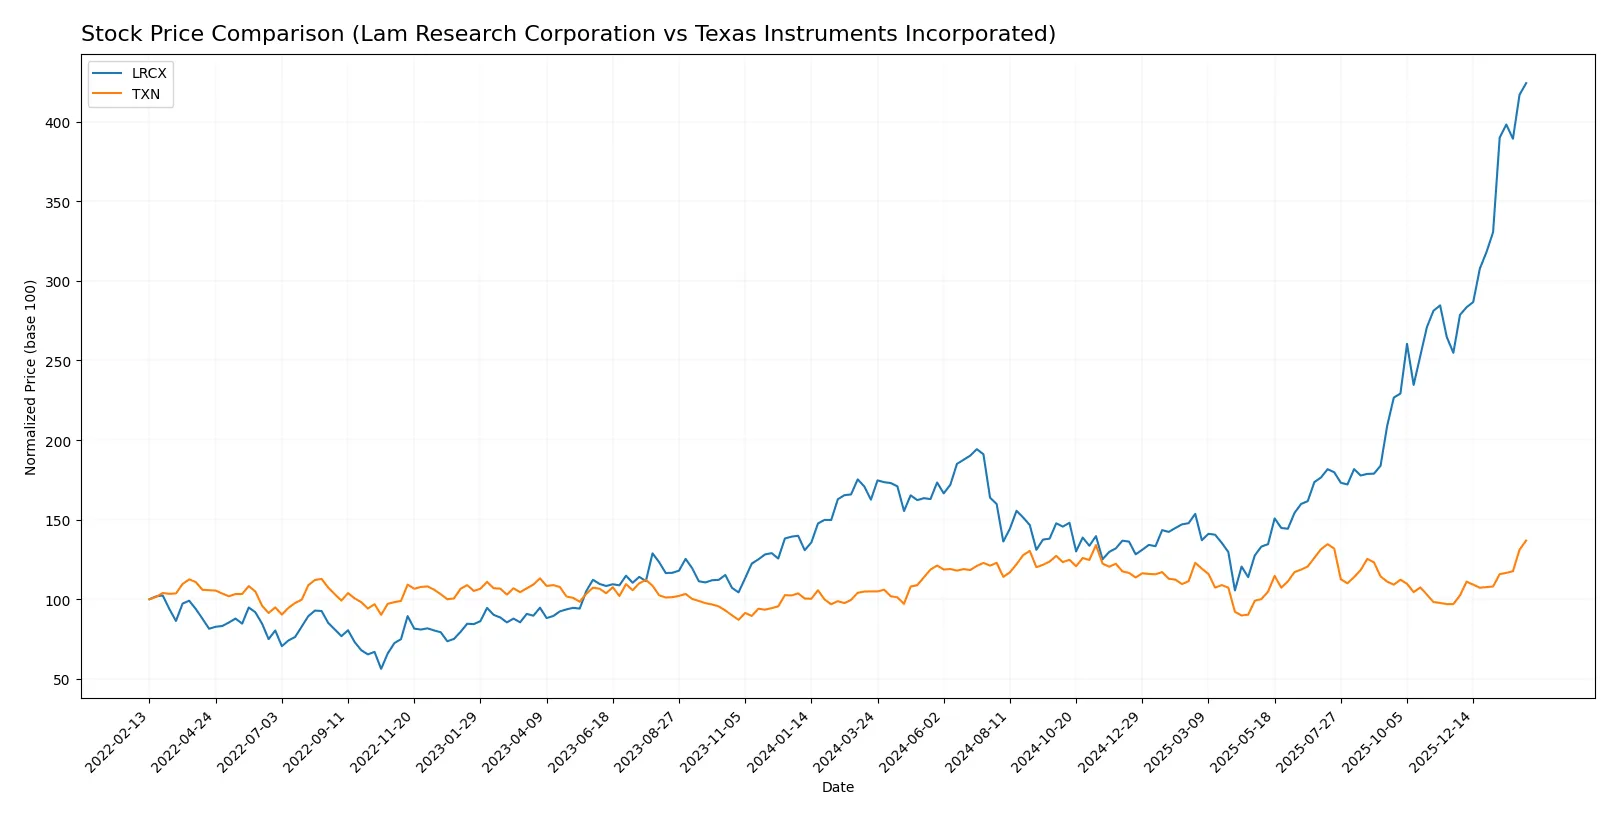
Trend Comparison
Lam Research’s stock rose 161% over the past year, marking a bullish trend with accelerating momentum and high volatility, reaching a peak of 237.5 and a low near 59.1.
Texas Instruments gained 30.4% in the same period, also bullish with accelerating growth but lower volatility, hitting a high of 225.0 and a low of 147.6.
Lam Research delivered substantially higher market returns compared to Texas Instruments, demonstrating stronger price appreciation and greater momentum.
Target Prices
Analysts present a balanced target consensus for these semiconductor leaders, reflecting cautious optimism amid sector volatility.
| Company | Target Low | Target High | Consensus |
|---|---|---|---|
| Lam Research Corporation | 127 | 325 | 266.76 |
| Texas Instruments Incorporated | 160 | 260 | 204.64 |
Lam Research’s consensus target of 267 suggests upside from its current 238 price, indicating potential growth. Texas Instruments’ 205 target is modestly below its 225 price, signaling more cautious expectations.

Don’t Let Luck Decide Your Entry Point
Optimize your entry points with our advanced ProRealTime indicators. You’ll get efficient buy signals with precise price targets for maximum performance. Start outperforming now!
How do institutions grade them?
Lam Research Corporation Grades
Here are the latest institutional grades for Lam Research Corporation:
| Grading Company | Action | New Grade | Date |
|---|---|---|---|
| UBS | Maintain | Buy | 2026-01-29 |
| Wells Fargo | Maintain | Overweight | 2026-01-29 |
| JP Morgan | Maintain | Overweight | 2026-01-29 |
| RBC Capital | Maintain | Outperform | 2026-01-29 |
| Citigroup | Maintain | Buy | 2026-01-29 |
| Stifel | Maintain | Buy | 2026-01-29 |
| Morgan Stanley | Maintain | Equal Weight | 2026-01-29 |
| Needham | Maintain | Buy | 2026-01-29 |
| Susquehanna | Maintain | Positive | 2026-01-29 |
| Goldman Sachs | Maintain | Buy | 2026-01-29 |
Texas Instruments Incorporated Grades
Here are the latest institutional grades for Texas Instruments Incorporated:
| Grading Company | Action | New Grade | Date |
|---|---|---|---|
| Keybanc | Maintain | Overweight | 2026-01-28 |
| Deutsche Bank | Maintain | Hold | 2026-01-28 |
| Truist Securities | Maintain | Hold | 2026-01-28 |
| Cantor Fitzgerald | Maintain | Neutral | 2026-01-28 |
| Mizuho | Maintain | Underperform | 2026-01-28 |
| Stifel | Maintain | Hold | 2026-01-28 |
| UBS | Maintain | Buy | 2026-01-28 |
| Goldman Sachs | Maintain | Sell | 2026-01-28 |
| JP Morgan | Maintain | Overweight | 2026-01-28 |
| Jefferies | Maintain | Hold | 2026-01-28 |
Which company has the best grades?
Lam Research consistently earns positive ratings, with most firms issuing Buy or Outperform grades. Texas Instruments shows more mixed reviews, including Hold and Underperform marks. This suggests Lam Research enjoys broader institutional confidence, potentially impacting investor sentiment positively.
Risks specific to each company
The following categories identify the critical pressure points and systemic threats facing both firms in the 2026 market environment:
1. Market & Competition
Lam Research Corporation
- Operates in highly cyclical semiconductor equipment sector with strong global competitors; market sensitivity to chip cycle fluctuations.
Texas Instruments Incorporated
- Competes in diverse semiconductor markets, including analog and embedded processing; faces pressure from global chipmakers and pricing dynamics.
2. Capital Structure & Debt
Lam Research Corporation
- Maintains moderate leverage with debt-to-equity at 0.48 and strong interest coverage of 33.4; financially conservative stance.
Texas Instruments Incorporated
- Higher leverage at 0.86 debt-to-equity; interest coverage at 11.5 remains adequate but signals more financial risk than LRCX.
3. Stock Volatility
Lam Research Corporation
- Exhibits high beta of 1.78, indicating significant price volatility and sensitivity to market swings.
Texas Instruments Incorporated
- Beta near 1.0, reflecting market-average volatility and more stable stock price behavior.
4. Regulatory & Legal
Lam Research Corporation
- Exposed to semiconductor export controls and technology transfer restrictions, especially with China tensions.
Texas Instruments Incorporated
- Faces similar regulatory risks, but broader product diversification may mitigate impact.
5. Supply Chain & Operations
Lam Research Corporation
- Relies on advanced manufacturing supply chains vulnerable to geopolitical disruptions and component shortages.
Texas Instruments Incorporated
- Larger scale and vertical integration in manufacturing somewhat reduce supply chain risks.
6. ESG & Climate Transition
Lam Research Corporation
- Increasing pressure to improve energy efficiency and reduce environmental footprint in high-energy semiconductor equipment manufacturing.
Texas Instruments Incorporated
- Actively advancing ESG initiatives; benefits from stable power management product lines aligned with green tech trends.
7. Geopolitical Exposure
Lam Research Corporation
- Significant exposure to Asia-Pacific markets, particularly China, posing risks amid ongoing US-China tech tensions.
Texas Instruments Incorporated
- Also exposed to geopolitical risks but diversified customer base across multiple regions softens impact.
Which company shows a better risk-adjusted profile?
Lam Research’s primary risk is its high stock volatility and geopolitical exposure in a cyclical industry. Texas Instruments faces elevated leverage and regulatory risks but benefits from diversified operations and more stable stock behavior. TI’s stronger dividend yield and solid ESG positioning offer defensive qualities. I see TI as having a slightly better risk-adjusted profile given its balanced capital structure and reduced market sensitivity despite some financial leverage concerns.
Final Verdict: Which stock to choose?
Lam Research Corporation’s superpower lies in its robust value creation. Its consistently growing return on invested capital significantly outpaces its cost of capital, signaling a durable competitive advantage. A point of vigilance remains its relatively high price-to-book ratio, which might temper valuation appeal. It suits aggressive growth portfolios seeking strong profitability momentum.
Texas Instruments Incorporated boasts a strategic moat anchored in steady cash flow and a resilient dividend yield, appealing to income-focused investors. While its profitability metrics trail Lam Research, its balance sheet strength and lower volatility offer better safety for conservative portfolios. It fits well within a GARP (Growth at a Reasonable Price) strategy.
If you prioritize dynamic growth with a focus on capital efficiency, Lam Research outshines Texas Instruments due to its superior ROIC trend and income statement vigor. However, if you seek stability combined with income and a safer balance sheet, Texas Instruments offers better stability and a more defensive profile despite slower growth. Both represent analytical scenarios for different investor appetites.
Disclaimer: Investment carries a risk of loss of initial capital. The past performance is not a reliable indicator of future results. Be sure to understand risks before making an investment decision.
Go Further
I encourage you to read the complete analyses of Lam Research Corporation and Texas Instruments Incorporated to enhance your investment decisions: