Home > Comparison > Technology > LRCX vs TER
The strategic rivalry between Lam Research Corporation and Teradyne, Inc. shapes the semiconductor technology landscape. Lam Research operates as a capital-intensive manufacturer of semiconductor processing equipment, while Teradyne excels as a diversified test equipment and automation provider. This head-to-head encapsulates a battle between manufacturing scale and technological breadth. This analysis aims to identify which company’s strategy delivers superior risk-adjusted returns for a well-diversified portfolio in today’s volatile market.
Table of contents
Companies Overview
Lam Research Corporation and Teradyne, Inc. stand as pivotal players in the semiconductor equipment industry, shaping chip production and testing.
Lam Research Corporation: Semiconductor Fabrication Equipment Leader
Lam Research Corporation dominates the semiconductor equipment market by designing and servicing wafer fabrication tools. Its core revenue stems from advanced etch, deposition, and cleaning systems critical to integrated circuit manufacturing. In 2026, Lam focuses strategically on enhancing precision and efficiency in wafer processing to meet rising semiconductor complexity demands. This market position underscores its role in enabling next-generation chip technologies.
Teradyne, Inc.: Automated Test and Industrial Robotics Innovator
Teradyne, Inc. leads in automatic test equipment and industrial automation. It generates revenue through semiconductor device testing, system test solutions, and collaborative robotics. In 2026, Teradyne emphasizes expanding its wireless test segment and industrial automation, reflecting a shift towards smart manufacturing and IoT device validation. Its competitive advantage lies in integrating test and automation to support diverse high-tech markets.
Strategic Collision: Similarities & Divergences
Both firms operate at the semiconductor industry’s core, but Lam Research focuses on fabrication process machinery while Teradyne specializes in testing and automation systems. They compete indirectly by enabling different production stages. The primary battleground is semiconductor manufacturing efficiency and quality assurance. Investors face distinct profiles: Lam offers exposure to capital-intensive equipment innovation, while Teradyne provides growth via diversified automation and testing technologies.
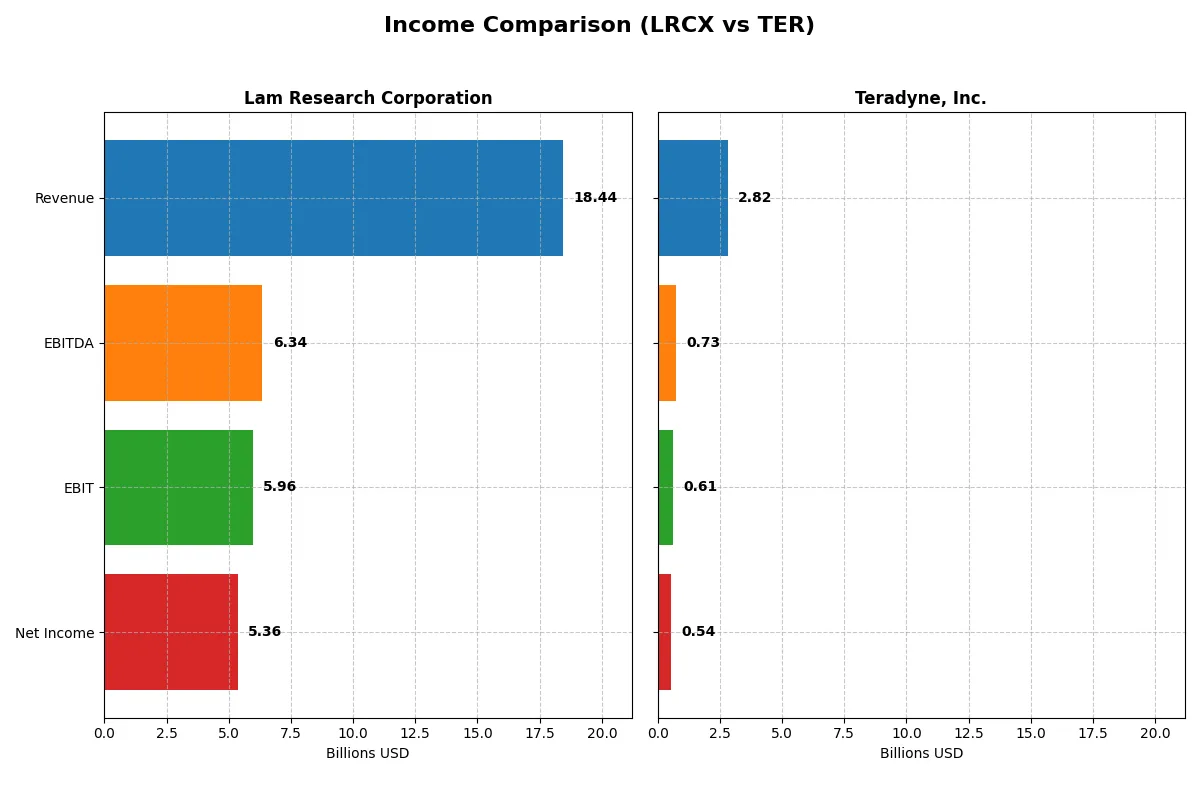
Income Statement Comparison
This data dissects the core profitability and scalability of both corporate engines to reveal who dominates the bottom line:
| Metric | Lam Research Corporation (LRCX) | Teradyne, Inc. (TER) |
|---|---|---|
| Revenue | 18.4B | 2.82B |
| Cost of Revenue | 9.46B | 1.17B |
| Operating Expenses | 3.08B | 1.06B |
| Gross Profit | 8.98B | 1.65B |
| EBITDA | 6.34B | 732M |
| EBIT | 5.96B | 613M |
| Interest Expense | 178M | 3.59M |
| Net Income | 5.36B | 542M |
| EPS | 4.17 | 3.41 |
| Fiscal Year | 2025 | 2024 |
Income Statement Analysis: The Bottom-Line Duel
This income statement comparison reveals which company harnesses its revenue into efficient profit generation and sustainable margin strength.
Lam Research Corporation Analysis
Lam Research shows a strong upward trajectory in revenue, rising from $14.6B in 2021 to $18.4B in 2025. Net income followed suit, increasing from $3.9B to $5.4B. Gross and net margins remain robust at 48.7% and 29.1%, respectively, reflecting efficient cost control. The 2025 results demonstrate accelerating momentum with a 24% revenue and 13% net margin expansion year-over-year.
Teradyne, Inc. Analysis
Teradyne’s revenue declined over five years, from $3.7B in 2021 to $2.8B in 2024, with net income falling from $1.0B to $542M. Despite a higher gross margin of 58.5%, net margin stands at a more modest 19.2%. The latest year shows modest growth of 5.4% in revenue and a 15% rise in EBIT, signaling operational improvement but a longer-term erosion in scale and profitability.
Margin Strength vs. Revenue Growth Leadership
Lam Research clearly leads in both scale and profitability growth, demonstrating superior margin health and rapid earnings expansion. Teradyne offers stronger gross margins but struggles with declining revenue and net income over the period. Investors seeking growth and margin resilience will find Lam’s profile more compelling given its accelerating profit conversion and expanding market footprint.
Financial Ratios Comparison
These vital ratios act as a diagnostic tool to expose the underlying fiscal health, valuation premiums, and capital efficiency of the companies analyzed:
| Ratios | Lam Research (LRCX) | Teradyne (TER) |
|---|---|---|
| ROE | 54.3% | 19.2% |
| ROIC | 34.0% | 17.2% |
| P/E | 23.4 | 36.9 |
| P/B | 12.7 | 7.1 |
| Current Ratio | 2.21 | 2.91 |
| Quick Ratio | 1.55 | 1.84 |
| D/E | 0.48 | 0.03 |
| Debt-to-Assets | 22.3% | 2.1% |
| Interest Coverage | 33.1 | 165.5 |
| Asset Turnover | 0.86 | 0.76 |
| Fixed Asset Turnover | 7.59 | 4.88 |
| Payout Ratio | 21.5% | 14.1% |
| Dividend Yield | 0.92% | 0.38% |
| Fiscal Year | 2025 | 2024 |
Efficiency & Valuation Duel: The Vital Signs
Financial ratios act as a company’s DNA, uncovering hidden risks and operational strengths critical for investment decisions.
Lam Research Corporation
Lam Research posts an impressive 54.3% ROE and 29.1% net margin, signaling strong profitability. Its P/E ratio of 23.4 appears fairly valued but with a high 12.7 PB, the stock shows some price premium. The firm returns value through modest 0.9% dividends, balancing shareholder payouts with solid reinvestment in R&D at 11.4% of revenue.
Teradyne, Inc.
Teradyne delivers a moderate 19.2% ROE and 19.2% net margin, reflecting efficient operations but lower profitability than Lam. The stock trades at an expensive P/E of 36.9 and a 7.1 PB, indicating stretched valuation. Dividend yield remains low at 0.4%, while the company prioritizes growth through a sizable 16.3% R&D spend on revenue.
Premium Valuation vs. Operational Safety
Lam Research offers superior profitability and a more balanced valuation profile, supporting stronger returns despite a modest dividend. Teradyne, while favoring growth, carries a stretched price that may weigh on risk-adjusted returns. Investors seeking operational safety lean toward Lam, while growth-oriented profiles may find Teradyne more appealing.
Which one offers the Superior Shareholder Reward?
I see Lam Research (LRCX) offers a higher dividend yield near 0.92% with a payout ratio around 21%, backed by strong free cash flow coverage above 3x. Its steady buyback program further enhances shareholder returns. Teradyne (TER) yields only about 0.38%, with a lighter payout ratio near 14%, and a more modest buyback intensity. TER reinvests heavily in growth, but its dividend sustainability is less compelling given a free cash flow coverage below 2.5x. Historically, I’ve observed that Lam’s balanced distribution mix of dividends plus buybacks tends to outperform in total return. In 2026, I judge Lam Research’s shareholder reward as superior due to its sustainable, well-covered distributions combined with consistent buybacks.
Comparative Score Analysis: The Strategic Profile
The radar chart exposes the core DNA and strategic trade-offs of Lam Research Corporation and Teradyne, Inc.:
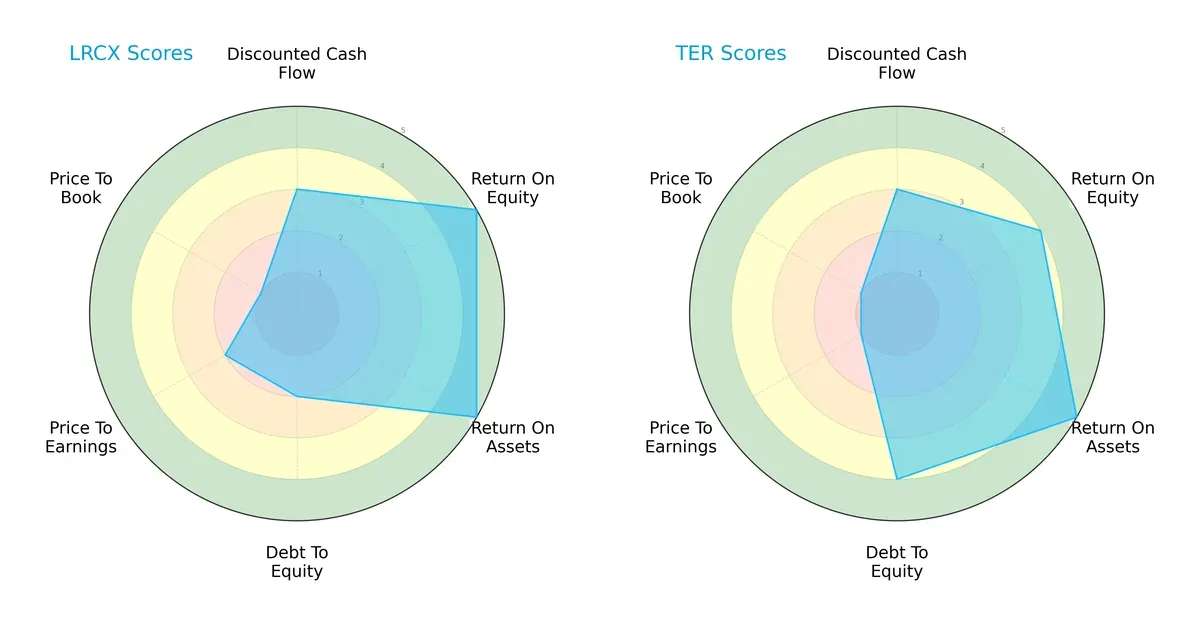
Lam Research shows superior profitability with top ROE (5) and ROA (5) scores but carries moderate leverage risk (Debt/Equity score 2). Teradyne balances financial risk better with a stronger Debt/Equity score (4) but sacrifices some return on equity (4) and suffers from weaker valuation metrics (P/E and P/B scores at 1). Overall, Lam Research relies on operational excellence, while Teradyne adopts a more conservative capital structure but faces valuation challenges.
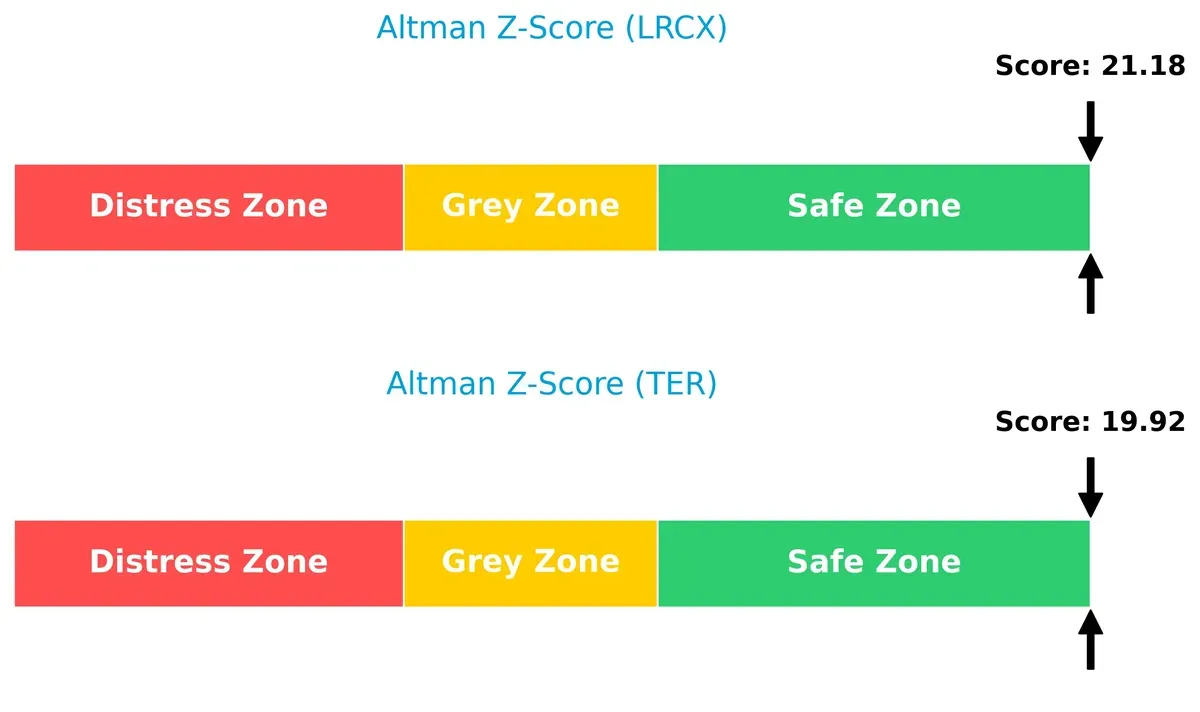
Bankruptcy Risk: Solvency Showdown
Lam Research’s Altman Z-Score (21.18) slightly outpaces Teradyne’s (19.92), both firmly in the safe zone. This indicates robust solvency and low bankruptcy risk for both firms in the current cycle:
Financial Health: Quality of Operations
Lam Research scores an 8 on the Piotroski F-Score, signaling very strong financial health. Teradyne’s 5 is average, suggesting some internal weaknesses relative to Lam Research:
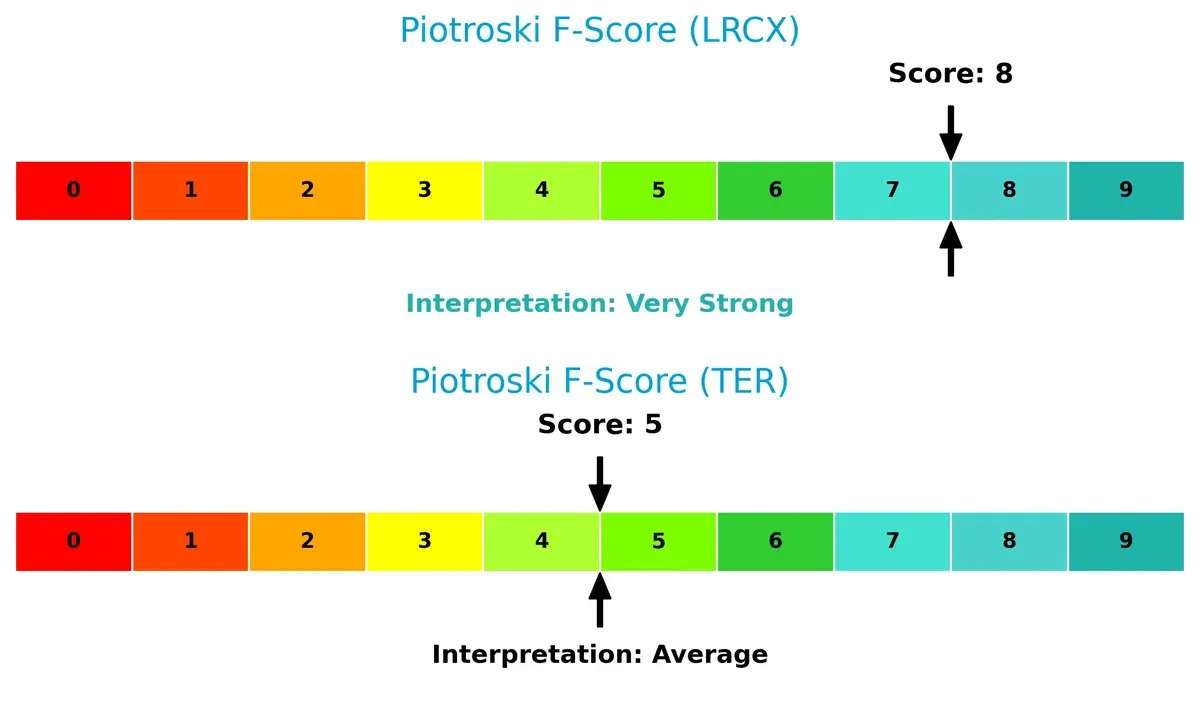
Lam Research’s internal metrics reflect peak operational quality. Teradyne’s middling score calls for caution on its financial resilience.
How are the two companies positioned?
This section dissects the operational DNA of Lam Research and Teradyne by comparing their revenue distribution and internal strengths and weaknesses. The goal is to confront their economic moats and identify which model offers the most resilient, sustainable competitive advantage today.
Revenue Segmentation: The Strategic Mix
This visual comparison dissects how Lam Research Corporation and Teradyne, Inc. diversify their income streams and where their primary sector bets lie:
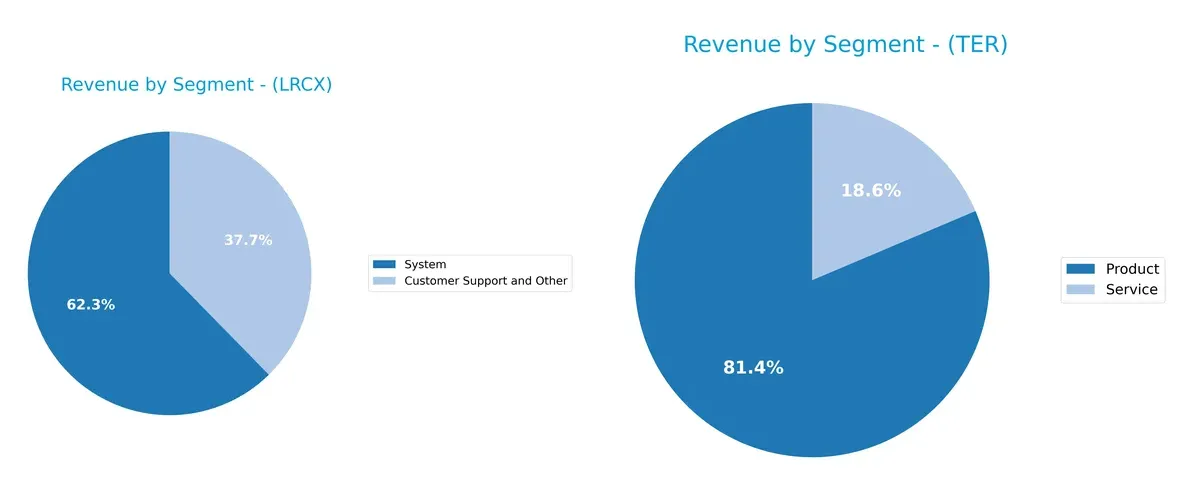
Lam Research anchors revenue in two segments: Systems at $11.5B and Customer Support at $6.9B in 2025, showing a balanced yet concentrated portfolio. Teradyne pivots heavily on Products, generating $2.3B versus $525M in Services, highlighting product dominance but less diversification. Lam’s broader mix suggests stronger ecosystem lock-in, while Teradyne’s reliance on a single segment signals greater concentration risk amid market shifts.
Strengths and Weaknesses Comparison
This table compares the Strengths and Weaknesses of Lam Research Corporation (LRCX) and Teradyne, Inc. (TER):
LRCX Strengths
- High profitability with 29% net margin and 54% ROE
- Strong ROIC at 34%, outperforming typical sector WACC
- Solid balance sheet with current ratio 2.21 and low debt-to-assets 22%
- Diversified revenue from Systems and Customer Support segments
- Significant global presence, especially in China, Korea, and Taiwan
TER Strengths
- Favorable profitability with 19% net margin and 19% ROE
- Strong balance sheet featuring very low debt-to-assets 2% and high interest coverage 171
- Diverse product and services revenue streams
- Global footprint across Asia, EMEA, and US markets
- Consistent asset utilization with fixed asset turnover 4.88
LRCX Weaknesses
- WACC at 12.09% exceeds cost efficiency targets
- High price-to-book ratio at 12.69 signals potential overvaluation
- Dividend yield under 1% may limit income appeal
- Moderate asset turnover at 0.86 below sector leaders
TER Weaknesses
- WACC above 12% indicates elevated capital cost
- Elevated PE ratio at 37 raises valuation concerns
- Price-to-book ratio of 7.11 suggests premium valuation
- Lower ROIC at 17% than LRCX, limiting capital efficiency
- Dividend yield below 0.4% restricts shareholder returns
Both companies exhibit strong financial health and global diversification. LRCX leads in profitability and capital efficiency, while TER excels in low leverage and broad market reach. Valuation metrics present cautionary signals for both, impacting their strategic flexibility.
The Moat Duel: Analyzing Competitive Defensibility
A structural moat is the only reliable shield protecting long-term profits from relentless competitive erosion. Let’s compare two semiconductor equipment leaders:
Lam Research Corporation: Innovation-Driven Switching Costs
Lam’s moat stems from high switching costs anchored in specialized semiconductor fabrication tools. This drives a robust 32% EBIT margin and 21.9% ROIC premium over WACC. In 2026, expanding advanced wafer processing deepens this advantage.
Teradyne, Inc.: Diversified Testing Ecosystem
Teradyne’s moat relies on a broad testing platform ecosystem, contrasting Lam’s tool specialization. It sustains value with a 58.5% gross margin but shows a declining ROIC trend. Growth hinges on industrial automation and 5G test markets.
Innovation Lock-In vs. Ecosystem Breadth
Lam Research holds the deeper moat with durable, rising ROIC and high profitability, signaling superior capital efficiency. Teradyne creates value but faces margin pressures and a weakening moat. Lam is better positioned to defend market share long term.
Which stock offers better returns?
Over the past year, both Lam Research Corporation and Teradyne, Inc. delivered strong price gains with accelerating bullish trends and increasing trading volumes, highlighting robust market demand dynamics.
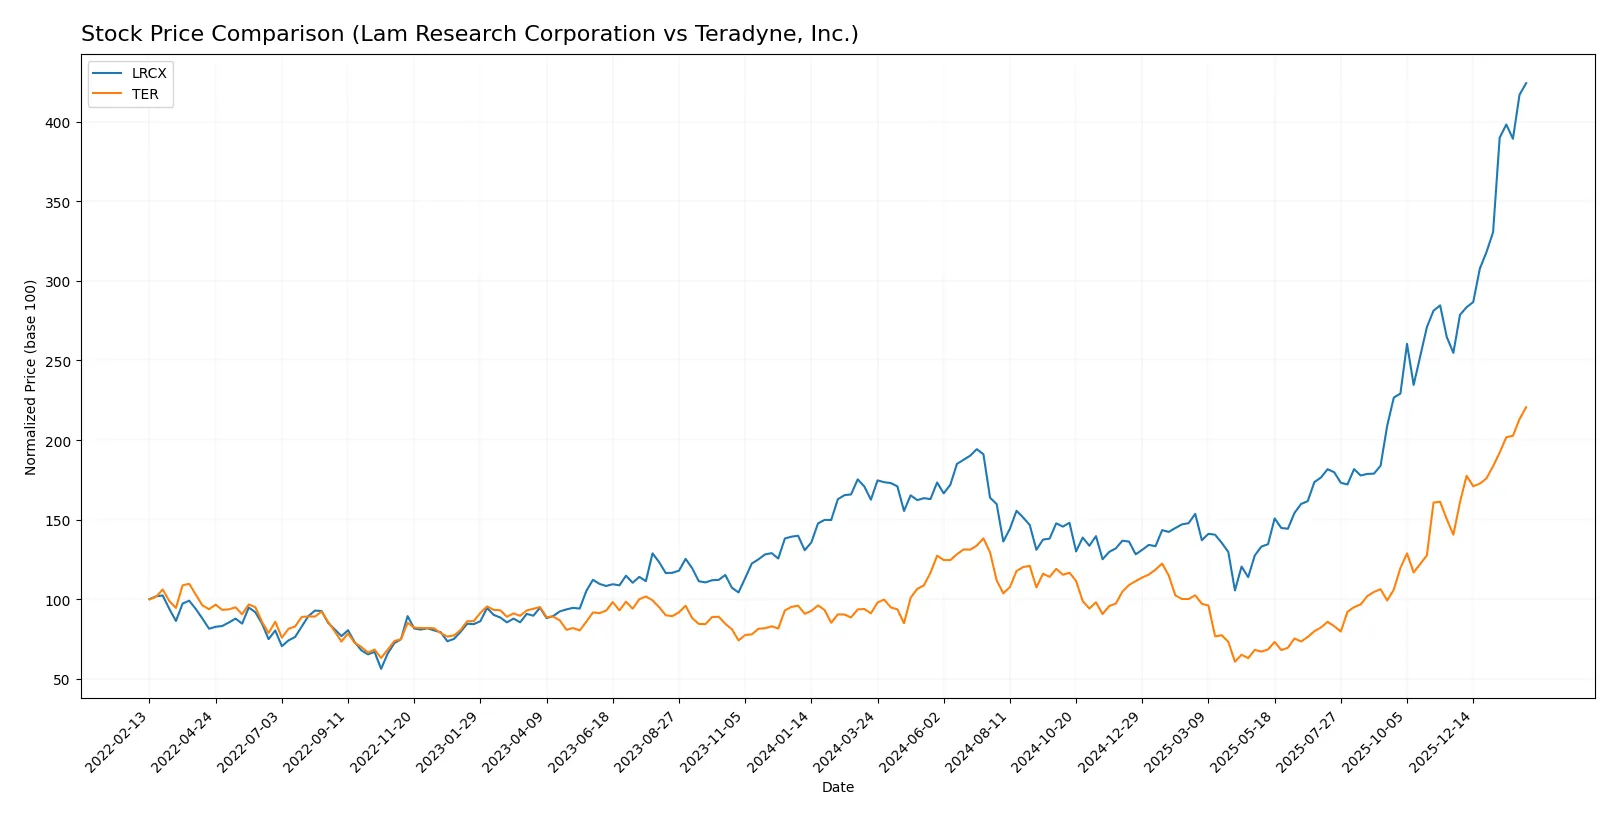
Trend Comparison
Lam Research’s stock surged 161% over the past 12 months, showing an accelerating bullish trend. It reached a high of 237.5 and a low of 59.1, with notable volatility at a 39.2 standard deviation.
Teradyne’s stock gained 142% over the same period, also with accelerating momentum. It hit a high of 249.5 and a low of 68.7, with volatility slightly lower at a 38.5 standard deviation.
Lam Research outperformed Teradyne by roughly 19 percentage points, delivering the higher overall market performance during the last year.
Target Prices
Analyst consensus signals cautious optimism for both Lam Research Corporation and Teradyne, Inc.
| Company | Target Low | Target High | Consensus |
|---|---|---|---|
| Lam Research Corporation | 127 | 325 | 266.76 |
| Teradyne, Inc. | 136 | 280 | 230.17 |
Lam Research’s consensus target at 267 exceeds its current price of 237.5, suggesting upside potential. Teradyne’s target consensus at 230 remains below its current 249.53 price, indicating some downside risk.

Don’t Let Luck Decide Your Entry Point
Optimize your entry points with our advanced ProRealTime indicators. You’ll get efficient buy signals with precise price targets for maximum performance. Start outperforming now!
How do institutions grade them?
Lam Research Corporation Grades
The table below summarizes recent institutional grades for Lam Research Corporation.
| Grading Company | Action | New Grade | Date |
|---|---|---|---|
| UBS | Maintain | Buy | 2026-01-29 |
| Wells Fargo | Maintain | Overweight | 2026-01-29 |
| JP Morgan | Maintain | Overweight | 2026-01-29 |
| RBC Capital | Maintain | Outperform | 2026-01-29 |
| Citigroup | Maintain | Buy | 2026-01-29 |
| Stifel | Maintain | Buy | 2026-01-29 |
| Morgan Stanley | Maintain | Equal Weight | 2026-01-29 |
| Needham | Maintain | Buy | 2026-01-29 |
| Susquehanna | Maintain | Positive | 2026-01-29 |
| Goldman Sachs | Maintain | Buy | 2026-01-29 |
Teradyne, Inc. Grades
The following table shows recent institutional grades for Teradyne, Inc.
| Grading Company | Action | New Grade | Date |
|---|---|---|---|
| Cantor Fitzgerald | Maintain | Overweight | 2026-02-02 |
| Stifel | Maintain | Buy | 2026-01-30 |
| UBS | Maintain | Buy | 2026-01-26 |
| B of A Securities | Maintain | Buy | 2026-01-22 |
| Stifel | Maintain | Buy | 2026-01-14 |
| B of A Securities | Maintain | Buy | 2026-01-13 |
| Goldman Sachs | Upgrade | Buy | 2025-12-16 |
| Stifel | Upgrade | Buy | 2025-12-02 |
| Citigroup | Maintain | Buy | 2025-11-12 |
| JP Morgan | Maintain | Neutral | 2025-10-30 |
Which company has the best grades?
Lam Research Corporation holds consistently strong grades, including multiple “Buy” and “Outperform” ratings from top firms. Teradyne, Inc. also shows solid “Buy” and “Overweight” grades, but includes a “Neutral” from JP Morgan. Lam Research’s broader consensus of positive grades may suggest stronger institutional confidence, which could influence investor sentiment more favorably.
Risks specific to each company
In 2026’s complex market landscape, the following risk categories pinpoint critical pressure points and systemic threats confronting Lam Research Corporation and Teradyne, Inc.:
1. Market & Competition
Lam Research Corporation
- Operates in highly cyclical semiconductor equipment sector facing intense global competition.
Teradyne, Inc.
- Competes in diversified segments including automation; faces pressure from rapidly evolving tech and new entrants.
2. Capital Structure & Debt
Lam Research Corporation
- Moderate leverage (D/E 0.48) with strong interest coverage (33.43x) indicates prudent financial risk management.
Teradyne, Inc.
- Minimal leverage (D/E 0.03) and very high interest coverage (170.8x) reflect conservative capital structure and low financial risk.
3. Stock Volatility
Lam Research Corporation
- Beta of 1.78 signals above-market volatility, typical for semiconductor equipment firms.
Teradyne, Inc.
- Slightly higher beta at 1.82 suggests marginally greater sensitivity to market swings.
4. Regulatory & Legal
Lam Research Corporation
- Exposure to export controls and international trade restrictions, especially with China tensions.
Teradyne, Inc.
- Regulatory risks tied to defense/aerospace segment and global supply chain compliance.
5. Supply Chain & Operations
Lam Research Corporation
- Complex semiconductor manufacturing supply chain vulnerable to disruptions and component shortages.
Teradyne, Inc.
- Broad operational footprint with risks in robotics and wireless test equipment supply chains.
6. ESG & Climate Transition
Lam Research Corporation
- Faces pressure to reduce emissions in energy-intensive fabrication equipment production.
Teradyne, Inc.
- Must manage ESG risks related to industrial automation and sustainable robotics development.
7. Geopolitical Exposure
Lam Research Corporation
- Significant international sales, notably in Asia, expose it to geopolitical tensions and tariffs.
Teradyne, Inc.
- Global customer base with defense contracts increases sensitivity to geopolitical shifts.
Which company shows a better risk-adjusted profile?
Lam Research’s principal risk lies in its exposure to cyclical semiconductor demand and geopolitical tensions impacting supply and sales. Teradyne faces valuation risk given its high P/E and P/B ratios despite a conservative capital structure. Lam’s robust profitability and financial health suggest a stronger risk-adjusted position. Teradyne’s higher stock volatility and stretched valuation justify caution despite its low leverage.
Final Verdict: Which stock to choose?
Lam Research Corporation’s superpower lies in its robust capital efficiency and growing profitability. It consistently generates strong returns well above its cost of capital, signaling a durable competitive advantage. A point of vigilance is its relatively high price-to-book ratio, which could pressure valuation. LRCX fits well in an aggressive growth portfolio.
Teradyne, Inc. leverages a strategic moat rooted in its recurring revenue streams and cash flow stability. Its balance sheet shows lower leverage and higher interest coverage than LRCX, offering a safer profile. However, its declining return on invested capital signals caution. TER suits investors seeking growth at a reasonable price with moderate risk tolerance.
If you prioritize high capital efficiency and durable growth, LRCX is the compelling choice due to its expanding moat and superior returns. However, if you seek a steadier income stream with a more conservative balance sheet, TER offers better stability despite its diminishing profitability. Both present valid scenarios depending on your risk appetite and investment horizon.
Disclaimer: Investment carries a risk of loss of initial capital. The past performance is not a reliable indicator of future results. Be sure to understand risks before making an investment decision.
Go Further
I encourage you to read the complete analyses of Lam Research Corporation and Teradyne, Inc. to enhance your investment decisions: