Home > Comparison > Technology > LRCX vs STM
The strategic rivalry between Lam Research Corporation and STMicroelectronics N.V. shapes the semiconductor industry’s future. Lam Research, a specialized equipment manufacturer, contrasts with STMicroelectronics, a diversified semiconductor product developer. This head-to-head highlights a clash between niche capital-intensive innovation and broad-market semiconductor solutions. This analysis aims to identify which company’s trajectory delivers superior risk-adjusted returns, guiding investors in optimizing portfolio exposure within the evolving technology sector.
Table of contents
Companies Overview
Lam Research and STMicroelectronics stand as pivotal players shaping today’s semiconductor landscape.
Lam Research Corporation: Semiconductor Equipment Innovator
Lam Research dominates as a leading supplier of semiconductor processing equipment. Its revenue stems from designing, manufacturing, and servicing advanced tools used in integrated circuit fabrication. In 2026, Lam focused strategically on enhancing precision film deposition and etching technologies, crucial for next-generation chip manufacturing.
STMicroelectronics N.V.: Diverse Semiconductor Solutions Provider
STMicroelectronics operates as a broad-based semiconductor manufacturer with a portfolio spanning automotive ICs, analog and MEMS sensors, and microcontrollers. It generates revenue through diversified product groups targeting automotive, industrial, and consumer electronics markets. The company’s 2026 strategy emphasized expanding microcontroller capabilities and advanced power electronics to meet evolving industry demands.
Strategic Collision: Similarities & Divergences
While Lam Research prioritizes specialized manufacturing equipment, STMicroelectronics delivers end-user semiconductor components across multiple segments. Their competition centers on the semiconductor value chain’s upstream equipment versus downstream product innovation. This contrast shapes distinct investment profiles: Lam offers exposure to semiconductor capital expenditures, whereas STMicroelectronics reflects end-market semiconductor consumption trends.
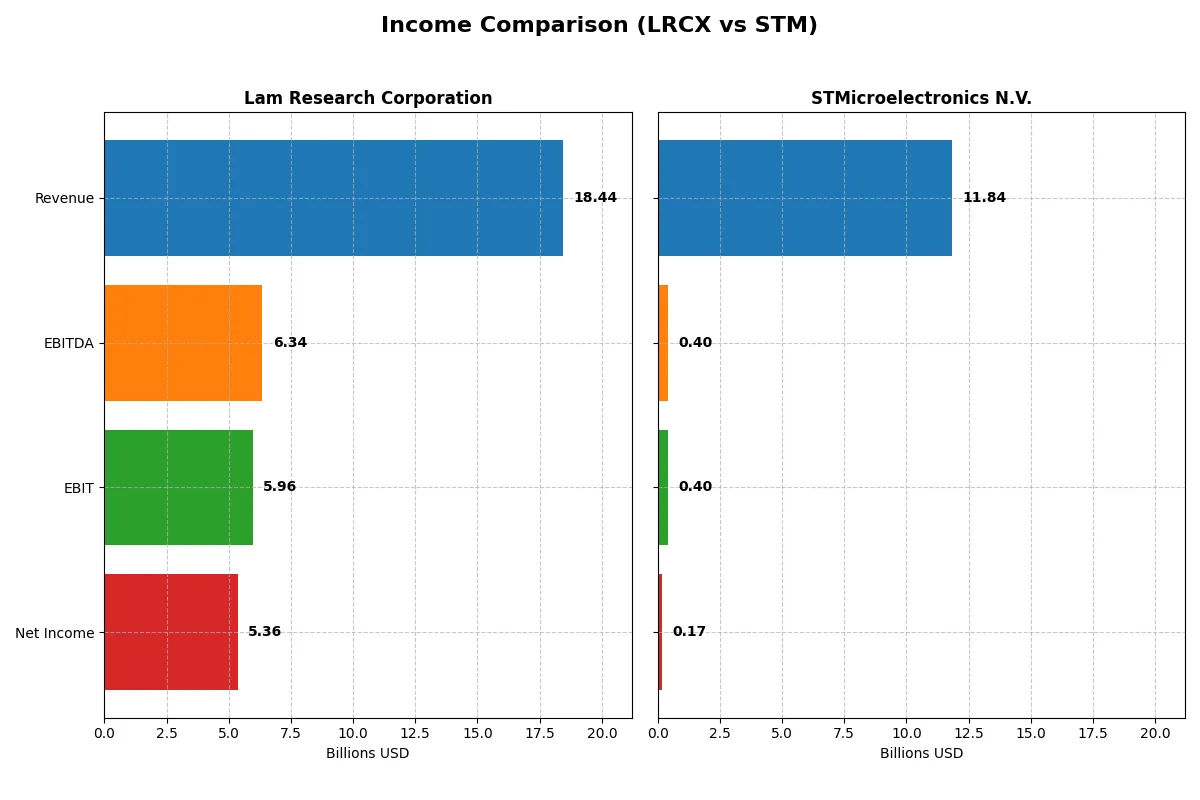
Income Statement Comparison
This data dissects the core profitability and scalability of both corporate engines to reveal who dominates the bottom line:
| Metric | Lam Research (LRCX) | STMicroelectronics (STM) |
|---|---|---|
| Revenue | 18.4B | 11.8B |
| Cost of Revenue | 9.5B | 7.8B |
| Operating Expenses | 3.1B | 3.7B |
| Gross Profit | 9.0B | 4.0B |
| EBITDA | 6.3B | 0.4B |
| EBIT | 6.0B | 0.4B |
| Interest Expense | 178M | 0 |
| Net Income | 5.4B | 0 |
| EPS | 4.17 | 0.19 |
| Fiscal Year | 2025 | 2025 |
Income Statement Analysis: The Bottom-Line Duel
The income statement comparison reveals which company operates more efficiently and converts revenue into profit with greater skill.
Lam Research Corporation Analysis
Lam Research displays a strong upward trajectory in revenue and net income from 2021 to 2025, with 2025 revenue hitting $18.4B and net income at $5.36B. Its gross margin stands healthy at 48.7%, while the net margin impresses at 29.1%. The company’s EBIT margin of 32.3% in 2025 signals robust operational efficiency and accelerating profitability momentum.
STMicroelectronics N.V. Analysis
STMicroelectronics’ revenue declined over the period, falling to $11.8B in 2025 with net income nearly wiping out to zero. The gross margin of 33.9% remains moderate, but EBIT and net margins are weak at 3.4% and 1.4%, respectively. The 2025 results reflect sharp margin compression and deteriorating profitability, indicating operational challenges and shrinking returns.
Margin Power vs. Revenue Scale
Lam Research dominates with consistent revenue growth and strong margin expansion, delivering superior profitability and operational leverage. In contrast, STMicroelectronics suffers from declining sales and eroding margins. For investors prioritizing fundamental strength and earnings quality, Lam Research offers a markedly more attractive income statement profile.
Financial Ratios Comparison
These vital ratios act as a diagnostic tool to expose the underlying fiscal health, valuation premiums, and capital efficiency of the companies compared below:
| Ratios | Lam Research Corporation (LRCX) | STMicroelectronics N.V. (STM) |
|---|---|---|
| ROE | 54.3% | 0.9% |
| ROIC | 34.0% | 0.7% |
| P/E | 23.4 | 0 |
| P/B | 12.7 | 0 |
| Current Ratio | 2.21 | 3.36 |
| Quick Ratio | 1.55 | 2.43 |
| D/E (Debt-to-Equity) | 0.48 | 0.12 |
| Debt-to-Assets | 22.3% | 8.6% |
| Interest Coverage | 33.1 | 0 |
| Asset Turnover | 0.86 | 0.48 |
| Fixed Asset Turnover | 7.59 | 1.07 |
| Payout Ratio | 21.5% | 0% |
| Dividend Yield | 0.92% | 0% |
| Fiscal Year | 2025 | 2025 |
Efficiency & Valuation Duel: The Vital Signs
Financial ratios act as a company’s DNA, revealing hidden risks and operational excellence essential for informed investment decisions.
Lam Research Corporation
Lam Research exhibits strong profitability with a 54.33% ROE and a solid 29.06% net margin, signaling operational efficiency. The P/E ratio at 23.36 suggests a fairly valued stock, though a high P/B of 12.69 indicates stretched equity valuation. Shareholders receive modest 0.92% dividends, while robust R&D at 11.37% of revenue fuels growth.
STMicroelectronics N.V.
STMicroelectronics posts weak profitability with a 0.93% ROE and 1.41% net margin, reflecting operational challenges. The absence of meaningful P/E and P/B ratios signals valuation uncertainty. Its strong current ratio of 3.36 contrasts with low asset turnover of 0.48. No dividends are paid; capital channels primarily into research, accounting for 17.32% of revenue.
Premium Valuation vs. Operational Safety
Lam Research balances high profitability with moderate valuation, offering an attractive risk-reward profile. STMicroelectronics, with weaker returns and valuation opacity, presents more uncertainty. Investors seeking stable operational excellence may lean toward Lam, while those favoring deep reinvestment might consider STMicroelectronics’ growth focus.
Which one offers the Superior Shareholder Reward?
I compare Lam Research Corporation (LRCX) and STMicroelectronics N.V. (STM) on dividends, payout ratios, and buybacks. LRCX yields about 0.9%, with a 21% payout ratio, comfortably covered by strong free cash flow (4.2B per share). STM yields roughly 1.3%, but recent free cash flow is negative, signaling dividend risk. LRCX maintains robust buyback programs, fueling total shareholder return. STM shows limited buybacks and reinvests heavily in capex, prioritizing growth over distributions. Given LRCX’s sustainable dividends backed by cash flow and aggressive buybacks, I favor LRCX for superior total shareholder reward in 2026.
Comparative Score Analysis: The Strategic Profile
The radar chart reveals the fundamental DNA and trade-offs of Lam Research and STMicroelectronics, highlighting their strategic strengths and weaknesses:
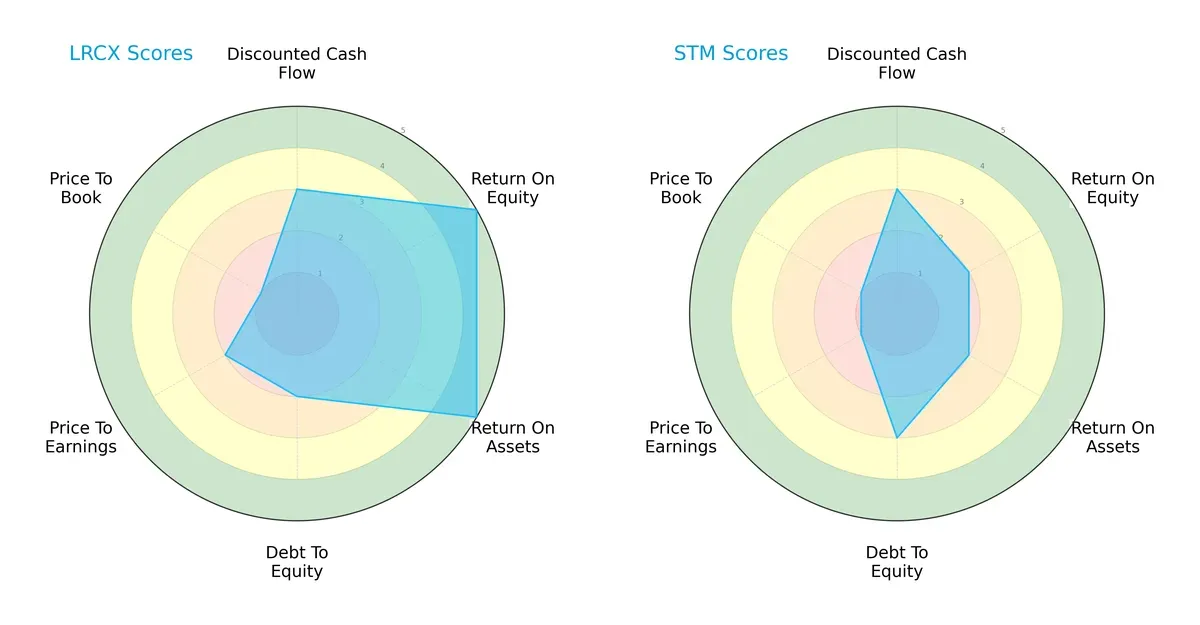
Lam Research dominates in profitability metrics with top ROE and ROA scores of 5 each, indicating superior capital efficiency. STMicroelectronics lags with moderate scores of 2 in these areas. Lam Research’s balance sheet shows moderate leverage risk (Debt/Equity score 2), while STMicroelectronics carries slightly higher financial risk (score 3). Both firms suffer valuation challenges with low P/E and P/B scores, but Lam Research’s profile is more balanced, relying on operational excellence rather than undervaluation.
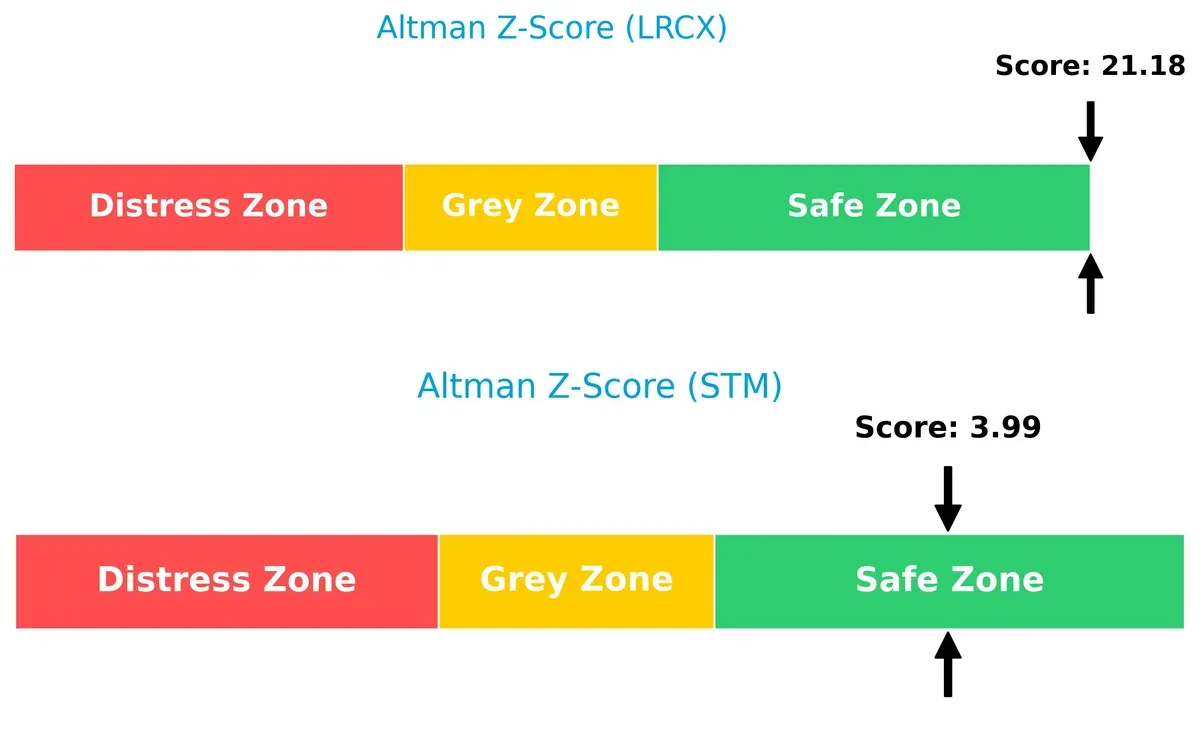
Bankruptcy Risk: Solvency Showdown
Lam Research’s Altman Z-Score of 21.2 vastly exceeds STMicroelectronics’ 4.0, placing both safely above distress thresholds but showing Lam Research’s superior financial resilience in the current cycle:
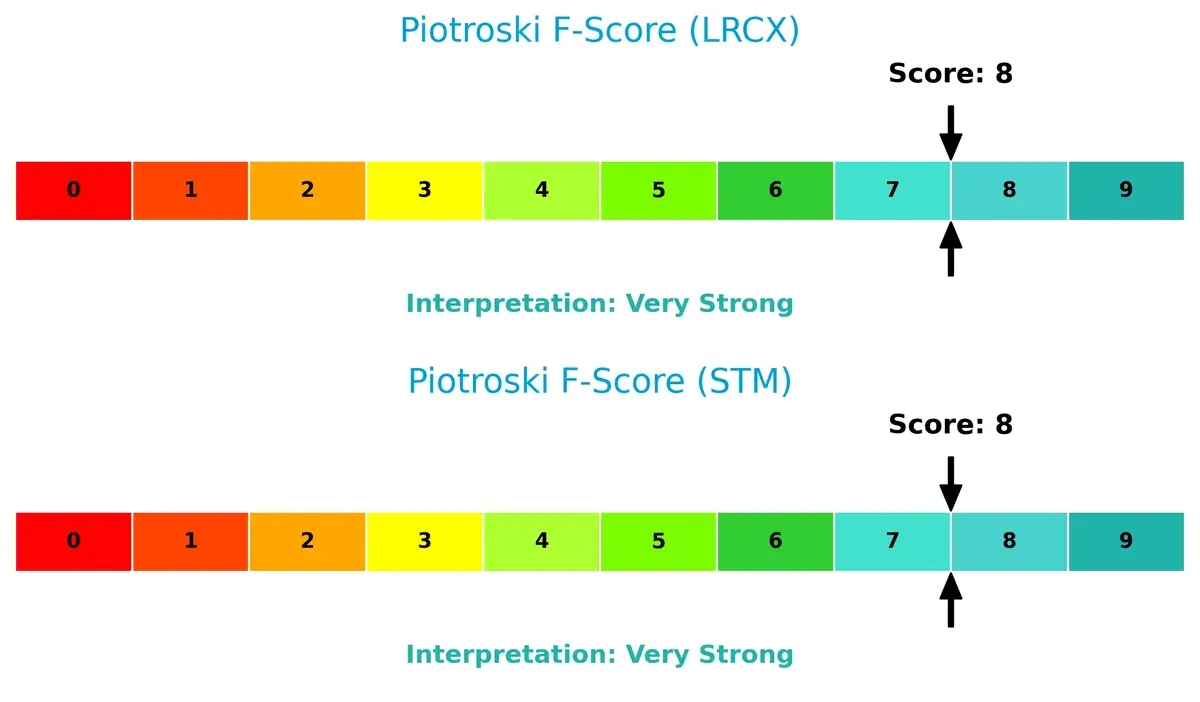
Financial Health: Quality of Operations
Both companies score an 8 on the Piotroski F-Score, signaling very strong financial health. Neither shows internal red flags, but this parity underscores Lam Research’s edge is operational efficiency rather than financial stability alone:
How are the two companies positioned?
This section dissects the operational DNA of Lam Research and STMicroelectronics by comparing their revenue distribution and internal dynamics. The goal is to confront their economic moats and identify which model offers the most resilient competitive advantage today.
Revenue Segmentation: The Strategic Mix
This comparison dissects how Lam Research Corporation and STMicroelectronics diversify their income streams and where their primary sector bets lie:
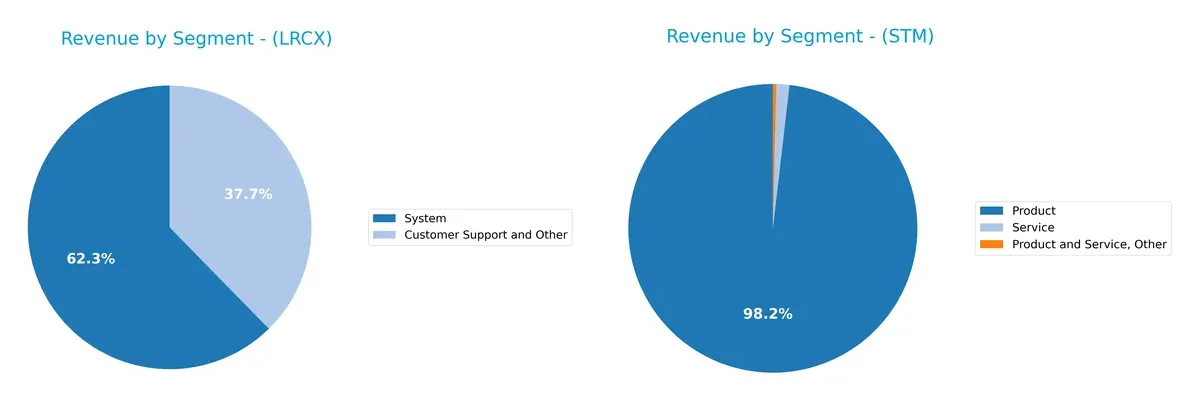
Lam Research concentrates revenue heavily in its System segment, with $11.5B in 2025, dwarfing its $6.9B Customer Support and Other segment. STMicroelectronics shows a broader product spread, with $13.2B in Product revenue, but also generates modest Service and Other revenues totaling around $260M. Lam’s reliance on Systems anchors it in semiconductor equipment, exposing cyclical risk. STM’s diversification across product and service lines cushions against sector volatility and suggests a balanced semiconductor device strategy.
Strengths and Weaknesses Comparison
This table compares the Strengths and Weaknesses of Lam Research Corporation and STMicroelectronics N.V.:
Lam Research Corporation Strengths
- High profitability with 29.06% net margin and 54.33% ROE
- Strong capital efficiency with 34.0% ROIC well above 12.09% WACC
- Solid liquidity ratios: current ratio 2.21, quick ratio 1.55
- Moderate leverage with debt/equity 0.48 and strong interest coverage at 33.43
- Significant global presence, notably strong sales in China, Korea, and Taiwan
- Diverse revenue streams from Systems and Customer Support segments
STMicroelectronics N.V. Strengths
- Favorable valuation metrics with zero PE and PB ratios indicating potential undervaluation
- Low leverage with debt/equity 0.12 and debt/assets 8.6%
- Robust interest coverage reported as infinite
- Strong quick ratio at 2.43 supporting short-term liquidity
- Global footprint with notable presence in Singapore, Switzerland, and the United States
- Diverse product segments including automotive, analog, and microcontrollers
Lam Research Corporation Weaknesses
- Elevated weighted average cost of capital at 12.09%, higher than peer benchmarks
- Unfavorable high price-to-book ratio at 12.69, suggesting expensive stock price
- Dividend yield low at 0.92%, limiting income for investors
- Asset turnover moderate at 0.86, below sector leaders
- Neutral fixed asset turnover at 7.59 indicates room for efficiency improvement
- Limited diversification outside semiconductor equipment systems and support
STMicroelectronics N.V. Weaknesses
- Very low profitability with 1.41% net margin and 0.93% ROE
- ROIC at 0.67%, below WACC of 9.54%, indicating value destruction
- Current ratio unusually high at 3.36, possibly signaling inefficient capital use
- Unfavorable asset turnover at 0.48 showing weak asset utilization
- Dividend yield at 0%, no income return for shareholders
- Lower market share impact reflected in muted financial performance
Lam Research shows strong profitability and operational efficiency but faces valuation and capital cost challenges. STMicroelectronics exhibits strong liquidity and global diversification but struggles with profitability and asset utilization. These contrasts highlight differing strategic focuses and financial health profiles.
The Moat Duel: Analyzing Competitive Defensibility
A structural moat is the single bulwark protecting long-term profits from relentless competition erosion. Let’s dissect the moats of two semiconductor giants:
Lam Research Corporation: Precision Engineering Moat
Lam’s moat stems from advanced proprietary semiconductor processing equipment and high switching costs. Its robust 32% EBIT margin and 22% ROIC above WACC confirm durable value creation. New product innovations in atomic layer deposition deepen this advantage in 2026.
STMicroelectronics N.V.: Diversified Product Moat Under Pressure
STM relies on product diversity across analog, MEMS, and microcontrollers to fend off rivals. However, its negative ROIC trend and 3.4% EBIT margin reveal weakening profitability. Revenue declines signal mounting pressure, though expansion in wireless solutions offers a potential turnaround.
Precision Engineering vs. Product Breadth: Who Holds the Moat Edge?
Lam Research wields a deeper, more durable moat, evidenced by its superior ROIC and margin stability. STMicroelectronics’ broader portfolio lacks the financial strength to defend market share effectively in 2026. Lam is better equipped to sustain competitive dominance.
Which stock offers better returns?
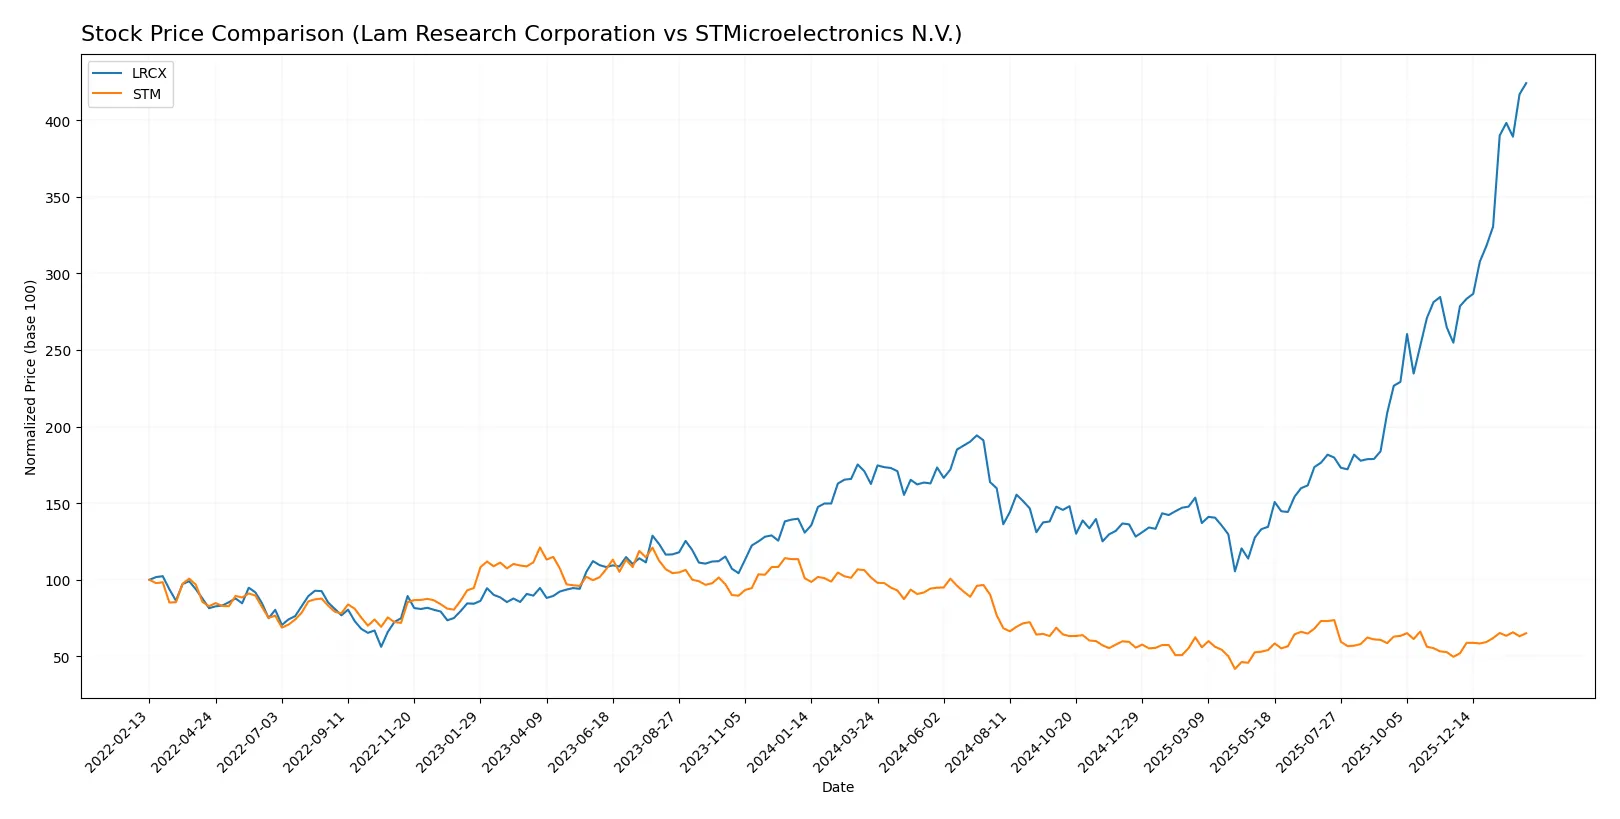
The past year shows sharply divergent price movements: Lam Research surges with accelerating gains, while STMicroelectronics faces a notable decline despite recent recovery signs.
Trend Comparison
Lam Research’s stock price rose 161% over 12 months, marking a bullish trend with accelerating momentum and high volatility between $59 and $237.5.
STMicroelectronics dropped 35.85% over the same period, confirming a bearish trend despite recent modest recovery and low volatility near $18.5 to $44.85.
Lam Research outperforms STMicroelectronics significantly, delivering the highest market returns and stronger upward momentum over the past year.
Target Prices
Analysts present a mixed but optimistic target consensus for Lam Research Corporation and STMicroelectronics N.V.
| Company | Target Low | Target High | Consensus |
|---|---|---|---|
| Lam Research Corporation | 127 | 325 | 266.76 |
| STMicroelectronics N.V. | 28 | 45 | 37.67 |
Lam Research’s consensus target of $267 sits 12% above its current $237.5 price, signaling moderate upside. STMicroelectronics shows a tighter range with a consensus 31% above the $28.77 current price, reflecting higher expected growth.

Don’t Let Luck Decide Your Entry Point
Optimize your entry points with our advanced ProRealTime indicators. You’ll get efficient buy signals with precise price targets for maximum performance. Start outperforming now!
How do institutions grade them?
Lam Research Corporation Grades
The following table summarizes recent grades from major grading companies for Lam Research Corporation:
| Grading Company | Action | New Grade | Date |
|---|---|---|---|
| UBS | Maintain | Buy | 2026-01-29 |
| Wells Fargo | Maintain | Overweight | 2026-01-29 |
| JP Morgan | Maintain | Overweight | 2026-01-29 |
| RBC Capital | Maintain | Outperform | 2026-01-29 |
| Citigroup | Maintain | Buy | 2026-01-29 |
| Stifel | Maintain | Buy | 2026-01-29 |
| Morgan Stanley | Maintain | Equal Weight | 2026-01-29 |
| Needham | Maintain | Buy | 2026-01-29 |
| Susquehanna | Maintain | Positive | 2026-01-29 |
| Goldman Sachs | Maintain | Buy | 2026-01-29 |
STMicroelectronics N.V. Grades
The following table summarizes recent grades from major grading companies for STMicroelectronics N.V.:
| Grading Company | Action | New Grade | Date |
|---|---|---|---|
| TD Cowen | Maintain | Buy | 2025-10-24 |
| Susquehanna | Maintain | Positive | 2025-10-22 |
| Susquehanna | Maintain | Positive | 2025-07-25 |
| Baird | Upgrade | Outperform | 2025-07-22 |
| Susquehanna | Maintain | Positive | 2025-07-22 |
| Jefferies | Upgrade | Buy | 2025-02-19 |
| Bernstein | Downgrade | Market Perform | 2025-02-05 |
| Susquehanna | Maintain | Positive | 2025-01-31 |
| Barclays | Downgrade | Underweight | 2025-01-22 |
| JP Morgan | Downgrade | Neutral | 2024-12-09 |
Which company has the best grades?
Lam Research consistently receives strong buy and outperform grades across multiple firms. STMicroelectronics shows mixed ratings with recent downgrades from several firms. Lam Research’s steadier positive consensus implies higher institutional confidence, which may influence investor sentiment accordingly.
Risks specific to each company
The following categories identify critical pressure points and systemic threats facing Lam Research Corporation and STMicroelectronics N.V. in the 2026 market environment:
1. Market & Competition
Lam Research Corporation
- Operates globally in semiconductor manufacturing equipment, facing aggressive innovation cycles and cyclical demand
STMicroelectronics N.V.
- Competes in diverse semiconductor segments with pressure from automotive and industrial markets; slower margin growth
2. Capital Structure & Debt
Lam Research Corporation
- Moderate leverage (D/E 0.48) with strong interest coverage (33.4x); manageable debt risk
STMicroelectronics N.V.
- Low leverage (D/E 0.12) and no interest burden; conservative balance sheet but possibly underutilized capital
3. Stock Volatility
Lam Research Corporation
- High beta at 1.78, indicating elevated market sensitivity and price swings
STMicroelectronics N.V.
- Moderate beta at 1.32, less volatile but still sensitive to semiconductor cycle shifts
4. Regulatory & Legal
Lam Research Corporation
- US-based with exposure to export controls and US-China tech tensions
STMicroelectronics N.V.
- European headquarters face evolving EU regulations and trade policies impacting supply chains
5. Supply Chain & Operations
Lam Research Corporation
- Highly reliant on advanced materials and wafer fab equipment suppliers; supply disruptions risk
STMicroelectronics N.V.
- Broad geographic footprint with complex sourcing; vulnerable to raw material price volatility and logistics challenges
6. ESG & Climate Transition
Lam Research Corporation
- Facing increasing pressure to reduce energy intensity in manufacturing processes
STMicroelectronics N.V.
- Actively investing in sustainable technologies, but transition costs may weigh on margins
7. Geopolitical Exposure
Lam Research Corporation
- Significant exposure to US-China tensions affecting sales and supply chains
STMicroelectronics N.V.
- Diverse global presence reduces single-point geopolitical risks but increases complexity
Which company shows a better risk-adjusted profile?
Lam Research’s most significant risk centers on its high stock volatility and geopolitical exposure amid US-China tensions. STMicroelectronics struggles primarily with thin profitability and operational complexity. Lam Research’s strong capital structure and profitability metrics outweigh its volatility risks, yielding a superior risk-adjusted profile. Notably, Lam’s 54% ROE and 34% ROIC confirm disciplined capital allocation despite macro pressures.
Final Verdict: Which stock to choose?
Lam Research’s superpower is its exceptional capital efficiency and robust cash generation, driving value creation with a growing moat. Its point of vigilance lies in a relatively high price-to-book ratio, which could temper returns. This stock suits portfolios aiming for aggressive growth backed by durable profitability.
STMicroelectronics boasts a strategic moat rooted in its broad semiconductor footprint and solid balance sheet, offering greater financial safety than Lam Research. However, its declining profitability and recent revenue challenges warrant caution. It fits well in Growth at a Reasonable Price (GARP) portfolios seeking stability amid cyclical headwinds.
If you prioritize capital-efficient growth with proven value creation, Lam Research outshines as the compelling choice due to its durable competitive advantage and strong returns. However, if you seek a more conservative profile with a defensive balance sheet, STMicroelectronics offers better stability despite its current earnings challenges. Both choices require careful risk management given sector cyclicality.
Disclaimer: Investment carries a risk of loss of initial capital. The past performance is not a reliable indicator of future results. Be sure to understand risks before making an investment decision.
Go Further
I encourage you to read the complete analyses of Lam Research Corporation and STMicroelectronics N.V. to enhance your investment decisions: