Home > Comparison > Technology > LRCX vs SLAB
The strategic rivalry between Lam Research Corporation and Silicon Laboratories Inc. shapes the semiconductor industry’s evolution. Lam Research operates as a capital-intensive leader in semiconductor processing equipment, while Silicon Labs focuses on fabless analog and mixed-signal solutions for IoT applications. This contrast highlights a battle between manufacturing scale and innovative product specialization. This analysis aims to identify which company offers a superior risk-adjusted return for a diversified portfolio amid shifting technological demands.
Table of contents
Companies Overview
Lam Research Corporation and Silicon Laboratories Inc. hold significant positions in the semiconductor industry with distinct market approaches.
Lam Research Corporation: Semiconductor Equipment Powerhouse
Lam Research dominates semiconductor fabrication by designing and servicing advanced processing equipment. Its core revenue stems from tools for wafer etching, deposition, and cleaning vital to integrated circuit manufacturing. In 2026, the company emphasizes expanding high-precision atomic layer deposition and plasma-enhanced CVD technologies to boost semiconductor yield and performance. Market leadership in fab equipment drives its competitive advantage.
Silicon Laboratories Inc.: Mixed-Signal Innovator for IoT
Silicon Laboratories excels as a fabless semiconductor supplier focusing on analog-intensive mixed-signal solutions. It generates revenue through wireless microcontrollers and sensors powering IoT devices across smart homes, industrial automation, and medical sectors. The company’s 2026 strategy targets expanding IoT application coverage and enhancing connectivity features. Its specialization in mixed-signal semiconductors defines its niche market position.
Strategic Collision: Similarities & Divergences
Both companies operate within semiconductors but differ sharply: Lam Research pursues a hardware-intensive, capital equipment model while Silicon Labs focuses on fabless chip design for IoT applications. Their competitive battleground lies in semiconductor innovation, though their end customers diverge—fab operators versus device manufacturers. This contrast creates distinct risk-reward profiles: capital-intensive scale versus specialized, agile growth.
Income Statement Comparison
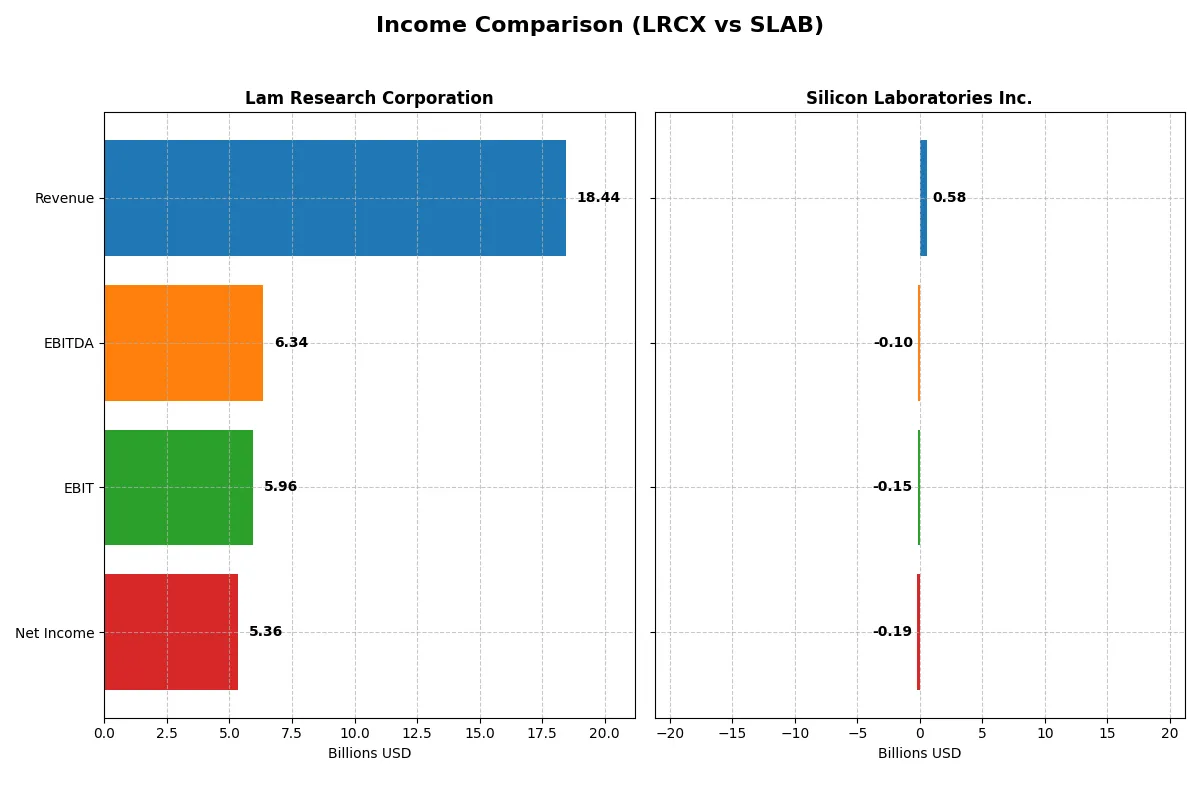
This data dissects the core profitability and scalability of both corporate engines to reveal who dominates the bottom line:
| Metric | Lam Research Corporation (LRCX) | Silicon Laboratories Inc. (SLAB) |
|---|---|---|
| Revenue | 18.4B | 584M |
| Cost of Revenue | 9.5B | 272M |
| Operating Expenses | 3.1B | 478M |
| Gross Profit | 9.0B | 312M |
| EBITDA | 6.3B | -105M |
| EBIT | 6.0B | -154M |
| Interest Expense | 178M | 1.3M |
| Net Income | 5.4B | -191M |
| EPS | 4.17 | -5.93 |
| Fiscal Year | 2025 | 2024 |
Income Statement Analysis: The Bottom-Line Duel
This comparison exposes which company operates with greater income efficiency and profitability over recent years.
Lam Research Corporation Analysis
Lam Research’s revenue climbed steadily from $14.6B in 2021 to $18.4B in 2025. Net income surged 37% over five years, reaching $5.4B in 2025, supported by strong gross (48.7%) and net margins (29.1%). The latest fiscal year highlights solid momentum with a 23.7% revenue increase and a 13.2% net margin expansion, reflecting excellent operational efficiency.
Silicon Laboratories Inc. Analysis
Silicon Labs’ revenue peaked at $1B in 2022 but declined sharply to $584M by 2024. The company suffered net losses in recent years, with a negative net margin of -32.7% in 2024. Despite a favorable gross margin of 53.4%, heavy operating expenses eroded profitability, pushing EBIT and net income deep into the red and signaling deteriorating operational health and poor momentum.
Verdict: Robust Profitability vs. Structural Losses
Lam Research clearly outperforms Silicon Labs, delivering robust top-line growth alongside strong and expanding profitability margins. Silicon Labs struggles with declining revenue and sustained losses, undermining its financial stability. For investors prioritizing consistent earnings and margin strength, Lam Research’s profile is markedly more attractive.
Financial Ratios Comparison
These vital ratios act as a diagnostic tool to expose the underlying fiscal health, valuation premiums, and capital efficiency of the companies compared below:
| Ratios | Lam Research Corporation (LRCX) | Silicon Laboratories Inc. (SLAB) |
|---|---|---|
| ROE | 54.3% | -17.7% |
| ROIC | 34.0% | -14.7% |
| P/E | 23.4 | -21.5 |
| P/B | 12.7 | 3.81 |
| Current Ratio | 2.21 | 6.15 |
| Quick Ratio | 1.55 | 5.07 |
| D/E | 0.48 | 0.014 |
| Debt-to-Assets | 22.3% | 1.27% |
| Interest Coverage | 33.1 | -126.3 |
| Asset Turnover | 0.86 | 0.48 |
| Fixed Asset Turnover | 7.59 | 4.42 |
| Payout Ratio | 21.5% | 0% |
| Dividend Yield | 0.92% | 0% |
| Fiscal Year | 2025 | 2024 |
Efficiency & Valuation Duel: The Vital Signs
Financial ratios act as a company’s DNA, unveiling hidden risks and operational excellence that raw numbers alone cannot reveal.
Lam Research Corporation
Lam Research delivers a stellar 54.33% ROE and a robust 29.06% net margin, signaling high core profitability. Its P/E ratio at 23.36 is fairly valued, while a P/B of 12.69 appears stretched. The company supports shareholders with a modest 0.92% dividend yield, complementing strong reinvestment in R&D at 11.37% of revenue.
Silicon Laboratories Inc.
Silicon Laboratories suffers from negative profitability with a -17.69% ROE and -32.69% net margin, reflecting operational challenges. Its negative P/E ratio indicates losses, though a P/B of 3.81 is more reasonable. No dividends are paid; instead, SLAB aggressively reinvests in R&D at 56.85%, aiming for growth despite current inefficiencies.
Profitability Dominance vs. Growth Gamble
Lam Research offers a superior balance of profitability and reasonable valuation, reducing investment risk. Silicon Laboratories presents a high-risk growth profile with heavy R&D spending but weak returns. Investors prioritizing stable returns should lean toward Lam Research, while those chasing turnaround potential might consider Silicon Laboratories.
Which one offers the Superior Shareholder Reward?
Lam Research Corporation (LRCX) pays a modest dividend yield around 0.9%, with a sustainable payout ratio near 21%, covered comfortably by free cash flow (FCF). It supplements shareholder returns with consistent buybacks, enhancing total return. Silicon Laboratories Inc. (SLAB) pays no dividends and has negative earnings, focusing on reinvestment for growth. SLAB’s buyback activity is minimal due to cash flow challenges and losses. I see LRCX’s balanced dividend and robust buybacks as a superior, sustainable reward model in 2026, compared to SLAB’s riskier growth bet without distributions.
Comparative Score Analysis: The Strategic Profile
The radar chart reveals the fundamental DNA and trade-offs of Lam Research Corporation and Silicon Laboratories Inc., highlighting their financial strengths and weaknesses:
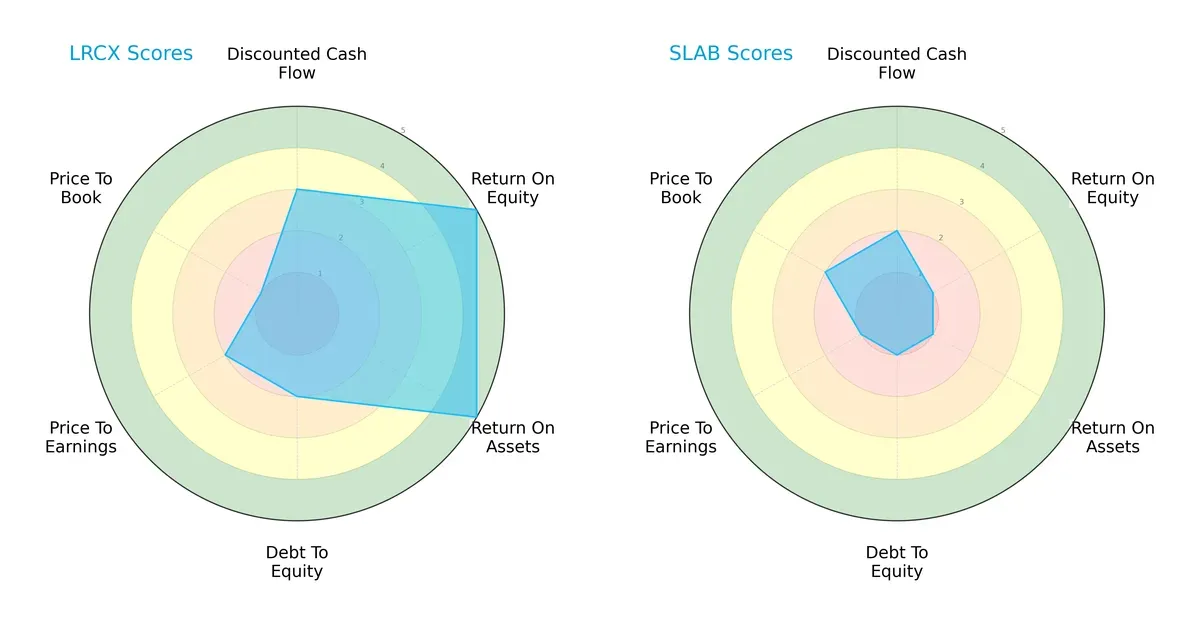
Lam Research dominates in profitability with top ROE and ROA scores (5 each), showing efficient capital and asset use. It holds a moderate position in discounted cash flow (3) but shows weakness in valuation metrics, especially price-to-book (1). Silicon Laboratories has uniformly low scores, signaling broad financial challenges, with only moderate price-to-book valuation (2). Lam Research’s profile is more balanced, relying on operational efficiency, while Silicon Laboratories depends on marginal valuation advantages.
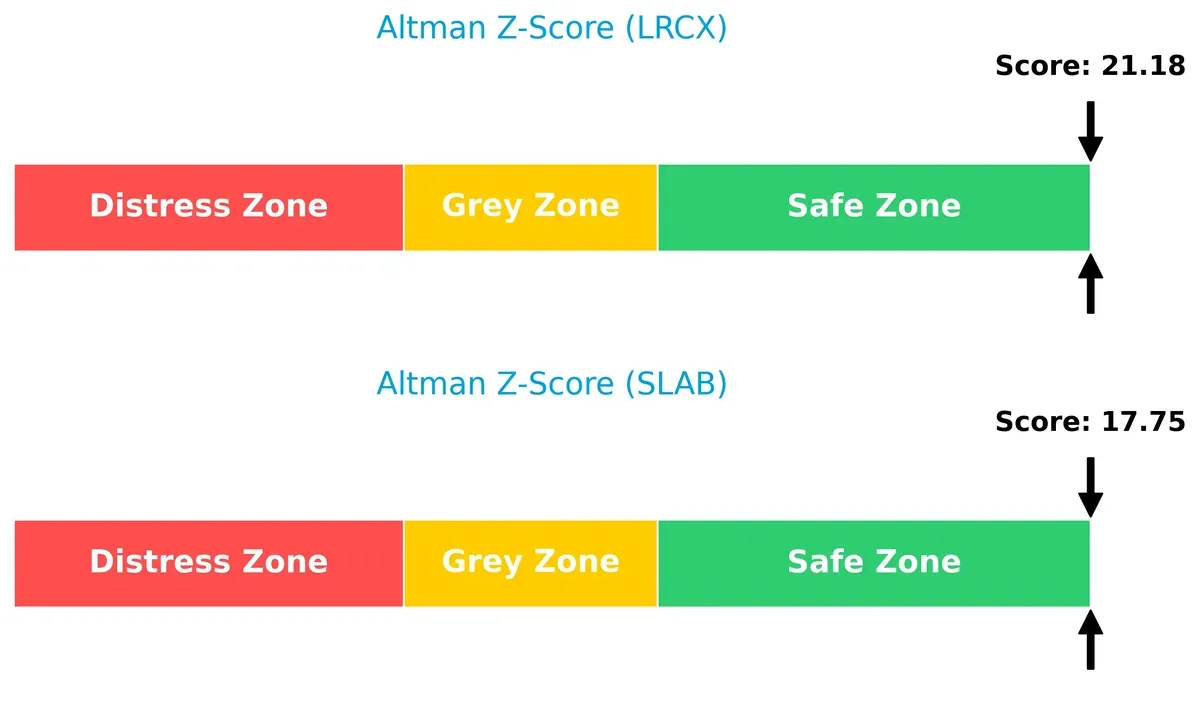
Bankruptcy Risk: Solvency Showdown
Lam Research’s Altman Z-Score (21.18) and Silicon Laboratories’ (17.75) both reside safely above distress thresholds, indicating robust long-term survival prospects in this cycle:
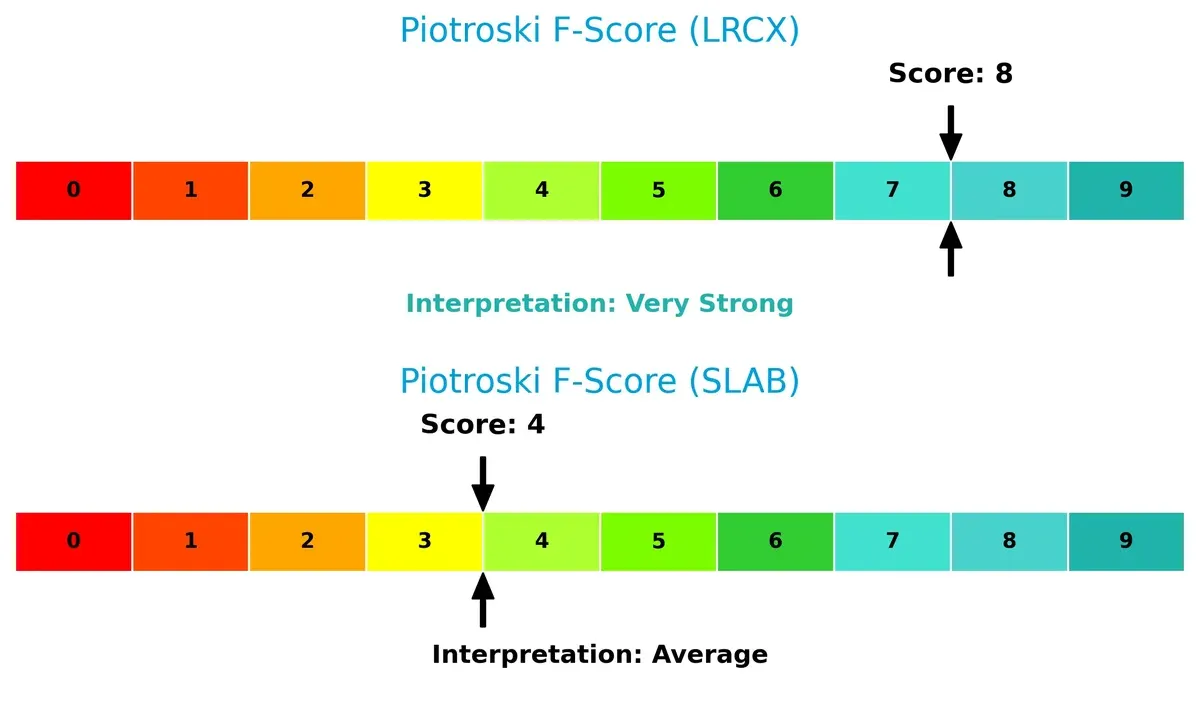
Financial Health: Quality of Operations
Lam Research’s Piotroski F-Score of 8 signals very strong financial health, reflecting solid profitability and balance sheet quality. Silicon Laboratories’ score of 4 is average, hinting at red flags and weaker operational strength relative to its peer:
How are the two companies positioned?
This section dissects the operational DNA of Lam Research and Silicon Labs by comparing their revenue distribution and internal dynamics. The goal is to confront their economic moats to identify which model offers the most resilient competitive advantage today.
Revenue Segmentation: The Strategic Mix
This comparison dissects how Lam Research Corporation and Silicon Laboratories diversify their income streams and where their primary sector bets lie:
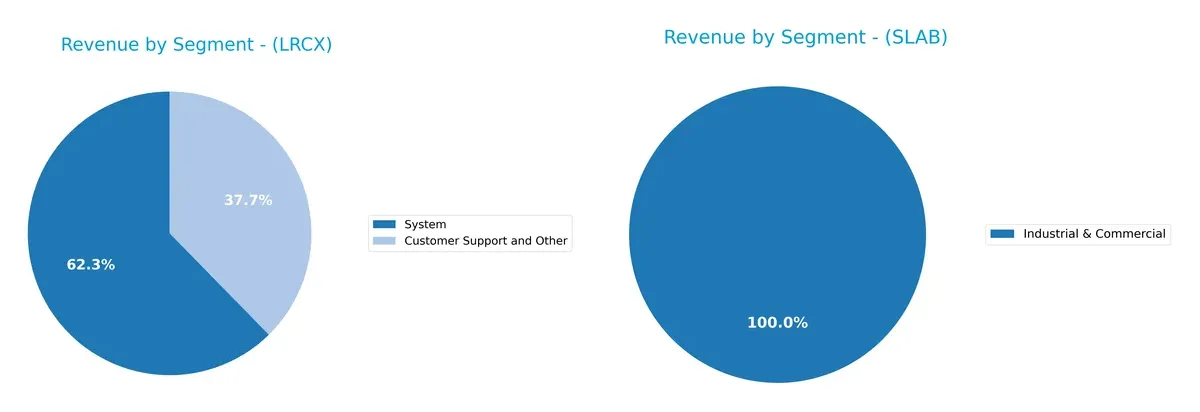
Lam Research anchors revenue heavily in its System segment, generating $11.5B in 2025, dwarfing the $6.9B from Customer Support. This concentration highlights Lam’s infrastructure dominance but also elevates concentration risk. Silicon Laboratories shows a more concentrated recent focus, with $339M in Industrial & Commercial for 2024 and no clear multi-segment diversification, reflecting a narrower but targeted market approach.
Strengths and Weaknesses Comparison
This table compares the Strengths and Weaknesses of Lam Research Corporation and Silicon Laboratories Inc.:
Lam Research Corporation Strengths
- Strong profitability with 29.06% net margin and 54.33% ROE
- Favorable liquidity ratios: current ratio 2.21, quick ratio 1.55
- Low debt levels with debt-to-assets 22.28% and interest coverage 33.43
- Diversified revenue streams in systems and customer support
- Global presence including China, Korea, Taiwan, and US
- Efficient asset use with fixed asset turnover 7.59
Silicon Laboratories Inc. Strengths
- Favorable quick ratio 5.07 indicates strong short-term liquidity
- Very low debt with debt-to-assets 1.27% and debt/equity 0.01
- Favorable fixed asset turnover 4.42 reflects efficient asset utilization
- Diverse end markets including industrial, commercial, automotive, and IoT
- Presence in China, Taiwan, US, and rest of world markets
- Positive P/E ratio status suggesting some investor confidence
Lam Research Corporation Weaknesses
- High weighted average cost of capital (WACC) at 12.09% raises capital costs
- Unfavorable price-to-book ratio 12.69 indicates potential overvaluation
- Dividend yield low at 0.92% compared to sector norms
- Asset turnover moderate at 0.86, limiting sales efficiency
- Exposure to geopolitical risks in China and Asia Pacific markets
Silicon Laboratories Inc. Weaknesses
- Negative profitability metrics: net margin -32.69%, ROE -17.69%, ROIC -14.71%
- Poor interest coverage at -117.18 signals financial distress
- Unfavorable current ratio 6.15 suggests possible asset-liability mismatch
- Price-to-book 3.81 unfavorable, indicating valuation concerns
- No dividend yield, limiting income appeal
- Lower asset turnover 0.48 reflects weaker operational efficiency
Overall, Lam Research demonstrates robust profitability and global diversification but faces valuation and capital cost challenges. Silicon Laboratories shows strong liquidity and asset efficiency in certain areas but struggles with sustained losses and financial health issues. Each company’s strengths and weaknesses will shape their strategic focus going forward.
The Moat Duel: Analyzing Competitive Defensibility
A structural moat is the only true barrier protecting long-term profits from relentless competitive erosion in capital-intensive industries:
Lam Research Corporation: Precision Engineering & Scale Moat
Lam Research’s competitive advantage lies in its advanced semiconductor equipment and scale. This moat shows in a high ROIC exceeding WACC by 22%, and stable 29% net margins. Expansion into new wafer cleaning and deposition technologies in 2026 should deepen its edge.
Silicon Laboratories Inc.: Niche IoT Analog Solutions
Silicon Labs relies on specialized analog and mixed-signal chips for IoT applications, a narrower moat than Lam’s scale advantage. Its ROIC has plunged below WACC, reflecting weak profitability and shrinking margins. Recovery depends on innovation in wireless microcontrollers and sensors.
Scale Dominance vs. Niche Specialization
Lam Research’s wide and growing moat outclasses Silicon Labs’ shrinking and value-destroying position. Lam’s robust capital efficiency and expanding product line better defend market share amid cyclical semiconductor pressures.
Which stock offers better returns?
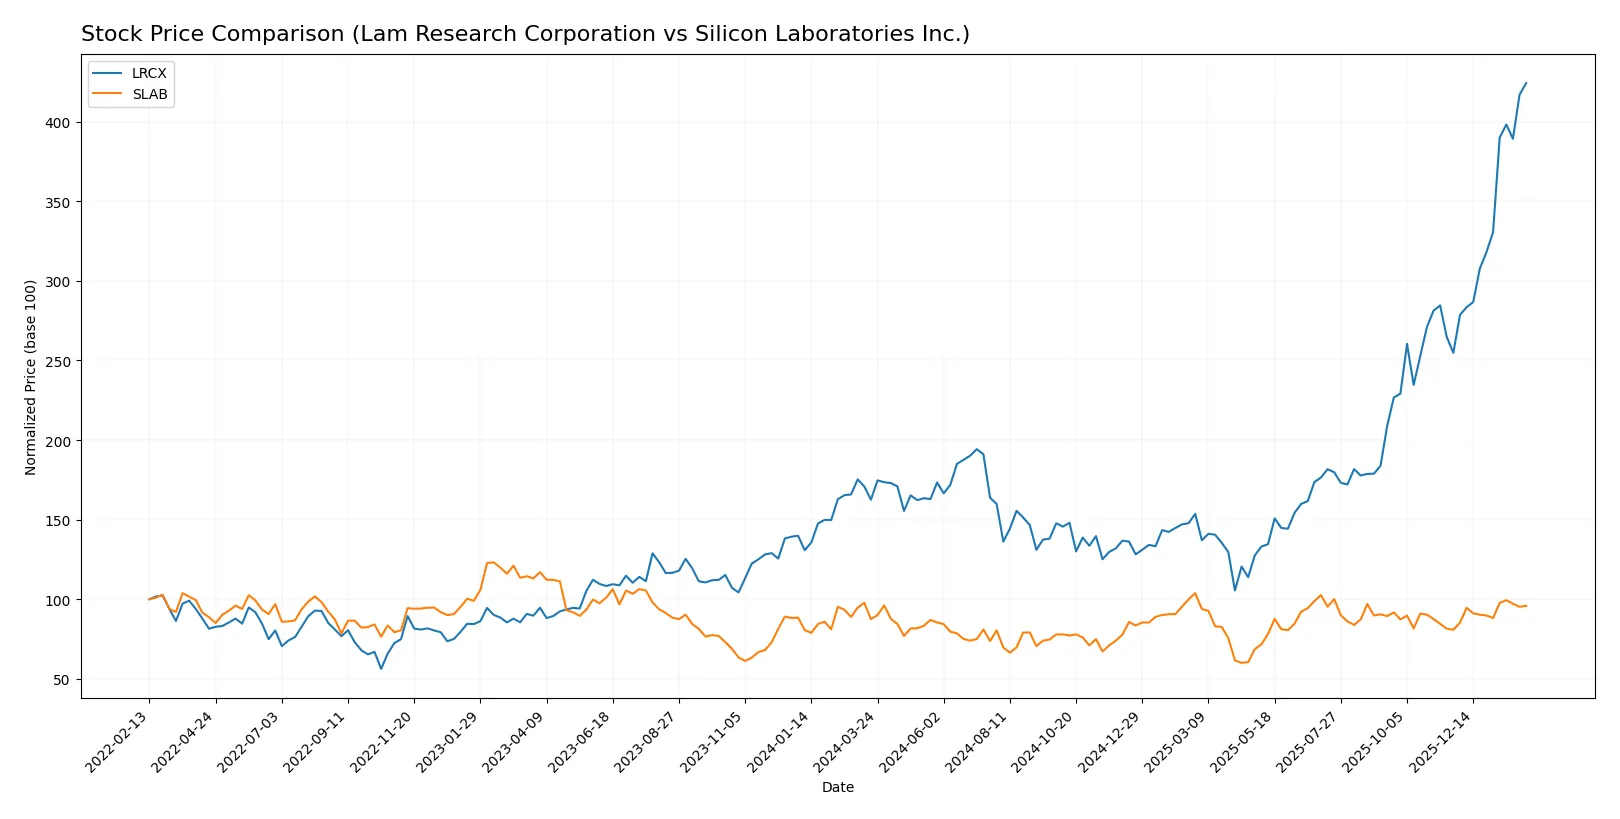
Over the past year, both Lam Research Corporation and Silicon Laboratories Inc. displayed upward price movements, with Lam Research showing a pronounced acceleration in gains and dominant buyer activity.
Trend Comparison
Lam Research Corporation’s stock surged 161% over the last 12 months, marking a strong bullish trend with accelerating momentum and high volatility. Its price ranged from 59.09 to 237.5, reflecting significant upside.
Silicon Laboratories Inc. advanced 9.6% over the same period, also bullish with accelerating gains but far lower volatility. The price moved between 89.82 and 155.33, showing moderate strength.
Lam Research outperformed Silicon Laboratories by a wide margin, delivering substantially higher returns and stronger market participation throughout the year.
Target Prices
Analysts show a positive consensus on Lam Research Corporation and Silicon Laboratories Inc., with targets indicating potential upside.
| Company | Target Low | Target High | Consensus |
|---|---|---|---|
| Lam Research Corporation | 127 | 325 | 266.76 |
| Silicon Laboratories Inc. | 130 | 165 | 151.67 |
Lam Research’s consensus target of 267 USD is roughly 12% above its current price of 237.5 USD, signaling moderate upside. Silicon Laboratories’ 152 USD consensus target suggests an 6% gain over the current price of 143.4 USD.

Don’t Let Luck Decide Your Entry Point
Optimize your entry points with our advanced ProRealTime indicators. You’ll get efficient buy signals with precise price targets for maximum performance. Start outperforming now!
How do institutions grade them?
Lam Research Corporation Grades
Below is a summary of recent grades from major financial institutions for Lam Research Corporation:
| Grading Company | Action | New Grade | Date |
|---|---|---|---|
| UBS | Maintain | Buy | 2026-01-29 |
| Wells Fargo | Maintain | Overweight | 2026-01-29 |
| JP Morgan | Maintain | Overweight | 2026-01-29 |
| RBC Capital | Maintain | Outperform | 2026-01-29 |
| Citigroup | Maintain | Buy | 2026-01-29 |
| Stifel | Maintain | Buy | 2026-01-29 |
| Morgan Stanley | Maintain | Equal Weight | 2026-01-29 |
| Needham | Maintain | Buy | 2026-01-29 |
| Susquehanna | Maintain | Positive | 2026-01-29 |
| Goldman Sachs | Maintain | Buy | 2026-01-29 |
Silicon Laboratories Inc. Grades
The following table summarizes recent grades from financial institutions for Silicon Laboratories Inc.:
| Grading Company | Action | New Grade | Date |
|---|---|---|---|
| Morgan Stanley | Maintain | Equal Weight | 2025-08-06 |
| Susquehanna | Maintain | Neutral | 2025-08-06 |
| Barclays | Maintain | Equal Weight | 2025-08-05 |
| Susquehanna | Maintain | Neutral | 2025-07-22 |
| Stifel | Maintain | Buy | 2025-07-18 |
| Keybanc | Maintain | Overweight | 2025-07-08 |
| Benchmark | Maintain | Buy | 2025-05-27 |
| Benchmark | Maintain | Buy | 2025-05-14 |
| Needham | Maintain | Buy | 2025-05-14 |
| Susquehanna | Maintain | Neutral | 2025-05-14 |
Which company has the best grades?
Lam Research holds generally stronger grades, including multiple “Buy” and “Outperform” ratings from top-tier banks. Silicon Laboratories has a mix of “Buy,” “Equal Weight,” and “Neutral” ratings, reflecting more cautious sentiment. Investors may view Lam Research’s broader institutional support as a sign of higher confidence.
Risks specific to each company
The following categories identify the critical pressure points and systemic threats facing both firms in the 2026 market environment:
1. Market & Competition
Lam Research Corporation (LRCX)
- Dominates in semiconductor equipment with global scale and strong R&D, facing intense competition from peers and technology shifts.
Silicon Laboratories Inc. (SLAB)
- Operates fabless model focusing on analog/mixed-signal IoT solutions, challenged by rapid innovation and larger players in wireless microcontrollers.
2. Capital Structure & Debt
Lam Research Corporation (LRCX)
- Maintains moderate leverage (D/E 0.48) with strong interest coverage (33.43x), indicating solid financial stability.
Silicon Laboratories Inc. (SLAB)
- Extremely low debt (D/E 0.01) but negative interest coverage hints at operating losses and potential liquidity stress.
3. Stock Volatility
Lam Research Corporation (LRCX)
- Beta at 1.78 signals above-market volatility typical for semiconductors but supported by strong fundamentals.
Silicon Laboratories Inc. (SLAB)
- Beta at 1.54 shows elevated volatility coupled with weaker financial performance increases risk for investors.
4. Regulatory & Legal
Lam Research Corporation (LRCX)
- Subject to global trade regulations and export controls, particularly with exposure to China semiconductor markets.
Silicon Laboratories Inc. (SLAB)
- Faces regulatory scrutiny in IoT security standards and export rules; smaller scale may limit impact but remains a concern.
5. Supply Chain & Operations
Lam Research Corporation (LRCX)
- Complex global supply chain with exposure to semiconductor material shortages and geopolitical tensions.
Silicon Laboratories Inc. (SLAB)
- Relies on third-party foundries and component suppliers, vulnerable to supply disruptions and cost inflation.
6. ESG & Climate Transition
Lam Research Corporation (LRCX)
- Increasing pressure to reduce carbon footprint in manufacturing and improve sustainability practices.
Silicon Laboratories Inc. (SLAB)
- Growing need to align product design with energy efficiency and environmental regulations.
7. Geopolitical Exposure
Lam Research Corporation (LRCX)
- Significant exposure to US-China tensions affecting sales and supply chain resilience.
Silicon Laboratories Inc. (SLAB)
- Moderate exposure through international sales and reliance on global partners, but less geopolitical risk due to smaller footprint.
Which company shows a better risk-adjusted profile?
Lam Research faces notable geopolitical and regulatory risks but demonstrates superior financial health and operational scale. Silicon Laboratories struggles with profitability and liquidity, increasing its risk profile despite lower leverage. The severe negative margins and interest coverage at Silicon Labs highlight urgent financial distress. Lam’s Altman Z-score (21.18) and Piotroski score (8) confirm strong financial stability, while Silicon Labs shows weaker scores (Z-score 17.75, Piotroski 4). Overall, Lam Research offers a more resilient and better risk-adjusted investment profile in 2026.
Final Verdict: Which stock to choose?
Lam Research Corporation’s superpower lies in its robust capital efficiency and durable competitive advantage. Its consistently high ROIC well above WACC signals strong value creation and operational excellence. A point of vigilance remains its premium valuation multiples. It suits portfolios aiming for Aggressive Growth with a tolerance for valuation risk.
Silicon Laboratories Inc. offers a strategic moat centered on advanced R&D capabilities, yet struggles with profitability and capital returns. Its safety profile trails Lam Research significantly due to negative margins and deteriorating ROIC trends. It appears more aligned with speculative or turnaround-focused portfolios willing to absorb elevated uncertainty.
If you prioritize sustained value creation and proven financial strength, Lam Research outshines as the compelling choice due to its durable moat and solid profitability metrics. However, if you seek high-risk, high-reward exposure in emerging technology niches, Silicon Labs offers a speculative avenue despite its financial headwinds. Analytical scenarios favor Lam Research for stability and growth, while Silicon Labs remains a cautionary play.
Disclaimer: Investment carries a risk of loss of initial capital. The past performance is not a reliable indicator of future results. Be sure to understand risks before making an investment decision.
Go Further
I encourage you to read the complete analyses of Lam Research Corporation and Silicon Laboratories Inc. to enhance your investment decisions: