Home > Comparison > Technology > LRCX vs ONTO
The strategic rivalry between Lam Research Corporation and Onto Innovation Inc. shapes the semiconductor sector’s technological frontier. Lam Research operates as a capital-intensive industrial powerhouse, manufacturing advanced wafer fabrication equipment. Onto Innovation focuses on high-precision process control tools and software, targeting yield and defect management. This analysis pits scale and manufacturing depth against specialized innovation to identify which trajectory offers superior risk-adjusted returns for a diversified portfolio.
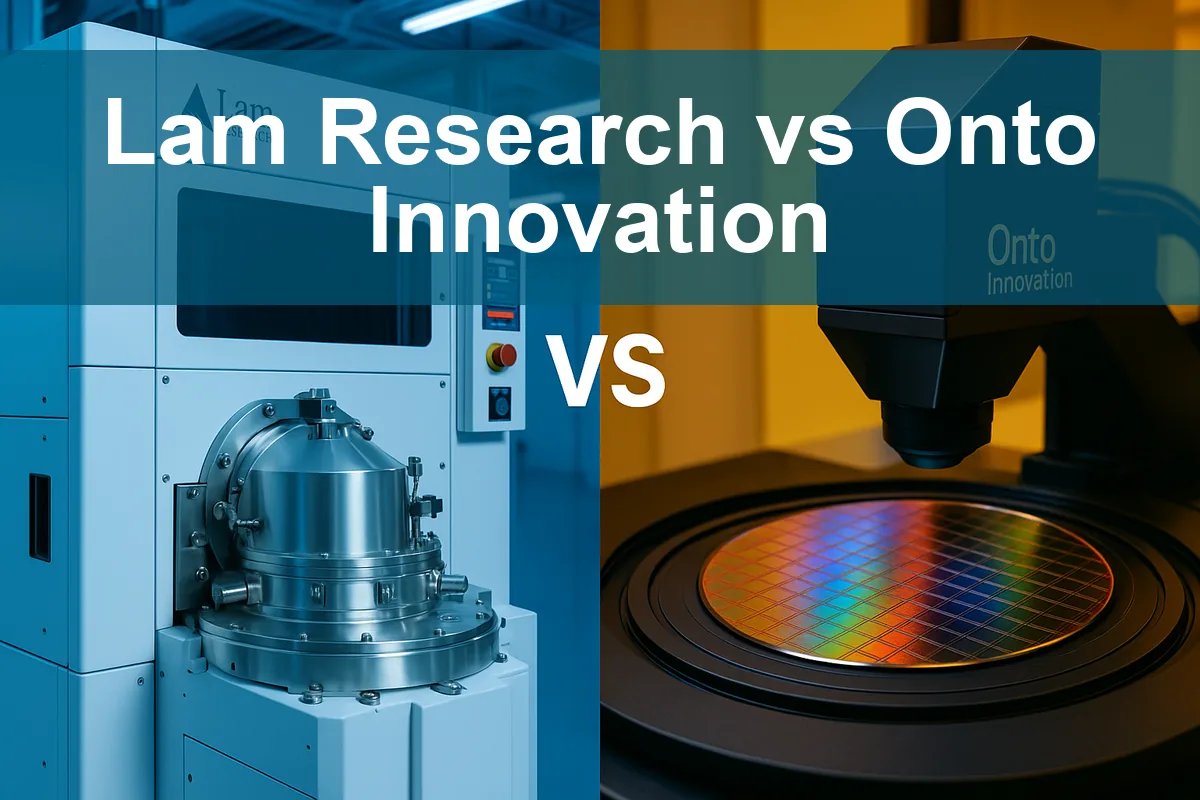
Table of contents
Companies Overview
Lam Research Corporation and Onto Innovation Inc. stand as pivotal players in the semiconductor equipment and process control markets.
Lam Research Corporation: Semiconductor Equipment Powerhouse
Lam Research Corporation dominates the semiconductor equipment industry by designing and manufacturing processing tools essential for integrated circuit fabrication. Its core revenue stems from advanced systems like ALTUS for tungsten metallization and VECTOR for plasma-enhanced deposition. In 2026, Lam focuses strategically on expanding high-precision deposition and etch technologies, reinforcing its competitive advantage in semiconductor manufacturing.
Onto Innovation Inc.: Process Control Specialist
Onto Innovation Inc. leads in process control tools that inspect defects and conduct 2D/3D optical metrology for semiconductor and advanced packaging devices. The company generates revenue through inspection systems, lithography, and analytical software solutions. Its 2026 strategy emphasizes enhancing process control software and yield management to support complex device manufacturing and improve factory-wide efficiency.
Strategic Collision: Similarities & Divergences
Both firms operate in semiconductors but diverge sharply in focus: Lam Research prioritizes equipment manufacturing while Onto Innovation excels in process control and analytics. The primary battleground lies in supporting semiconductor fabs—Lam with hardware, Onto with inspection and software. Their investment profiles differ; Lam offers scale and manufacturing backbone, Onto delivers niche expertise in yield optimization.
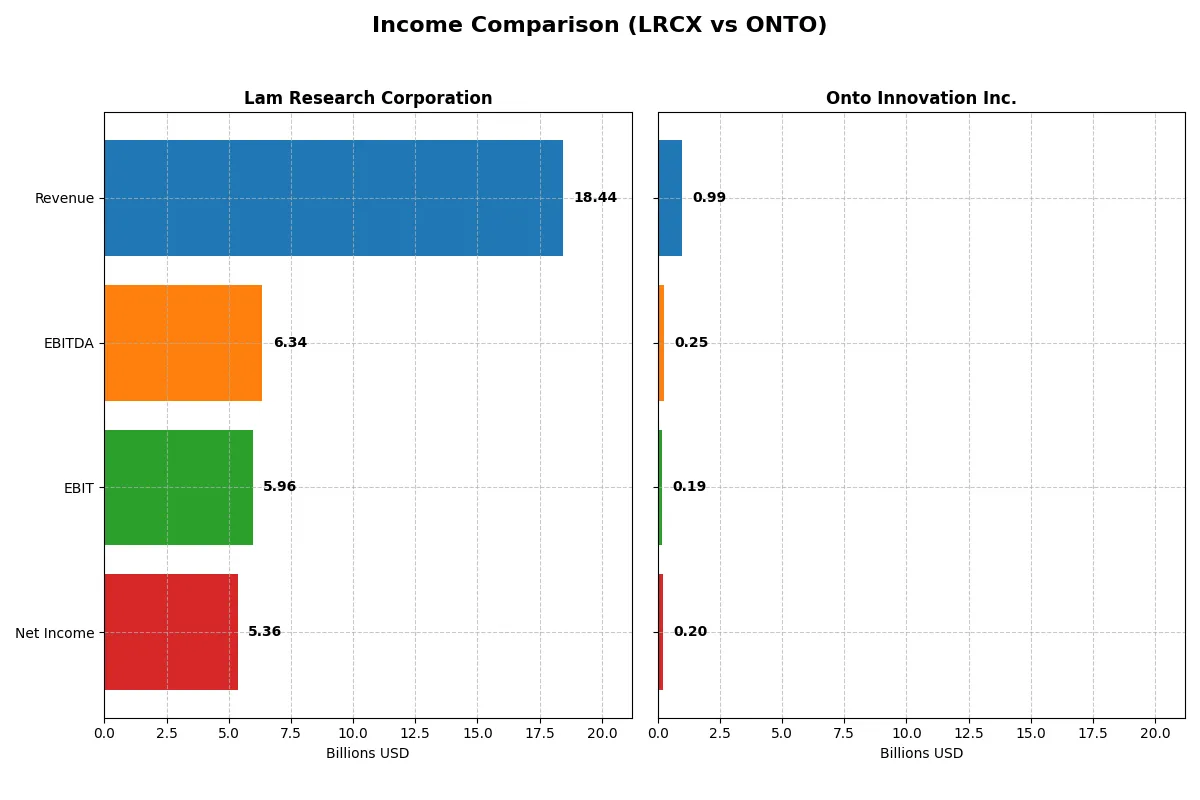
Income Statement Comparison
This data dissects the core profitability and scalability of both corporate engines to reveal who dominates the bottom line:
| Metric | Lam Research Corporation (LRCX) | Onto Innovation Inc. (ONTO) |
|---|---|---|
| Revenue | 18.4B | 987M |
| Cost of Revenue | 9.46B | 472M |
| Operating Expenses | 3.08B | 328M |
| Gross Profit | 8.98B | 515M |
| EBITDA | 6.34B | 249M |
| EBIT | 5.96B | 187M |
| Interest Expense | 178M | 0 |
| Net Income | 5.36B | 202M |
| EPS | 4.17 | 4.09 |
| Fiscal Year | 2025 | 2024 |
Income Statement Analysis: The Bottom-Line Duel
This income statement comparison reveals the true efficiency and growth dynamics powering each company’s financial engine.
Lam Research Corporation Analysis
Lam Research’s revenue rose from $14.9B in 2024 to $18.4B in 2025, a 24% jump, driving a 40% net income surge to $5.36B. Gross margin holds strong at 48.7%, with a healthy net margin near 29%. Its operating efficiency accelerated in 2025, reflecting disciplined cost control and robust R&D investment.
Onto Innovation Inc. Analysis
Onto Innovation’s revenue climbed 21% to $987M in 2024, with net income rising 66% to $202M. The company boasts a higher gross margin of 52.2%, though net margin is lower at 20.4%. Recent momentum is impressive, with EBIT growth exceeding 60%, signaling improving operational leverage despite smaller scale.
Scale Dominance vs. Growth Momentum
Lam Research dominates in absolute scale and margin breadth, delivering consistent profitability and margin expansion. Onto Innovation impresses with rapid growth and margin improvement but remains a smaller player. Investors seeking stability may prefer Lam’s proven scale; those favoring growth might eye Onto’s accelerating momentum.
Financial Ratios Comparison
These vital ratios act as a diagnostic tool to expose the underlying fiscal health, valuation premiums, and capital efficiency of each company:
| Ratios | Lam Research (LRCX) | Onto Innovation (ONTO) |
|---|---|---|
| ROE | 54.3% | 10.5% |
| ROIC | 34.0% | 8.8% |
| P/E | 23.4 | 41.8 |
| P/B | 12.7 | 4.37 |
| Current Ratio | 2.21 | 8.69 |
| Quick Ratio | 1.55 | 7.00 |
| D/E | 0.48 | 0.008 |
| Debt-to-Assets | 22.3% | 0.7% |
| Interest Coverage | 33.1 | 0 |
| Asset Turnover | 0.86 | 0.47 |
| Fixed Asset Turnover | 7.59 | 7.16 |
| Payout ratio | 21.5% | 0% |
| Dividend yield | 0.92% | 0% |
| Fiscal Year | 2025 | 2024 |
Efficiency & Valuation Duel: The Vital Signs
Financial ratios act as the company’s DNA, exposing hidden risks and operational excellence that guide savvy investment decisions.
Lam Research Corporation
Lam Research posts a robust 54.33% ROE and a strong 29.06% net margin, signaling exceptional profitability and operational efficiency. Its P/E ratio of 23.36 appears reasonable relative to its returns, though a high P/B of 12.69 suggests some valuation stretch. Lam returns value through a modest 0.92% dividend yield, balancing shareholder rewards with reinvestment in R&D at 11.37% of revenue.
Onto Innovation Inc.
Onto Innovation shows moderate profitability with a 10.47% ROE and a 20.43% net margin, reflecting operational challenges versus Lam. Its elevated P/E of 41.76 flags a stretched valuation, compounded by a high current ratio of 8.69 which may indicate inefficient capital use. Onto pays no dividend, opting instead to fuel growth through significant R&D spending at 11.83% of revenue.
Premium Valuation vs. Operational Safety
Lam Research offers superior profitability and a balanced valuation, presenting a favorable risk-reward profile. Onto Innovation’s high valuation and weaker returns suggest greater risk and reliance on growth prospects. Investors prioritizing operational strength may lean toward Lam, while those seeking growth might consider Onto’s profile.
Which one offers the Superior Shareholder Reward?
Lam Research (LRCX) and Onto Innovation (ONTO) differ sharply in shareholder reward strategies. LRCX pays a modest dividend yield near 0.9%, backed by a sustainable payout ratio around 21-27%, and aggressively repurchases shares, enhancing total returns. In contrast, ONTO pays no dividends, focusing free cash flow on R&D and growth, with no buyback activity reported. LRCX’s combination of dividends and buybacks delivers steady income and capital appreciation, supported by strong free cash flow coverage ratios above 3x. ONTO’s high valuation multiples suggest growth expectations, but lack of distributions and heavy reinvestment raises risk. I conclude LRCX offers a superior, more balanced total return profile for 2026 investors seeking both income and growth stability.
Comparative Score Analysis: The Strategic Profile
The radar chart reveals the fundamental DNA and trade-offs of Lam Research Corporation and Onto Innovation Inc., highlighting their core financial strengths and weaknesses:
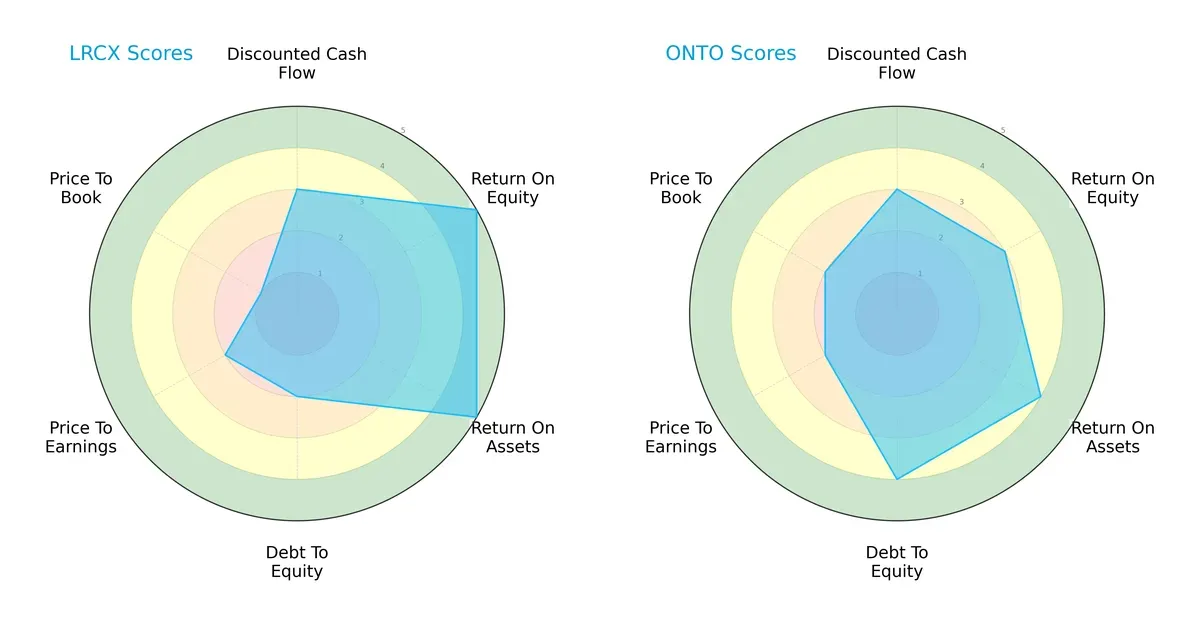
Lam Research excels in profitability metrics with top ROE and ROA scores (5 each), signaling superior asset utilization and equity returns. Onto Innovation posts a more balanced debt-to-equity score (4 vs. 2 for Lam), indicating stronger financial stability. Both firms share moderate DCF and P/E scores, but Lam’s substantially weaker price-to-book score (1 vs. 2) suggests valuation concerns. Overall, Lam leans heavily on operational efficiency, while Onto maintains steadier leverage control.
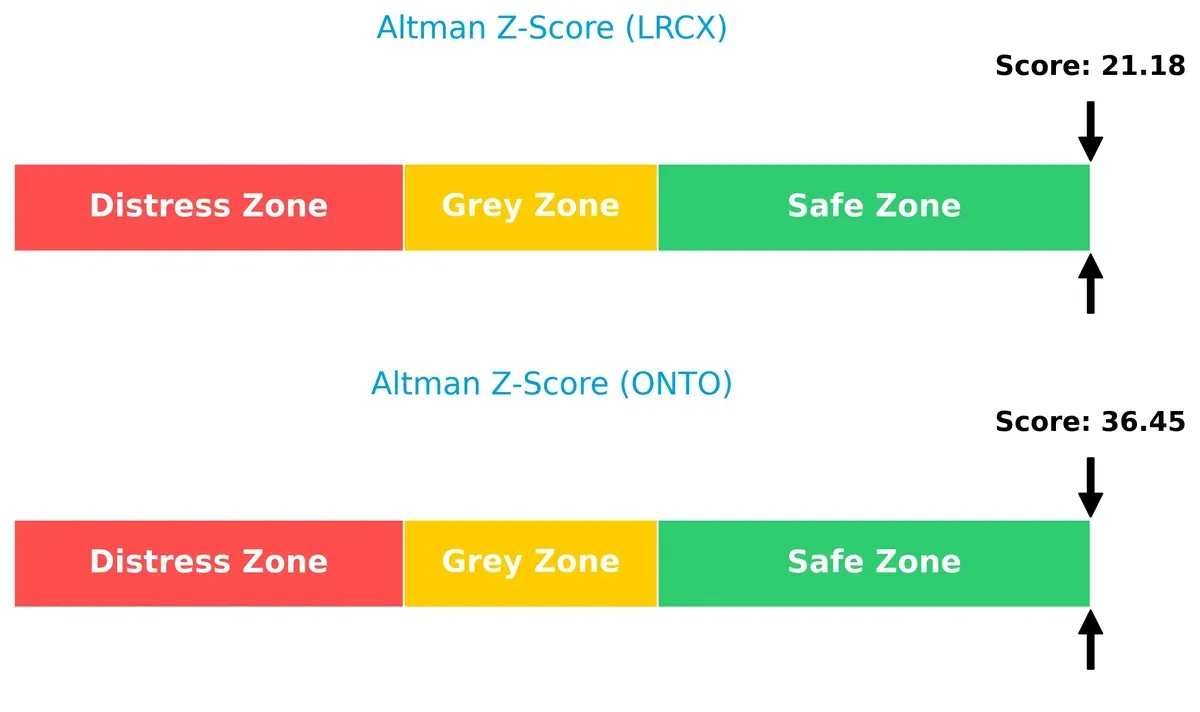
Bankruptcy Risk: Solvency Showdown
The Altman Z-Scores place both companies firmly in the safe zone, with Onto leading at 36.45 versus Lam’s 21.18, confirming excellent long-term solvency under current market conditions:
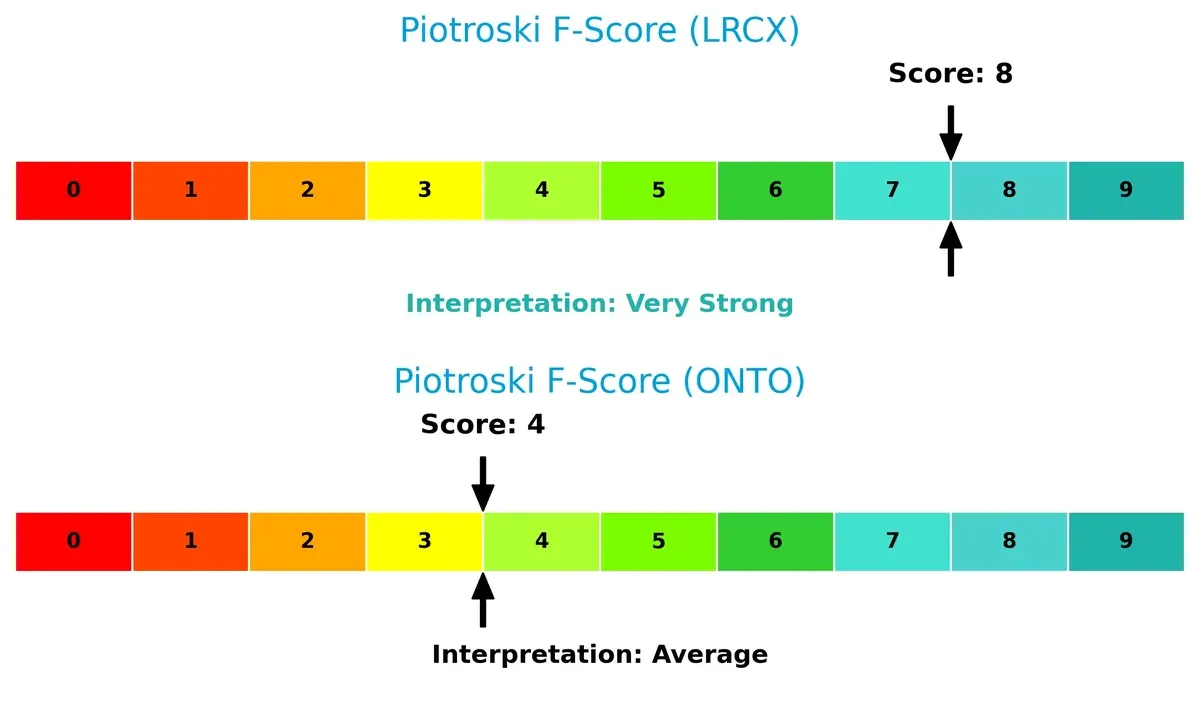
Financial Health: Quality of Operations
Lam Research’s Piotroski F-Score of 8 signals very strong financial health, reflecting robust profitability and operational strength. Onto’s score of 4 is average, raising caution about its internal financial consistency compared to Lam:
How are the two companies positioned?
This section dissects Lam Research and Onto Innovation’s operational DNA by comparing revenue distribution and internal dynamics. The goal is to confront their economic moats and reveal which model offers the most resilient competitive advantage today.
Revenue Segmentation: The Strategic Mix
This visual comparison dissects how Lam Research Corporation and Onto Innovation Inc. diversify their income streams and where their primary sector bets lie:
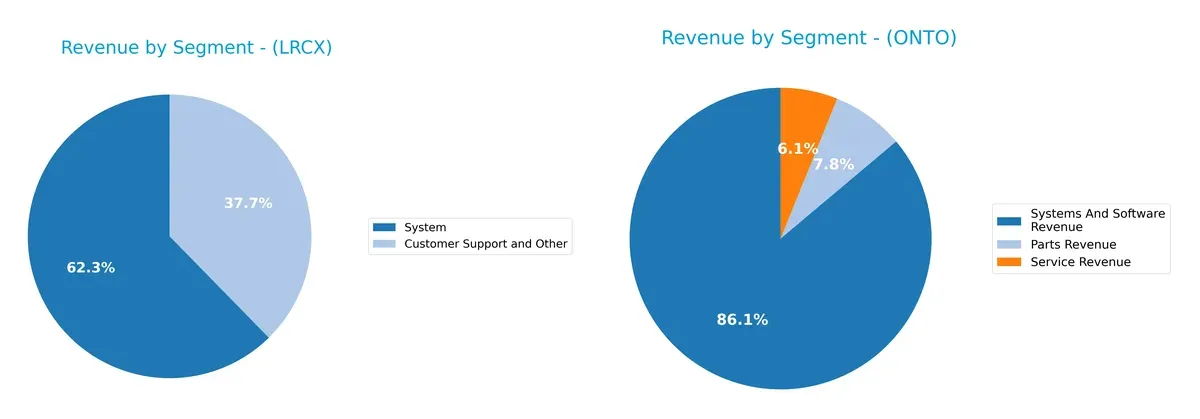
Lam Research anchors its revenue in two robust segments: Systems at $11.5B and Customer Support near $6.9B in 2025, showing a balanced reliance. Onto Innovation pivots heavily on Systems and Software Revenue, which dwarfs its Parts and Service revenues, totaling $850M versus $76M and $60M respectively. Lam’s dual-segment strength suggests ecosystem lock-in, while Onto’s concentration exposes it to product cycle risks despite niche focus.
Strengths and Weaknesses Comparison
This table compares the strengths and weaknesses of Lam Research Corporation and Onto Innovation Inc.:
Lam Research Corporation Strengths
- Strong profitability with net margin 29.06% and ROE 54.33%
- Favorable liquidity ratios with current ratio 2.21 and quick ratio 1.55
- Moderate debt levels with debt-to-assets 22.28% and interest coverage 33.43
- High fixed asset turnover 7.59 indicating efficient asset use
- Significant global presence with diversified geographic revenue across China, Korea, Taiwan, US
- Leading market share in semiconductor systems segment
Onto Innovation Inc. Strengths
- Favorable net margin 20.43% with low debt-to-assets 0.72%
- Excellent interest coverage with infinite ratio and quick ratio 7.0
- Strong fixed asset turnover 7.16 showing operational efficiency
- Geographic diversification with revenues in China, Taiwan, Korea, US, Japan
- Growing systems and software revenue segment reaching $850M in 2024
- Low debt-equity ratio 0.01 supporting balance sheet strength
Lam Research Corporation Weaknesses
- Unfavorable weighted average cost of capital (12.09%) exceeding ROIC
- High price-to-book ratio 12.69 may indicate overvaluation risk
- Dividend yield low at 0.92% limiting income appeal
- Neutral asset turnover at 0.86 suggests room for improvement in asset use
- Moderate dependence on Asia Pacific markets including China
Onto Innovation Inc. Weaknesses
- Unfavorable weighted average cost of capital 10.72% above ROIC of 8.77%
- High price-to-earnings ratio 41.76 and price-to-book 4.37 raise valuation concerns
- Unfavorable current ratio 8.69 may indicate inefficient working capital or risk
- Lower asset turnover 0.47 signals less efficient use of assets
- Zero dividend yield reducing appeal to income investors
Lam Research exhibits robust profitability and efficient asset use, but valuation and capital cost pose risks. Onto Innovation shows operational efficiency and low leverage, yet faces challenges in valuation and working capital management. Both must balance growth ambitions with financial prudence amid sector cyclicality.
The Moat Duel: Analyzing Competitive Defensibility
A structural moat is the only reliable shield protecting long-term profits from relentless competition erosion. Let’s dissect the sources of competitive advantage for both firms:
Lam Research Corporation: Precision Engineering with Scale Economies
Lam’s moat centers on cost advantage and advanced intangible assets in semiconductor equipment. This translates into a high ROIC 22% above WACC and stable margins near 30%. Expansion into new wafer-cleaning technologies in 2026 should deepen its durable moat.
Onto Innovation Inc.: Innovation-Driven Niche Specialization
Onto’s moat relies on specialized process control tools and metrology software, distinct from Lam’s scale-focused advantage. Despite a negative ROIC spread indicating value destruction, its accelerating profitability signals improving competitiveness. Growth in advanced packaging markets could disrupt its trajectory.
Scale Economies vs. Niche Innovation: Who Defends Better?
Lam Research commands a wider and deeper moat with sustained value creation and margin strength. Onto’s improving metrics hint at potential but insufficient to rival Lam’s entrenched market position. Lam stands better equipped to defend and expand its semiconductor dominance.
Which stock offers better returns?
Over the past 12 months, Lam Research and Onto Innovation displayed strong upward price movements with accelerating trends and increasing trading volumes, highlighting dynamic market activity.
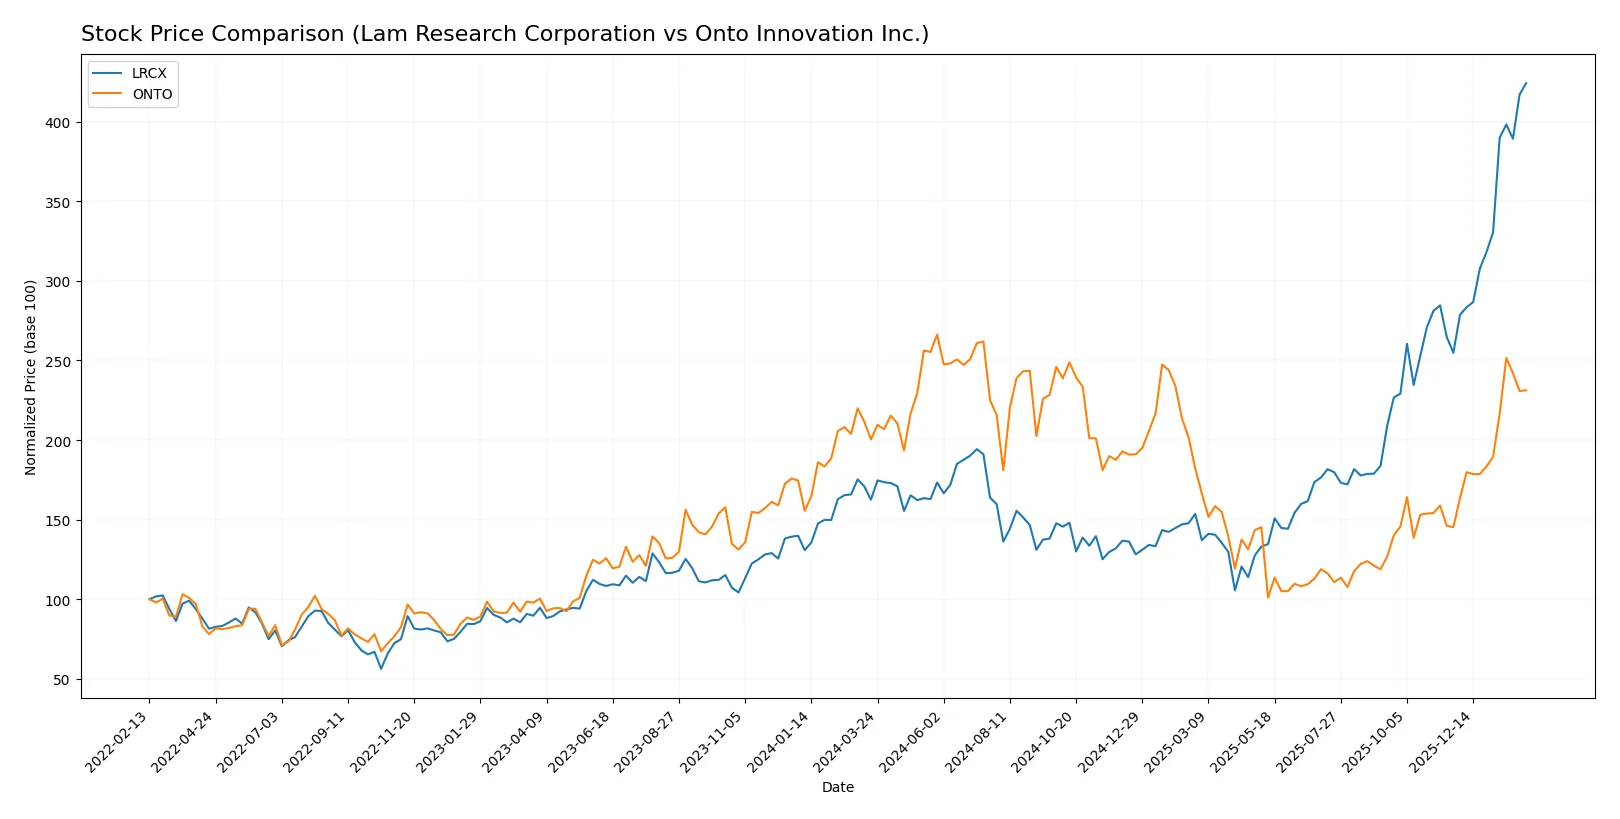
Trend Comparison
Lam Research’s stock surged 161% over the past year, showing a bullish trend with accelerating momentum. It hit a high of 237.5 and a low of 59.09, evidencing significant volatility (std dev 39.19).
Onto Innovation rose 15.4% in the same period, also bullish with acceleration. Its price ranged from 88.5 to 233.14, reflecting higher volatility (std dev 43.12), but with more moderate gains than Lam Research.
Lam Research outperformed Onto Innovation by a wide margin in market returns, delivering the highest price appreciation and stronger buyer dominance throughout the year.
Target Prices
Analysts present a cautiously optimistic consensus for both Lam Research Corporation and Onto Innovation Inc.
| Company | Target Low | Target High | Consensus |
|---|---|---|---|
| Lam Research Corporation | 127 | 325 | 266.76 |
| Onto Innovation Inc. | 160 | 260 | 191.67 |
Lam Research’s consensus target stands 12% above its current 237.5 price, signaling moderate upside. Onto Innovation’s consensus target is slightly below its 202.43 price, suggesting limited near-term appreciation.

Don’t Let Luck Decide Your Entry Point
Optimize your entry points with our advanced ProRealTime indicators. You’ll get efficient buy signals with precise price targets for maximum performance. Start outperforming now!
How do institutions grade them?
Lam Research Corporation Grades
The following table shows recent institutional grades for Lam Research Corporation:
| Grading Company | Action | New Grade | Date |
|---|---|---|---|
| UBS | Maintain | Buy | 2026-01-29 |
| Wells Fargo | Maintain | Overweight | 2026-01-29 |
| JP Morgan | Maintain | Overweight | 2026-01-29 |
| RBC Capital | Maintain | Outperform | 2026-01-29 |
| Citigroup | Maintain | Buy | 2026-01-29 |
| Stifel | Maintain | Buy | 2026-01-29 |
| Morgan Stanley | Maintain | Equal Weight | 2026-01-29 |
| Needham | Maintain | Buy | 2026-01-29 |
| Susquehanna | Maintain | Positive | 2026-01-29 |
| Goldman Sachs | Maintain | Buy | 2026-01-29 |
Onto Innovation Inc. Grades
The following table shows recent institutional grades for Onto Innovation Inc.:
| Grading Company | Action | New Grade | Date |
|---|---|---|---|
| Needham | Maintain | Buy | 2026-01-20 |
| B. Riley Securities | Maintain | Buy | 2026-01-15 |
| Stifel | Maintain | Hold | 2026-01-14 |
| Needham | Maintain | Buy | 2026-01-06 |
| Jefferies | Maintain | Buy | 2025-12-15 |
| Needham | Maintain | Buy | 2025-11-18 |
| B. Riley Securities | Maintain | Buy | 2025-11-18 |
| Evercore ISI Group | Maintain | Outperform | 2025-11-05 |
| Oppenheimer | Maintain | Outperform | 2025-10-14 |
| Stifel | Maintain | Hold | 2025-10-13 |
Which company has the best grades?
Lam Research Corporation holds more consistent Buy and Outperform grades from top-tier institutions than Onto Innovation. This may signal stronger market confidence and could influence investor sentiment positively. Onto Innovation’s mixed Hold and Buy ratings suggest more varied analyst opinions, reflecting higher uncertainty.
Risks specific to each company
The following categories identify the critical pressure points and systemic threats facing both Lam Research Corporation and Onto Innovation Inc. in the 2026 market environment:
1. Market & Competition
Lam Research Corporation
- Dominates semiconductor equipment with strong market cap and innovation leadership.
Onto Innovation Inc.
- Smaller market cap with niche focus, facing intense competition and market share pressure.
2. Capital Structure & Debt
Lam Research Corporation
- Maintains moderate debt levels (D/E 0.48) with strong interest coverage, balancing growth and risk.
Onto Innovation Inc.
- Nearly debt-free (D/E 0.01), minimizing financial risk but potentially limiting leverage benefits.
3. Stock Volatility
Lam Research Corporation
- High beta (1.779) signals greater sensitivity to market swings and elevated volatility risk.
Onto Innovation Inc.
- Moderately high beta (1.461) indicates volatility but less than Lam Research’s exposure.
4. Regulatory & Legal
Lam Research Corporation
- Faces complex international regulations given broad global footprint, increasing compliance costs.
Onto Innovation Inc.
- Smaller scale reduces regulatory complexity but still exposed to semiconductor export controls.
5. Supply Chain & Operations
Lam Research Corporation
- Large scale provides supply chain resilience but also complexity exposure to geopolitical disruptions.
Onto Innovation Inc.
- Limited scale may cause vulnerability to supply shocks and operational inefficiencies.
6. ESG & Climate Transition
Lam Research Corporation
- Must invest heavily in ESG initiatives to meet sector standards and investor expectations.
Onto Innovation Inc.
- ESG efforts less mature, posing reputational risks amid increasing investor scrutiny.
7. Geopolitical Exposure
Lam Research Corporation
- Extensive global sales, especially in Asia, expose it to trade tensions and tariffs.
Onto Innovation Inc.
- More limited international exposure but still vulnerable to US-China semiconductor tensions.
Which company shows a better risk-adjusted profile?
Lam Research’s most impactful risk is its high stock volatility and geopolitical exposure given its size and global reach. Onto Innovation’s key risk lies in its limited scale and market competition, restricting growth leverage. Despite Lam’s volatility, its robust financial health, strong interest coverage, and diversified operations deliver a better risk-adjusted profile. Onto’s neutral financial ratios and higher P/E ratio suggest less margin for error. Lam Research’s Altman Z-Score of 21.18 and Piotroski score of 8 show superior financial strength compared to Onto’s Z-Score of 36.45 but weaker Piotroski score of 4, highlighting operational caution.
Final Verdict: Which stock to choose?
Lam Research Corporation’s superpower lies in its exceptional capital efficiency and consistent value creation. Its robust ROIC well above WACC signals a durable moat and rising profitability. A point of vigilance remains its relatively high price-to-book ratio, which could temper near-term valuation appeal. It suits portfolios seeking Aggressive Growth with a strong quality tilt.
Onto Innovation Inc. leverages a niche strategic moat through innovation and a solid recurring revenue base. It offers greater balance sheet safety with minimal debt and high liquidity, though its current returns trail Lam’s by a wide margin. Onto fits well in a GARP portfolio, appealing to investors prioritizing steady growth with moderate risk.
If you prioritize superior capital allocation and proven value creation, Lam Research outshines as the compelling choice due to its durable competitive advantage and scalable profitability. However, if you seek better balance sheet safety and steady growth at a reasonable premium, Onto Innovation offers superior financial stability and innovation-driven upside. Both present distinct analytical scenarios tailored to different investor profiles.
Disclaimer: Investment carries a risk of loss of initial capital. The past performance is not a reliable indicator of future results. Be sure to understand risks before making an investment decision.
Go Further
I encourage you to read the complete analyses of Lam Research Corporation and Onto Innovation Inc. to enhance your investment decisions: