Home > Comparison > Technology > LRCX vs ON
The strategic rivalry between Lam Research Corporation and ON Semiconductor Corporation shapes the future of the semiconductor industry. Lam Research operates as a capital-intensive equipment manufacturer specializing in wafer fabrication, while ON Semiconductor focuses on intelligent sensing and power solutions with broad end-market applications. This head-to-head highlights a contrast between high-precision manufacturing and diversified semiconductor product innovation. This analysis will clarify which company offers a superior risk-adjusted return for a balanced investment portfolio.
Table of contents
Companies Overview
Lam Research and ON Semiconductor dominate distinct niches within the semiconductor sector, shaping innovation and market dynamics.
Lam Research Corporation: Semiconductor Equipment Specialist
Lam Research commands the semiconductor equipment market with a focus on fabrication tools for integrated circuits. Its revenue stems from selling and servicing advanced wafer processing products like plasma etchers and deposition systems. In 2026, Lam prioritizes refining high-precision etching and deposition technologies to boost chip performance and manufacturing efficiency globally.
ON Semiconductor Corporation: Intelligent Power Solutions Leader
ON Semiconductor excels in power and sensing semiconductors that enable automotive electrification and sustainable energy solutions. It generates income through analog, mixed-signal, and power management products across automotive, industrial, and consumer markets. Its 2026 strategy centers on advancing intelligent power technologies to support electric vehicles and renewable energy infrastructure.
Strategic Collision: Similarities & Divergences
Both firms drive semiconductor innovation but differ fundamentally: Lam invests in closed-system fabrication equipment, while ON embraces an open, diversified product portfolio in power and sensing. Their primary battleground lies in enabling next-gen electronics—Lam with chip manufacturing tools, ON with end-device components. This divergence creates distinct risk-reward profiles for investors focused on manufacturing machinery versus semiconductor applications.
Income Statement Comparison
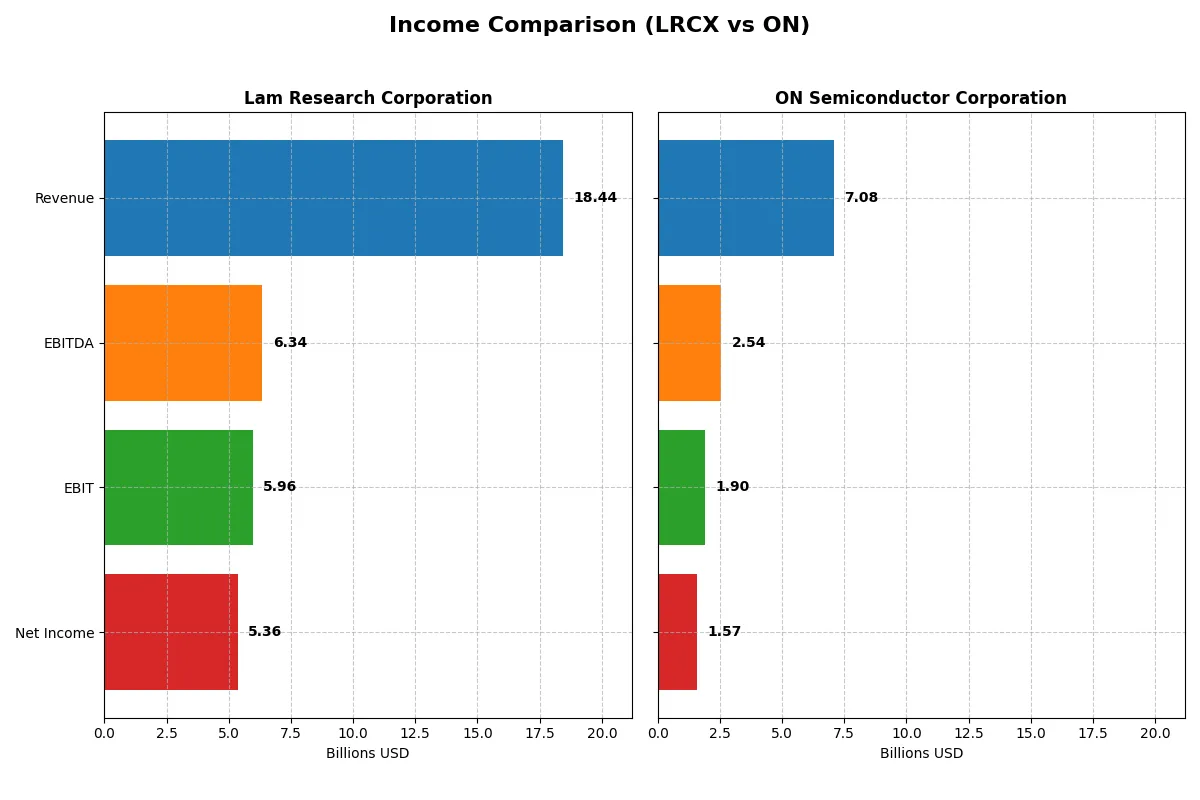
This table dissects the core profitability and scalability of both corporate engines to reveal who dominates the bottom line in the most recent fiscal year:
| Metric | Lam Research Corporation (LRCX) | ON Semiconductor Corporation (ON) |
|---|---|---|
| Revenue | 18.4B | 7.08B |
| Cost of Revenue | 9.46B | 3.87B |
| Operating Expenses | 3.08B | 1.45B |
| Gross Profit | 8.98B | 3.22B |
| EBITDA | 6.34B | 2.54B |
| EBIT | 5.96B | 1.90B |
| Interest Expense | 178M | 62M |
| Net Income | 5.36B | 1.57B |
| EPS | 4.17 | 3.68 |
| Fiscal Year | 2025 | 2024 |
Income Statement Analysis: The Bottom-Line Duel
This income statement comparison reveals the true efficiency of Lam Research Corporation and ON Semiconductor’s corporate engines through recent financial performance.
Lam Research Corporation Analysis
Lam Research’s revenue climbed steadily from $14.6B in 2021 to $18.4B in 2025, with net income surging 37% over five years to $5.36B. Gross margin remains robust near 49%, while net margin expanded to 29%, signaling excellent cost control. The latest fiscal year shows strong momentum with a 24% revenue jump and a 13% net margin increase, underscoring operational efficiency.
ON Semiconductor Corporation Analysis
ON Semiconductor’s revenue peaked at $8.3B in 2022 but dipped 14% to $7.1B in 2024, dragging net income lower to $1.57B. Despite a solid gross margin around 45%, its net margin at 22% trails Lam Research. Recent declines in revenue and earnings, including a 26% EPS drop, highlight pressure on profitability and slower growth dynamics.
Margin Dominance vs. Revenue Resilience
Lam Research outpaces ON Semiconductor with superior margin expansion and consistent revenue growth. Lam’s 29% net margin dwarfs ON’s 22%, reflecting more efficient capital allocation and cost management. For investors, Lam presents a stronger profile, blending high-margin durability with accelerating top-line momentum, while ON faces headwinds despite past gains.
Financial Ratios Comparison
These vital ratios act as a diagnostic tool to expose the underlying fiscal health, valuation premiums, and capital efficiency of the companies compared below:
| Ratios | Lam Research Corporation (LRCX) | ON Semiconductor Corporation (ON) |
|---|---|---|
| ROE | 54.3% | 17.9% |
| ROIC | 34.0% | 11.9% |
| P/E | 23.4 | 17.1 |
| P/B | 12.7 | 3.1 |
| Current Ratio | 2.21 | 5.06 |
| Quick Ratio | 1.55 | 3.38 |
| D/E | 0.48 | 0.38 |
| Debt-to-Assets | 22.3% | 23.9% |
| Interest Coverage | 33.1 | 28.4 |
| Asset Turnover | 0.86 | 0.50 |
| Fixed Asset Turnover | 7.59 | 1.61 |
| Payout ratio | 21.5% | 0% |
| Dividend yield | 0.92% | 0% |
| Fiscal Year | 2025 | 2024 |
Efficiency & Valuation Duel: The Vital Signs
Ratios act as a company’s DNA, uncovering hidden risks and operational strengths that shape investor outcomes.
Lam Research Corporation
Lam Research exhibits a robust 54.3% ROE and a strong 29.1% net margin, signaling high profitability. Its P/E of 23.4 and P/B of 12.7 suggest a stretched valuation. Despite a modest 0.9% dividend yield, Lam reinvests heavily in R&D, fueling growth and sustaining its competitive edge.
ON Semiconductor Corporation
ON Semiconductor posts a moderate 17.9% ROE and 22.2% net margin, reflecting solid but less dominant profitability. The P/E of 17.1 and P/B of 3.1 indicate a more reasonable valuation. It pays no dividend, focusing capital on growth initiatives, though its current ratio of 5.1 flags potential liquidity inefficiency.
Valuation Stretch vs. Operational Strength
Lam Research commands a premium valuation justified by superior returns and disciplined capital allocation. ON Semiconductor offers a more conservative valuation but with lower profitability and efficiency. Investors seeking growth and operational excellence may lean toward Lam, while those prioritizing valuation discipline might prefer ON’s profile.
Which one offers the Superior Shareholder Reward?
Lam Research (LRCX) pays a consistent dividend with a 0.92% yield and a sustainable 21% payout ratio, backed by strong free cash flow of 4.2B. It also repurchases shares aggressively, boosting total shareholder return. ON Semiconductor (ON) offers no dividends, reinvesting heavily in growth and acquisitions, with a modest free cash flow yield and weaker buyback intensity. I see LRCX’s balanced distribution model as more sustainable and rewarding for 2026 investors seeking both income and capital appreciation.
Comparative Score Analysis: The Strategic Profile
The radar chart reveals the fundamental DNA and trade-offs of Lam Research Corporation and ON Semiconductor Corporation:
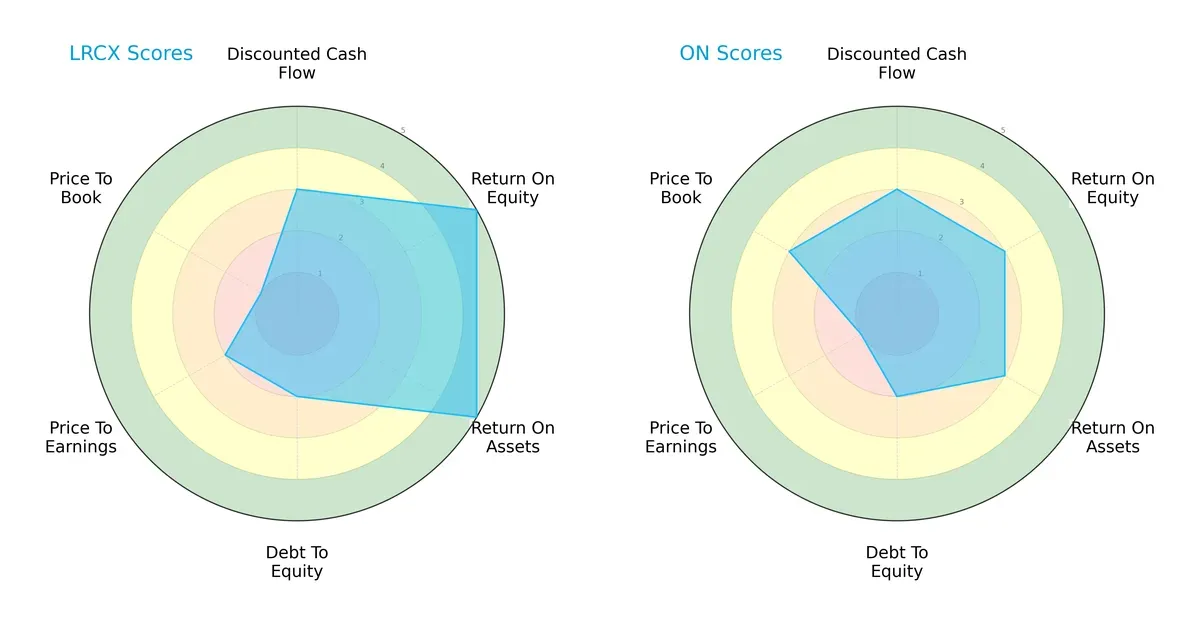
Lam Research dominates in profitability with top ROE and ROA scores (5 vs. 3), signaling superior asset and equity efficiency. Both firms share moderate DCF and debt/equity scores, reflecting similar valuation and leverage risk. ON Semiconductor shows relative strength in price-to-book valuation (3 vs. 1), indicating potential undervaluation. Lam Research’s profile is more balanced with clear operational advantages, while ON leans on valuation metrics for appeal.
Bankruptcy Risk: Solvency Showdown
Lam Research’s Altman Z-Score of 21.18 far exceeds ON Semiconductor’s 4.95, placing both safely above distress thresholds but highlighting Lam’s exceptional solvency:
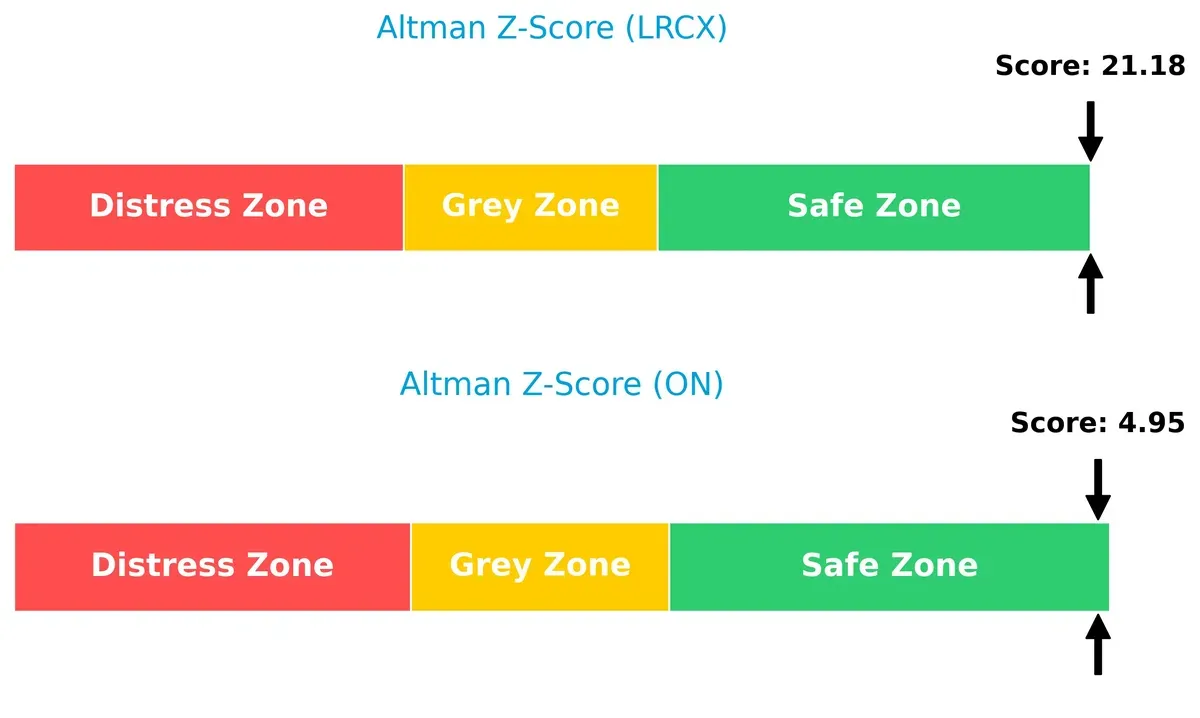
This gap signals Lam Research’s superior buffer against economic downturns. Historically, such a high Z-Score indicates robust capital structure resilience, reducing bankruptcy risk in volatile cycles. ON remains solvent but with less margin for error.
Financial Health: Quality of Operations
Lam Research scores an 8 on the Piotroski F-Score, surpassing ON Semiconductor’s 6, indicating stronger overall financial health:
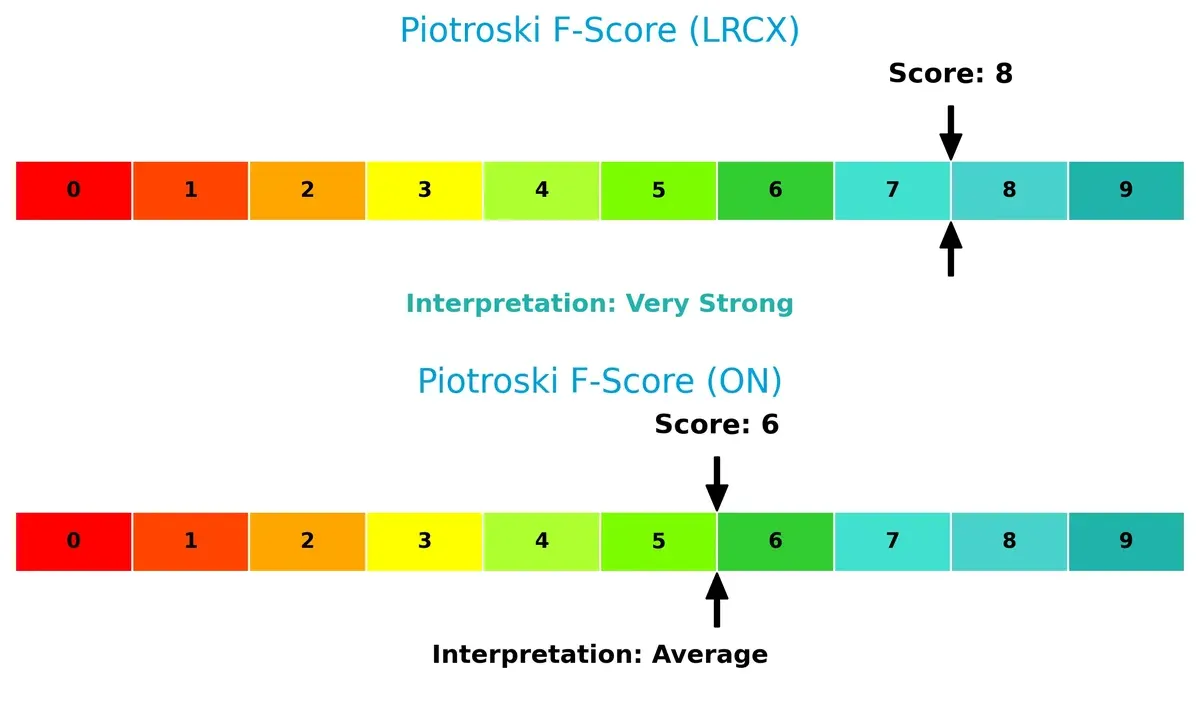
Lam’s near-peak score reflects excellent profitability, liquidity, and operational efficiency, aligning with its industry leadership. ON’s score, while decent, flags some internal weaknesses that warrant caution. Investors should weigh Lam’s superior financial quality in risk-sensitive portfolios.
How are the two companies positioned?
This section dissects the operational DNA of Lam Research and ON Semiconductor by comparing their revenue distribution and internal strengths and weaknesses. The goal is to confront their economic moats to identify which business model delivers the most resilient and sustainable competitive advantage today.
Revenue Segmentation: The Strategic Mix
The following visual comparison dissects how both Lam Research Corporation and ON Semiconductor Corporation diversify their income streams and where their primary sector bets lie:
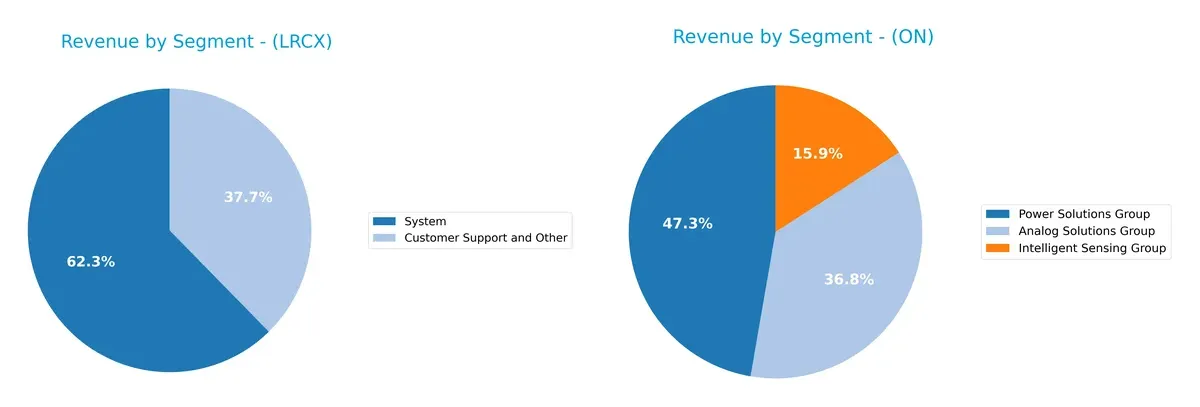
Lam Research anchors revenue around two main segments: System at $11.5B and Customer Support at $6.9B in 2025, showing moderate diversification. ON Semiconductor dwarfs Lam’s mix with three fairly balanced groups: Power Solutions at $3.3B, Analog Solutions at $2.6B, and Intelligent Sensing at $1.1B. ON’s broader spread reduces concentration risk, while Lam’s focus signals infrastructure dominance but exposes it to cyclical system demand.
Strengths and Weaknesses Comparison
This table compares the Strengths and Weaknesses of Lam Research Corporation and ON Semiconductor Corporation:
Lam Research Corporation Strengths
- High profitability with net margin 29.06% and ROE 54.33%
- Strong ROIC at 34.0% well above WACC
- Favorable current and quick ratios signaling solid liquidity
- Diverse revenue streams in System and Customer Support segments
- Significant global presence, especially in China and Korea
ON Semiconductor Corporation Strengths
- Positive net margin of 22.21% and solid ROE at 17.88%
- Favorable debt-to-equity and interest coverage ratios
- Diversified revenue across three main segments
- Broad geographic sales including Hong Kong, Singapore, UK, and US
- Reasonable P/E ratio at 17.13 reflecting market valuation
Lam Research Corporation Weaknesses
- High price-to-book ratio at 12.69 marks expensive valuation
- WACC at 12.09% unfavorably high relative to ROIC
- Low dividend yield of 0.92% may deter income investors
- Limited asset turnover ratio indicating moderate asset efficiency
ON Semiconductor Corporation Weaknesses
- Unfavorable current ratio at 5.06 suggests potential short-term liquidity concerns
- WACC at 10.24% higher than ROIC at 11.88% signals capital cost pressure
- Zero dividend yield limits shareholder returns
- Lower fixed asset turnover at 1.61 compared to peers
Lam Research shows robust profitability and liquidity but faces valuation and capital cost challenges. ON Semiconductor maintains solid profitability with broader geographic diversification, though it confronts liquidity and capital efficiency issues. Both companies’ financial profiles suggest distinct strategic priorities for managing growth and risk.
The Moat Duel: Analyzing Competitive Defensibility
A structural moat is the only true shield protecting long-term profits from relentless competition erosion. Let’s dive into the core moats of Lam Research Corporation and ON Semiconductor Corporation:
Lam Research Corporation: Precision Engineering Moat
Lam Research’s moat stems from its specialized semiconductor equipment and high switching costs. This manifests in a robust 32% EBIT margin and a strong 22% ROIC above WACC. Its expanding presence in Asia-Pacific and new process technologies deepen this moat in 2026.
ON Semiconductor Corporation: Emerging Power Solutions Moat
ON Semiconductor’s moat lies in its growing foothold in intelligent power and sensing solutions, contrasting with Lam’s equipment focus. Despite recent revenue setbacks, its improving ROIC trend signals rising profitability. Expansion into automotive electrification could disrupt markets ahead.
Capital Efficiency vs. Innovation Edge: Who Commands the Deeper Moat?
Lam Research holds a wider, more durable moat with consistent value creation and margin stability. ON Semiconductor shows promise but still sheds value relative to cost of capital. Lam is better positioned to defend market share amid semiconductor cycle volatility.
Which stock offers better returns?
Over the past year, Lam Research’s stock surged dramatically while ON Semiconductor’s showed a marked decline, highlighting contrasting market dynamics and investor sentiment.
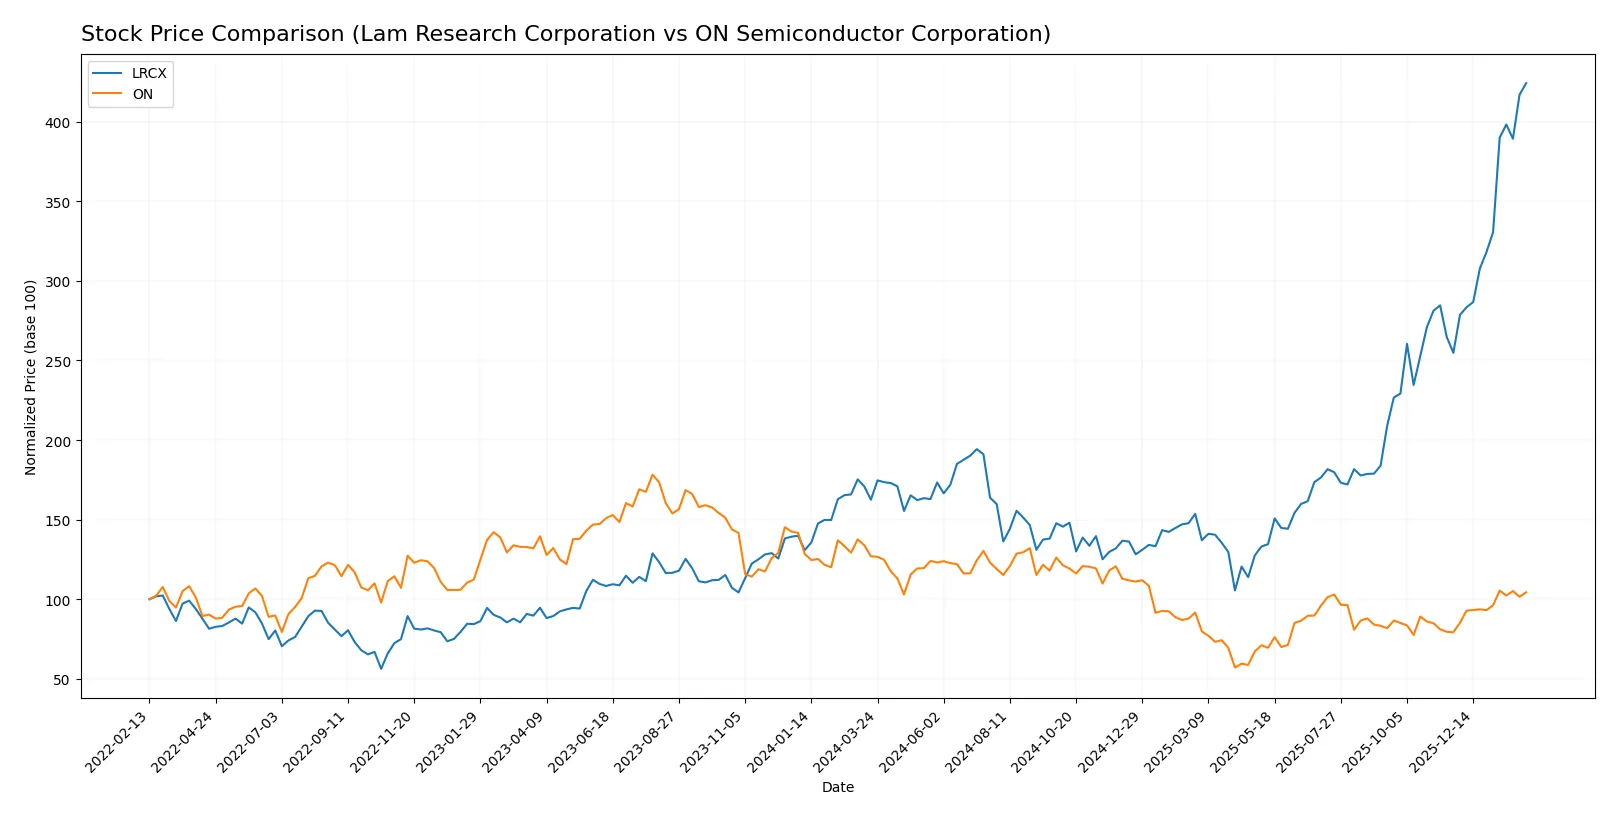
Trend Comparison
Lam Research’s stock price rose 161% over the past 12 months, reflecting a strong bullish trend with accelerating momentum and significant volatility. The price peaked at 237.5 and bottomed at 59.09, underscoring wide trading swings.
ON Semiconductor’s stock fell 17.8% over the same period, signaling a bearish trend despite acceleration. The price moved between 33.7 and 77.87, with lower volatility compared to Lam Research.
Comparing both, Lam Research delivered the highest market performance with a robust upward trend, while ON Semiconductor experienced a significant decline despite recent gains.
Target Prices
Analysts present a varied but generally optimistic target consensus for Lam Research and ON Semiconductor.
| Company | Target Low | Target High | Consensus |
|---|---|---|---|
| Lam Research Corporation | 127 | 325 | 266.76 |
| ON Semiconductor Corporation | 51 | 64 | 59.25 |
Lam Research’s consensus target of $266.76 exceeds its current price of $237.5, signaling upside potential. ON Semiconductor’s consensus target of $59.25 is slightly below its current price of $61.53, suggesting a more cautious outlook.

Don’t Let Luck Decide Your Entry Point
Optimize your entry points with our advanced ProRealTime indicators. You’ll get efficient buy signals with precise price targets for maximum performance. Start outperforming now!
How do institutions grade them?
The following tables summarize the latest institutional grades for Lam Research Corporation and ON Semiconductor Corporation:
Lam Research Corporation Grades
This table shows recent grades from leading financial institutions for Lam Research Corporation.
| Grading Company | Action | New Grade | Date |
|---|---|---|---|
| UBS | Maintain | Buy | 2026-01-29 |
| Wells Fargo | Maintain | Overweight | 2026-01-29 |
| JP Morgan | Maintain | Overweight | 2026-01-29 |
| RBC Capital | Maintain | Outperform | 2026-01-29 |
| Citigroup | Maintain | Buy | 2026-01-29 |
| Stifel | Maintain | Buy | 2026-01-29 |
| Morgan Stanley | Maintain | Equal Weight | 2026-01-29 |
| Needham | Maintain | Buy | 2026-01-29 |
| Susquehanna | Maintain | Positive | 2026-01-29 |
| Goldman Sachs | Maintain | Buy | 2026-01-29 |
ON Semiconductor Corporation Grades
The following table lists recent institutional grades for ON Semiconductor Corporation from reputable firms.
| Grading Company | Action | New Grade | Date |
|---|---|---|---|
| B of A Securities | Maintain | Neutral | 2026-01-21 |
| B. Riley Securities | Maintain | Neutral | 2026-01-20 |
| Stifel | Maintain | Hold | 2026-01-16 |
| Citigroup | Maintain | Neutral | 2026-01-15 |
| Wells Fargo | Maintain | Overweight | 2026-01-15 |
| Piper Sandler | Maintain | Overweight | 2026-01-07 |
| Truist Securities | Maintain | Hold | 2025-12-19 |
| Morgan Stanley | Maintain | Equal Weight | 2025-11-24 |
| Truist Securities | Maintain | Hold | 2025-11-04 |
| Morgan Stanley | Maintain | Equal Weight | 2025-11-04 |
Which company has the best grades?
Lam Research holds generally stronger ratings, primarily “Buy” and “Outperform,” compared to ON Semiconductor’s mixed “Neutral,” “Hold,” and “Overweight” grades. This suggests greater institutional confidence in Lam Research’s prospects, potentially influencing investor sentiment and stock performance expectations.
Risks specific to each company
The following categories identify the critical pressure points and systemic threats facing both firms in the 2026 market environment:
1. Market & Competition
Lam Research Corporation
- Dominates high-end semiconductor equipment with strong innovation but faces intense competition from global peers.
ON Semiconductor Corporation
- Competes in power and sensing semiconductors, battling aggressive pricing and fast technological shifts.
2. Capital Structure & Debt
Lam Research Corporation
- Maintains balanced leverage with a D/E of 0.48 and strong interest coverage of 33.43, signaling solid debt management.
ON Semiconductor Corporation
- Slightly lower leverage at 0.38 D/E and interest coverage of 30.49, but current ratio of 5.06 flags possible inefficiency in asset use.
3. Stock Volatility
Lam Research Corporation
- Beta of 1.78 indicates higher volatility relative to the market, reflecting sensitivity to tech cycles.
ON Semiconductor Corporation
- Beta of 1.54 shows somewhat less volatility but still above market average, implying moderate risk appetite.
4. Regulatory & Legal
Lam Research Corporation
- Faces strict export controls and IP protection challenges, especially in China and other key markets.
ON Semiconductor Corporation
- Subject to automotive and energy sector regulations, with evolving standards on power efficiency and safety compliance.
5. Supply Chain & Operations
Lam Research Corporation
- Complex global supply chain vulnerable to geopolitical disruptions, but strong operational controls mitigate risks.
ON Semiconductor Corporation
- Relies heavily on foundry partners and raw material availability; supply chain resilience remains a concern amid global tensions.
6. ESG & Climate Transition
Lam Research Corporation
- Actively invests in sustainable manufacturing and energy-efficient equipment, aligning with industry ESG trends.
ON Semiconductor Corporation
- Focuses on enabling electric vehicles and renewable energy, positioning well for climate transition but exposed to regulatory shifts.
7. Geopolitical Exposure
Lam Research Corporation
- High exposure to US-China trade tensions due to significant sales in Asia and technology transfer restrictions.
ON Semiconductor Corporation
- Also exposed to geopolitical risks in Asia and US government contracting, with potential supply chain impacts.
Which company shows a better risk-adjusted profile?
Lam Research’s biggest risk is geopolitical exposure, particularly US-China trade tensions impacting its high-value equipment sales. ON Semiconductor faces its greatest risk in supply chain fragility, given dependency on foundries amid global disruptions. I see Lam Research as having a better risk-adjusted profile. Its robust financial health, exemplified by an Altman Z-score above 21 and a very strong Piotroski score of 8, demonstrates resilience. ON Semiconductor’s lower financial strength metrics and higher operational risks tilt the balance. Recent data show Lam’s superior interest coverage ratio and prudent leverage, underscoring its capacity to withstand market shocks better than ON.
Final Verdict: Which stock to choose?
Lam Research Corporation (LRCX) stands out with its unmatched capital efficiency and a durable moat evidenced by a ROIC well above its WACC. Its ability to convert invested capital into robust returns underpins consistent value creation. The main point of vigilance is its elevated price-to-book ratio, which could signal premium valuation risk. LRCX suits an aggressive growth portfolio that can tolerate valuation swings for long-term gains.
ON Semiconductor Corporation (ON) offers a strategic moat rooted in improving profitability and a solid balance sheet with a high current ratio. Its lower valuation multiples present a more accessible entry point compared to LRCX, albeit with somewhat less pronounced capital efficiency. ON fits a GARP (Growth at a Reasonable Price) portfolio seeking growth with a margin of safety.
If you prioritize strong economic moats and capital returns, LRCX is the compelling choice due to its proven value creation and accelerating uptrend. However, if you seek a more conservative growth approach with better near-term stability and valuation appeal, ON offers a slightly favorable risk profile. Both stocks warrant careful monitoring of their respective valuation and growth trajectories.
Disclaimer: Investment carries a risk of loss of initial capital. The past performance is not a reliable indicator of future results. Be sure to understand risks before making an investment decision.
Go Further
I encourage you to read the complete analyses of Lam Research Corporation and ON Semiconductor Corporation to enhance your investment decisions: