Home > Comparison > Technology > NVDA vs LRCX
The strategic rivalry between NVIDIA Corporation and Lam Research Corporation shapes the semiconductor industry’s future. NVIDIA excels as a high-margin technology innovator specializing in GPUs and AI platforms. Lam Research operates as a capital-intensive equipment manufacturer critical to semiconductor fabrication. This analysis pits innovation-led growth against foundational industrial strength to identify which trajectory offers superior risk-adjusted returns for a diversified portfolio in today’s dynamic tech landscape.
Table of contents
Companies Overview
NVIDIA and Lam Research shape the semiconductor industry with distinct yet complementary roles.
NVIDIA Corporation: Pioneer in AI and Visual Computing
NVIDIA dominates as a semiconductor giant specializing in graphics and compute solutions. Its core revenue stems from GPUs powering gaming, data centers, and AI workloads. In 2026, NVIDIA focuses strategically on expanding its AI software ecosystem and autonomous vehicle platforms, reinforcing its leadership in accelerated computing and visual technologies.
Lam Research Corporation: Specialist in Semiconductor Fabrication Equipment
Lam Research leads in designing and servicing semiconductor manufacturing equipment critical for chip production. It generates revenue by selling advanced deposition, etch, and cleaning systems to semiconductor fabs worldwide. The company’s strategic thrust in 2026 targets precision process innovation to support next-generation integrated circuit fabrication.
Strategic Collision: Similarities & Divergences
NVIDIA pursues a software-driven AI and graphics ecosystem, while Lam Research focuses on hardware enabling semiconductor fabrication. Their competition centers on the semiconductor value chain but at different stages: NVIDIA in chip design and AI applications; Lam Research in manufacturing process efficiency. Investors face contrasting profiles—NVIDIA bets on high-growth AI markets; Lam Research offers exposure to capital-intensive chipmaking infrastructure.
Income Statement Comparison
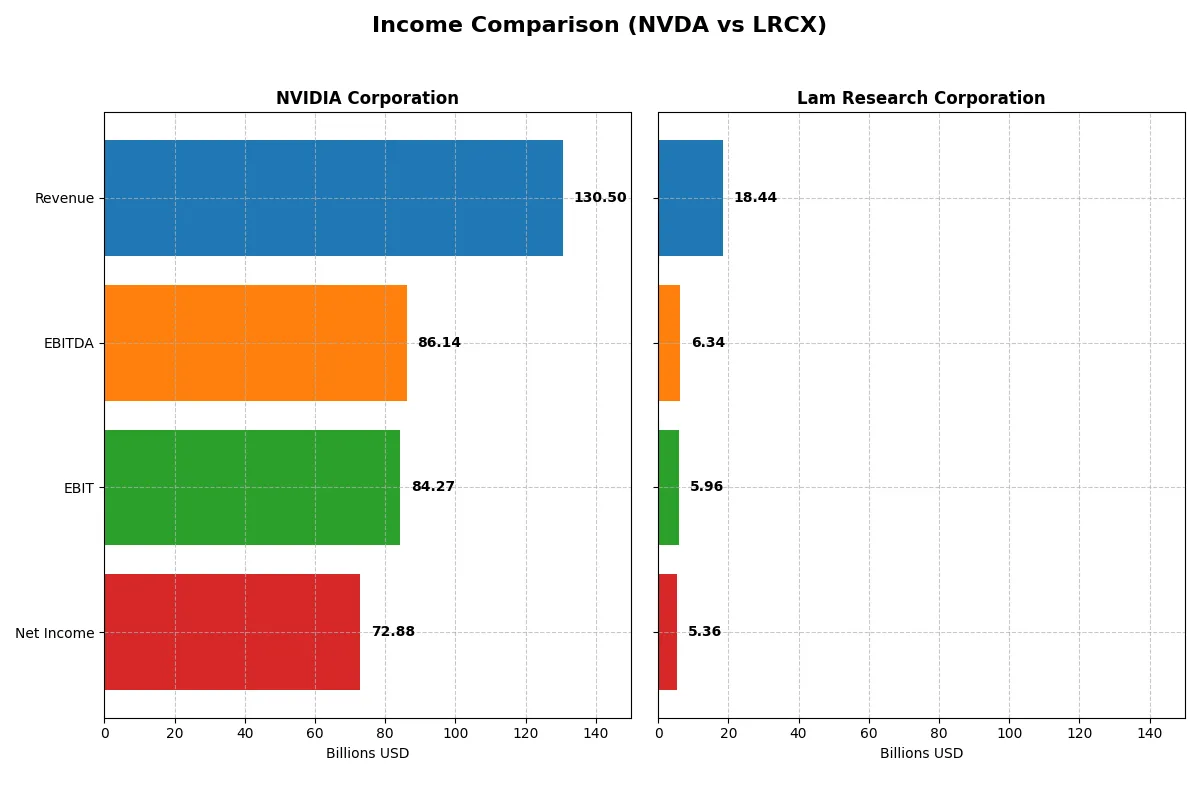
This data dissects the core profitability and scalability of both corporate engines to reveal who dominates the bottom line:
| Metric | NVIDIA Corporation (NVDA) | Lam Research Corporation (LRCX) |
|---|---|---|
| Revenue | 130.5B | 18.4B |
| Cost of Revenue | 32.6B | 9.5B |
| Operating Expenses | 16.4B | 3.1B |
| Gross Profit | 97.9B | 9.0B |
| EBITDA | 86.1B | 6.3B |
| EBIT | 84.3B | 6.0B |
| Interest Expense | 247M | 178M |
| Net Income | 72.9B | 5.4B |
| EPS | 2.97 | 4.17 |
| Fiscal Year | 2025 | 2025 |
Income Statement Analysis: The Bottom-Line Duel
This income statement comparison reveals which company runs the most efficient and profitable corporate engine over recent years.
NVIDIA Corporation Analysis
NVIDIA’s revenue surged from $16.7B in 2021 to $130.5B in 2025, while net income soared from $4.3B to $72.9B. Gross margin remains robust at 75%, with net margin climbing to 56%, signaling outstanding profitability. The 2025 fiscal year highlights extraordinary growth momentum and operational efficiency, driven by disciplined cost control and strong R&D investment.
Lam Research Corporation Analysis
Lam Research’s revenue grew steadily from $14.6B in 2021 to $18.4B in 2025, with net income rising from $3.9B to $5.4B. Gross margin holds at 49%, and net margin improved to 29%, reflecting solid but more moderate profitability. The latest year shows consistent margin expansion and earnings growth, supported by effective expense management amid a less aggressive growth pace.
Margin Dominance vs. Steady Growth
NVIDIA dominates with explosive revenue and net income growth, paired with superior margins that far exceed Lam Research’s. Lam offers stable, incremental gains with respectable profitability. Investors seeking rapid scale and high-margin leadership find NVIDIA’s profile more compelling, while Lam suits those favoring steady, reliable expansion.
Financial Ratios Comparison
These vital ratios act as a diagnostic tool to expose the underlying fiscal health, valuation premiums, and capital efficiency of the companies compared below:
| Ratios | NVIDIA Corporation (NVDA) | Lam Research Corporation (LRCX) |
|---|---|---|
| ROE | 91.9% | 54.3% |
| ROIC | 75.3% | 34.0% |
| P/E | 39.9 | 23.4 |
| P/B | 36.7 | 12.7 |
| Current Ratio | 4.44 | 2.21 |
| Quick Ratio | 3.88 | 1.55 |
| D/E (Debt-to-Equity) | 0.13 | 0.48 |
| Debt-to-Assets | 9.2% | 22.3% |
| Interest Coverage | 330x | 33x |
| Asset Turnover | 1.17 | 0.86 |
| Fixed Asset Turnover | 16.2 | 7.59 |
| Payout ratio | 1.1% | 21.5% |
| Dividend yield | 0.029% | 0.92% |
| Fiscal Year | 2025 | 2025 |
Efficiency & Valuation Duel: The Vital Signs
Financial ratios act as the company’s DNA, exposing operational strengths and hidden risks critical for investment decisions in 2026.
NVIDIA Corporation
NVIDIA posts an exceptional ROE of 91.87% and a robust net margin of 55.85%, signaling superior profitability. However, its P/E of 39.9 and P/B of 36.66 mark the stock as stretched. Shareholder returns lean on minimal dividends (0.03% yield), with heavy reinvestment in R&D fueling growth and innovation.
Lam Research Corporation
Lam Research delivers a solid ROE of 54.33% and a respectable net margin of 29.06%, reflecting efficient operations. Its valuation metrics, including a moderate P/E of 23.36 and P/B of 12.69, suggest a fair price. It offers a higher dividend yield (0.92%), balancing income with steady capital allocation.
Premium Valuation vs. Balanced Fundamentals
NVIDIA’s profitability outpaces Lam but at a significant premium, implying higher valuation risk. Lam offers a better balance of valuation and operational efficiency, with more shareholder-friendly dividends. Growth-focused investors may prefer NVIDIA’s innovation-driven profile, while income-oriented investors might favor Lam’s steadier returns.
Which one offers the Superior Shareholder Reward?
I see NVIDIA pays a negligible dividend yield of 0.03% with a minimal payout ratio near 1%. Its buyback program is aggressive, reflecting confidence in growth reinvestment. Lam Research yields 0.9% with a higher payout ratio around 21%, and maintains steady buybacks boosting total returns. NVIDIA’s low dividend but strong buybacks and high free cash flow support sustainable capital allocation. Lam offers a more balanced income and buyback mix. For 2026, I favor NVIDIA’s superior total return due to its robust buyback intensity and reinvestment in high-margin innovation.
Comparative Score Analysis: The Strategic Profile
The radar chart reveals the fundamental DNA and trade-offs of NVIDIA Corporation and Lam Research Corporation, highlighting their core financial strengths and valuation metrics:
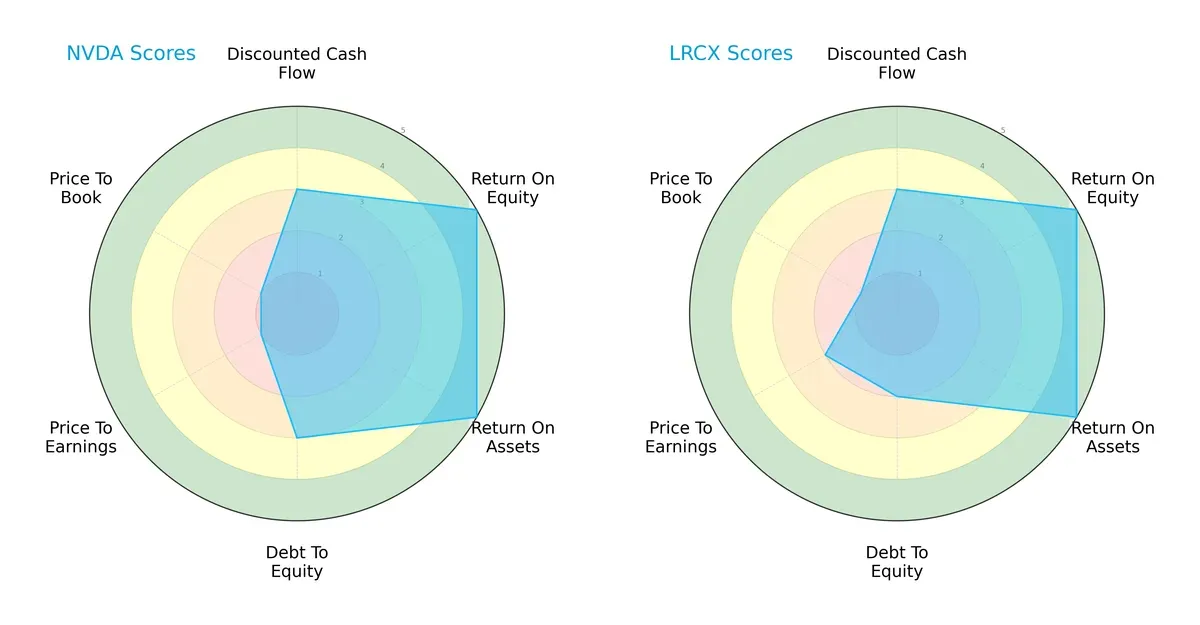
Both firms share equally strong ROE and ROA scores, reflecting efficient profit generation and asset use. NVIDIA shows a moderate debt-to-equity position, while Lam Research carries slightly less leverage. Valuation metrics tilt slightly in favor of Lam Research, with a better P/E score, though both struggle on P/B. Overall, Lam Research presents a more balanced risk-return profile; NVIDIA relies heavily on operational efficiency but faces valuation headwinds.
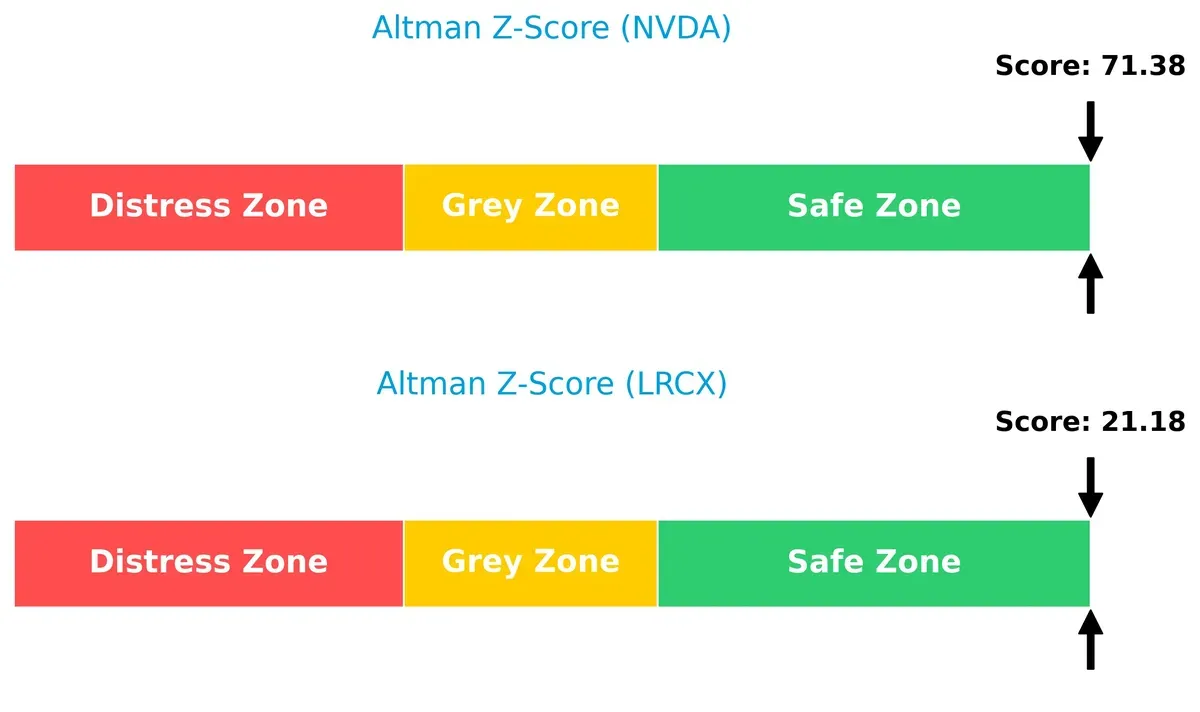
Bankruptcy Risk: Solvency Showdown
The Altman Z-Score gap strongly favors NVIDIA, signaling a far safer solvency position for long-term survival in this cycle:
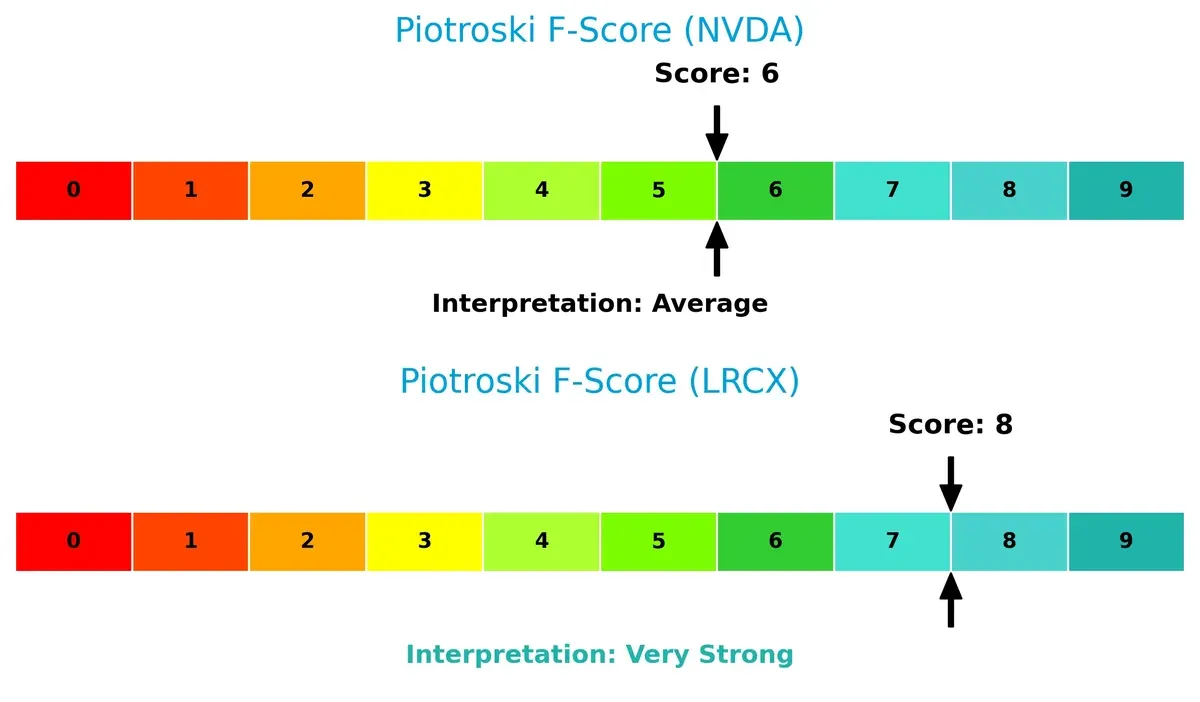
Financial Health: Quality of Operations
Lam Research’s Piotroski F-Score of 8 signals very strong financial health, while NVIDIA’s 6 suggests average operational quality, highlighting Lam Research’s superior internal metrics:
How are the two companies positioned?
This section dissects NVDA and LRCX’s operational DNA by comparing their revenue distribution and internal dynamics, including strengths and weaknesses. The goal is to confront their economic moats to identify which model offers the most resilient competitive advantage today.
Revenue Segmentation: The Strategic Mix
This visual comparison dissects how NVIDIA Corporation and Lam Research Corporation diversify their income streams and where their primary sector bets lie:
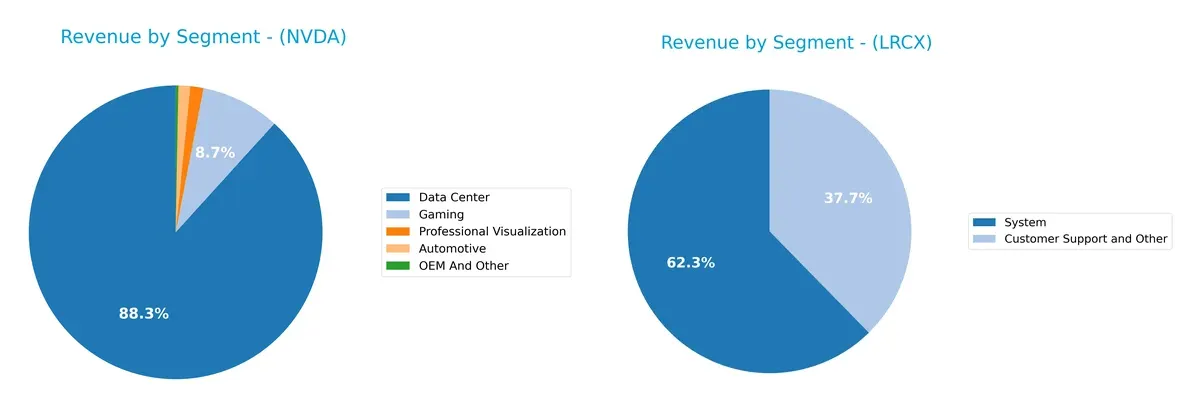
NVIDIA’s revenue pivots heavily on its Data Center segment at $115B in 2025, dwarfing other segments like Gaming at $11.35B. This concentration underscores NVIDIA’s dominance in AI infrastructure but exposes it to sector cyclicality. Conversely, Lam Research shows a more balanced mix, with Systems at $11.5B and Customer Support at $6.9B, reflecting steady aftermarket resilience and infrastructure lock-in in semiconductor equipment. Lam’s diversification reduces concentration risk relative to NVIDIA.
Strengths and Weaknesses Comparison
This table compares the strengths and weaknesses of NVIDIA Corporation and Lam Research Corporation based on key financial and market metrics:
NVIDIA Corporation Strengths
- High net margin at 55.85%
- ROE at 91.87% and ROIC at 75.28% indicate strong profitability
- Low debt-to-assets ratio at 9.2%
- Excellent interest coverage at 341x
- Significant global presence with $61B US and $24B Singapore revenue
Lam Research Corporation Strengths
- Solid net margin at 29.06%
- Strong ROE 54.33% and ROIC 34.0%
- Favorable current and quick ratios indicate good liquidity
- Moderate debt levels with 22.28% debt-to-assets
- Diverse geographic sales including $6.2B China and $4.1B Korea revenue
NVIDIA Corporation Weaknesses
- Unfavorable high WACC at 14.73%
- Elevated P/E (39.9) and P/B (36.66) ratios imply premium valuation
- High current ratio at 4.44 may indicate inefficient asset use
- Negligible dividend yield at 0.03%
- Concentrated revenue in Data Center ($115B) segment
Lam Research Corporation Weaknesses
- Unfavorable WACC at 12.09%
- Unfavorable P/B at 12.69 and neutral P/E at 23.36
- Lower asset turnover at 0.86 signals less efficiency
- Higher dividend yield at 0.92% may pressure cash flow
- Revenue highly dependent on System segment ($11.5B)
Both companies exhibit favorable overall financial health and profitability with distinct strengths in market segments and geographic reach. NVIDIA’s high profitability and low leverage contrast with Lam Research’s solid liquidity and regional diversification. Each faces valuation and operational efficiency challenges that could influence strategic priorities.
The Moat Duel: Analyzing Competitive Defensibility
A structural moat is the only thing protecting long-term profits from the erosion of competition. Let’s dissect the sources of defensibility for these two semiconductor giants:
NVIDIA Corporation: Network Effects and Intangible Assets Powerhouse
NVIDIA’s moat stems from powerful network effects and proprietary software ecosystems, reflected in its 75% gross margin and soaring 60.6% ROIC above WACC. Its expanding AI and data center platforms deepen this advantage in 2026.
Lam Research Corporation: Cost Advantage in Semiconductor Equipment
Lam Research relies on a cost advantage through specialized wafer fabrication technology. Its 49% gross margin and 21.9% ROIC above WACC underscore efficient capital use, though its narrower moat faces pressure from rapid tech innovation and industry cyclicality.
Verdict: Network Effects vs. Cost Leadership in Semiconductors
NVIDIA’s wider moat benefits from sticky ecosystems and superior profitability, outpacing Lam’s cost-driven edge. I see NVIDIA better positioned to defend and expand market share amid accelerating AI demand.
Which stock offers better returns?
Stock prices for NVIDIA Corporation and Lam Research Corporation have shown significant upward momentum over the past year, with marked acceleration and shifting buyer-seller dynamics.
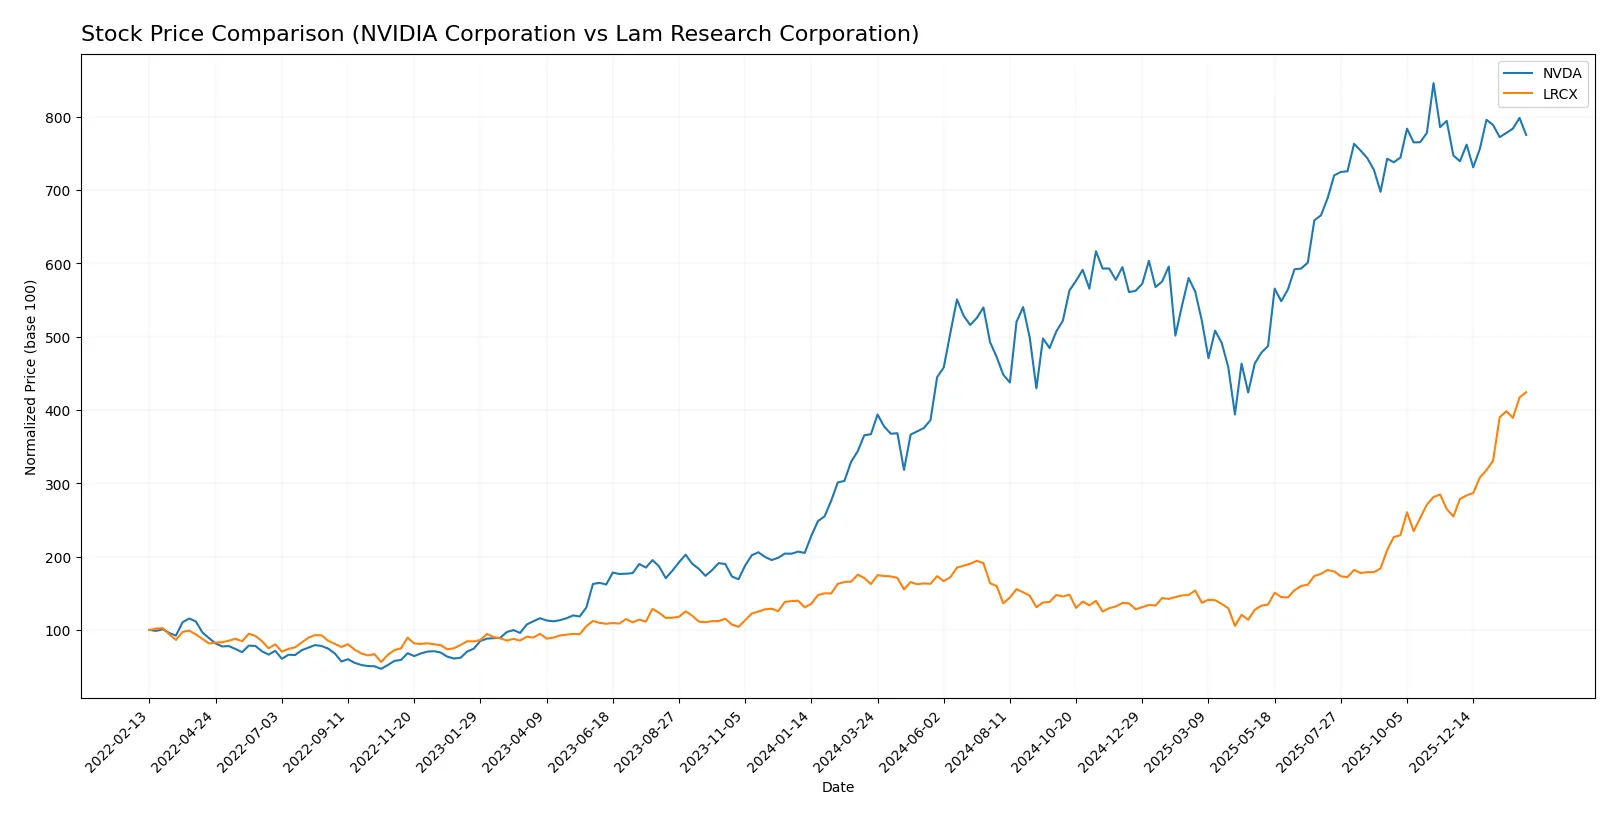
Trend Comparison
NVIDIA’s stock price rose 111.3% over the past 12 months, confirming a bullish trend with acceleration. The price ranged from $76.2 to $202.49, showing strong upward momentum despite high volatility.
Lam Research’s stock gained 160.96% over the same period, also bullish with acceleration. It reached a high of $237.5 from a low of $59.09, exhibiting higher volatility than NVIDIA.
Lam Research outperformed NVIDIA with a greater price increase of 160.96% versus 111.3%, delivering the highest market returns over the past year.
Target Prices
Analysts project strong upside potential for NVIDIA Corporation and Lam Research Corporation, reflecting optimism in the semiconductor sector.
| Company | Target Low | Target High | Consensus |
|---|---|---|---|
| NVIDIA Corporation | 140 | 352 | 265.21 |
| Lam Research Corporation | 127 | 325 | 266.76 |
Both stocks trade well below their consensus targets, suggesting attractive entry points given their growth prospects and industry positioning.

Don’t Let Luck Decide Your Entry Point
Optimize your entry points with our advanced ProRealTime indicators. You’ll get efficient buy signals with precise price targets for maximum performance. Start outperforming now!
How do institutions grade them?
This section reviews the latest institutional grades for NVIDIA Corporation and Lam Research Corporation:
NVIDIA Corporation Grades
The following table summarizes recent grade actions from key financial institutions:
| Grading Company | Action | New Grade | Date |
|---|---|---|---|
| Jefferies | maintain | Buy | 2026-01-16 |
| Mizuho | maintain | Outperform | 2026-01-09 |
| Stifel | maintain | Buy | 2025-12-29 |
| Truist Securities | maintain | Buy | 2025-12-29 |
| B of A Securities | maintain | Buy | 2025-12-26 |
| Bernstein | maintain | Outperform | 2025-12-26 |
| Baird | maintain | Outperform | 2025-12-26 |
| Truist Securities | maintain | Buy | 2025-12-19 |
| Tigress Financial | maintain | Strong Buy | 2025-12-18 |
| Morgan Stanley | maintain | Overweight | 2025-12-01 |
Lam Research Corporation Grades
The following table summarizes recent grade actions from key financial institutions:
| Grading Company | Action | New Grade | Date |
|---|---|---|---|
| UBS | maintain | Buy | 2026-01-29 |
| Wells Fargo | maintain | Overweight | 2026-01-29 |
| JP Morgan | maintain | Overweight | 2026-01-29 |
| RBC Capital | maintain | Outperform | 2026-01-29 |
| Citigroup | maintain | Buy | 2026-01-29 |
| Stifel | maintain | Buy | 2026-01-29 |
| Morgan Stanley | maintain | Equal Weight | 2026-01-29 |
| Needham | maintain | Buy | 2026-01-29 |
| Susquehanna | maintain | Positive | 2026-01-29 |
| Goldman Sachs | maintain | Buy | 2026-01-29 |
Which company has the best grades?
NVIDIA has a slightly stronger grade profile, featuring multiple “Outperform” and a “Strong Buy” rating. Lam Research shows consistent “Buy” and “Overweight” grades but fewer top-tier ratings. Investors may view NVIDIA’s higher-grade consistency as a signal of stronger analyst conviction.
Risks specific to each company
The following categories identify critical pressure points and systemic threats facing NVIDIA Corporation and Lam Research Corporation in the 2026 market environment:
1. Market & Competition
NVIDIA Corporation
- Dominates AI and gaming GPUs but faces intense competition from AMD and Intel in high-growth segments.
Lam Research Corporation
- Strong in semiconductor equipment but exposed to cyclical chip demand and competition from Applied Materials.
2. Capital Structure & Debt
NVIDIA Corporation
- Low debt levels with a debt-to-equity ratio of 0.13 and strong interest coverage at 341x.
Lam Research Corporation
- Moderate leverage with debt-to-equity around 0.48; interest coverage at 33x remains solid but less conservative.
3. Stock Volatility
NVIDIA Corporation
- High beta at 2.31 signals elevated stock price volatility, reflecting growth stock risk.
Lam Research Corporation
- Lower beta of 1.78 suggests relatively more stable stock price movements amid semiconductor cycles.
4. Regulatory & Legal
NVIDIA Corporation
- Faces regulatory scrutiny over AI technology exports and antitrust concerns in global markets.
Lam Research Corporation
- Exposed to export controls impacting semiconductor equipment sales, especially to China.
5. Supply Chain & Operations
NVIDIA Corporation
- Relies on foundries like TSMC; supply chain disruptions could delay product launches.
Lam Research Corporation
- Dependent on semiconductor fabrication cycles and raw materials; disruptions affect equipment deliveries.
6. ESG & Climate Transition
NVIDIA Corporation
- Increasing focus on sustainable AI and energy-efficient computing solutions.
Lam Research Corporation
- Faces pressure to reduce emissions from manufacturing equipment and improve operational sustainability.
7. Geopolitical Exposure
NVIDIA Corporation
- Significant revenue from China and Taiwan; geopolitical tensions pose supply and sales risks.
Lam Research Corporation
- Global footprint with exposure to US-China trade tensions impacting equipment exports.
Which company shows a better risk-adjusted profile?
NVIDIA’s most impactful risk lies in its high stock volatility and stretched valuation multiples, exposing investors to market swings. Lam Research’s critical risk centers on geopolitical and supply chain sensitivities affecting equipment sales. Despite NVIDIA’s superior profitability and balance sheet strength, Lam’s lower volatility and strong Piotroski score suggest a better risk-adjusted profile. Notably, NVIDIA’s price-to-book ratio at 36.7 flags potential overvaluation risk amid market pressure.
Final Verdict: Which stock to choose?
NVIDIA’s superpower lies in its extraordinary capital efficiency and explosive growth trajectory. Its ability to generate returns far exceeding its cost of capital signals a durable competitive advantage. The high valuation multiples warrant caution, marking a point of vigilance. It suits aggressive growth portfolios willing to embrace premium pricing for innovation leadership.
Lam Research boasts a strategic moat grounded in steady free cash flow and robust operational returns. Its valuation appears more reasonable, offering a safer profile than NVIDIA amid market volatility. This stock fits well within GARP portfolios seeking balance between growth potential and relative stability in capital allocation.
If you prioritize rapid innovation and outsized returns, NVIDIA outshines as the compelling choice due to its dominant market position and accelerating profitability. However, if you seek steadier growth with a margin of safety, Lam Research offers better stability and more attractive valuation metrics. Each stock aligns with distinct investor profiles, underscoring the value of tailored portfolio strategies.
Disclaimer: Investment carries a risk of loss of initial capital. The past performance is not a reliable indicator of future results. Be sure to understand risks before making an investment decision.
Go Further
I encourage you to read the complete analyses of NVIDIA Corporation and Lam Research Corporation to enhance your investment decisions: