Home > Comparison > Technology > LRCX vs NVEC
The strategic rivalry between Lam Research Corporation and NVE Corporation shapes the semiconductor industry’s competitive landscape. Lam Research operates as a capital-intensive equipment manufacturer, serving global chipmakers with advanced fabrication tools. In contrast, NVE is a niche innovator focused on spintronic sensors and couplers, targeting specialized industrial and medical applications. This analysis will assess which company’s business model and growth trajectory present a superior risk-adjusted opportunity for a diversified technology portfolio.
Table of contents
Companies Overview
Lam Research Corporation and NVE Corporation are pivotal players in the semiconductor industry with distinct market roles.
Lam Research Corporation: Semiconductor Equipment Powerhouse
Lam Research dominates semiconductor processing equipment, generating revenue by designing and servicing wafer fabrication systems globally. Its core business includes advanced plasma etching and deposition technologies critical for integrated circuit production. In 2026, Lam focused strategically on expanding its high-density plasma and atomic layer deposition systems to capture growth in next-generation chip manufacturing.
NVE Corporation: Spintronics Innovator
NVE Corporation specializes in spintronic devices that leverage electron spin for data acquisition and transmission, serving factory automation and medical sectors. Its competitive advantage lies in proprietary magnetic sensors and couplers tailored for IoT and medical applications. In 2026, NVE prioritized R&D and licensing to advance spintronic MRAM technology and broaden its niche market footprint.
Strategic Collision: Similarities & Divergences
Both companies operate within semiconductors but diverge sharply in scope: Lam pursues a broad, capital-intensive equipment model, while NVE targets specialized, technology-driven sensor markets. Their main battleground lies in enabling semiconductor innovation—Lam through fabrication tools, NVE via spintronic components. This contrast defines distinct risk-return profiles: Lam offers scale and market leadership; NVE presents focused innovation with niche exposure.
Income Statement Comparison
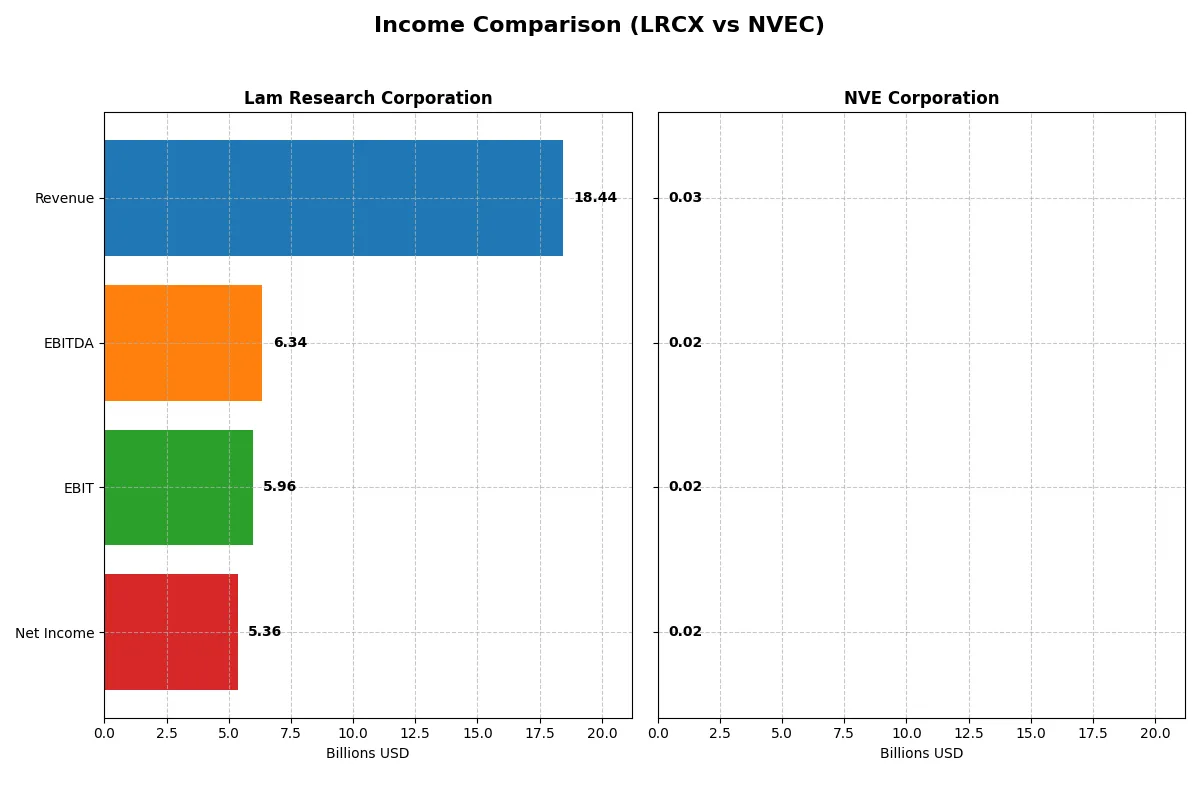
The following data dissects the core profitability and scalability of both corporate engines to reveal who dominates the bottom line:
| Metric | Lam Research Corporation (LRCX) | NVE Corporation (NVEC) |
|---|---|---|
| Revenue | 18.4B | 25.9M |
| Cost of Revenue | 9.5B | 4.2M |
| Operating Expenses | 3.1B | 5.6M |
| Gross Profit | 9.0B | 21.6M |
| EBITDA | 6.3B | 16.3M |
| EBIT | 6.0B | 16.0M |
| Interest Expense | 178M | 0 |
| Net Income | 5.4B | 15.1M |
| EPS | 4.17 | 3.12 |
| Fiscal Year | 2025 | 2025 |
Income Statement Analysis: The Bottom-Line Duel
This income statement comparison exposes which company runs a more efficient and profitable business engine through recent financial performance.
Lam Research Corporation Analysis
Lam Research exhibits a strong upward trajectory in revenue and net income, reaching $18.4B and $5.36B in 2025. Its gross margin stands at a healthy 48.7%, while net margin hits 29.1%, reflecting robust profitability. The 2025 year shows accelerating momentum, with revenue up 23.7% and net income surging 40%+ over recent years, signaling operational efficiency.
NVE Corporation Analysis
NVE posts $26M revenue with $15M net income in 2025, demonstrating outstanding margin strength—gross margin soars at 83.6%, net margin at 58.2%. Despite a recent revenue decline of 13%, its high-margin profile sustains strong profitability. However, earnings and top line show softness in the latest fiscal year, indicating some momentum challenges.
Margin Dominance vs. Growth Momentum
Lam Research delivers superior scale and accelerating growth, expanding revenue and profits consistently with favorable margin trends. NVE leads on margin dominance but suffers recent revenue and earnings contraction. For investors, Lam’s profile offers growth with solid profitability, while NVE presents a high-margin but currently slowing business.
Financial Ratios Comparison
These vital ratios act as a diagnostic tool to expose the underlying fiscal health, valuation premiums, and capital efficiency of the companies compared:
| Ratios | Lam Research Corporation (LRCX) | NVE Corporation (NVEC) |
|---|---|---|
| ROE | 54.3% (2025) | 24.2% (2025) |
| ROIC | 34.0% (2025) | 21.1% (2025) |
| P/E | 23.4 (2025) | 20.5 (2025) |
| P/B | 12.7 (2025) | 4.9 (2025) |
| Current Ratio | 2.21 (2025) | 28.4 (2025) |
| Quick Ratio | 1.55 (2025) | 22.0 (2025) |
| D/E | 0.48 (2025) | 0.015 (2025) |
| Debt-to-Assets | 22.3% (2025) | 1.43% (2025) |
| Interest Coverage | 33.1 (2025) | 0 (2025) |
| Asset Turnover | 0.86 (2025) | 0.40 (2025) |
| Fixed Asset Turnover | 7.59 (2025) | 8.91 (2025) |
| Payout ratio | 21.5% (2025) | 128.4% (2025) |
| Dividend yield | 0.92% (2025) | 6.28% (2025) |
| Fiscal Year | 2025 | 2025 |
Efficiency & Valuation Duel: The Vital Signs
Financial ratios act as a company’s DNA, uncovering hidden risks and showcasing operational excellence essential for informed investing.
Lam Research Corporation
Lam Research delivers a robust 54.3% ROE and a strong 29.1% net margin, signaling high profitability. Its P/E at 23.4 aligns with sector norms, but a steep P/B of 12.7 signals valuation risk. The company favors reinvestment, dedicating over 11% of revenue to R&D, with a modest 0.9% dividend yield, balancing growth and shareholder returns.
NVE Corporation
NVE posts an impressive 58.2% net margin, though its 24.2% ROE is comparatively moderate. The P/E of 20.5 suggests a fairly valued stock, while an unusually high current ratio at 28.4 flags potential asset inefficiency. NVE supports shareholders with a 6.3% dividend yield, prioritizing income alongside a solid 9.1% fixed asset turnover.
Valuation Discipline vs. Profitability Strength
Lam Research blends superior profitability with disciplined reinvestment despite a stretched P/B ratio. NVE offers exceptional margins and attractive dividends but shows signs of operational inefficiency. Investors seeking growth may lean toward Lam, while income-focused profiles may find NVE’s yield appealing.
Which one offers the Superior Shareholder Reward?
I compare Lam Research (LRCX) and NVE Corporation (NVEC) on dividends, payout ratios, and buybacks. Lam Research yields ~0.92% with a payout ratio near 21%, showing conservative, sustainable distributions supported by a 3.2x dividend+capex coverage ratio. Its buyback program is moderate but consistent. NVE yields a hefty 6.3% but with payout ratios exceeding 100%, signaling reliance on capital or debt to fund dividends, raising sustainability concerns. NVE’s negligible debt and massive cash cushions provide some comfort, yet its dividend+capex coverage sits below 1. NVEC’s buybacks appear minimal, focusing on dividends for shareholder returns. For 2026, I favor Lam Research’s balanced mix of dividends and buybacks. It offers a more sustainable, risk-adjusted total return profile, unlike NVE’s high but potentially fragile yield.
Comparative Score Analysis: The Strategic Profile
The radar chart reveals the fundamental DNA and trade-offs of Lam Research Corporation and NVE Corporation, highlighting their financial strengths and valuation nuances:
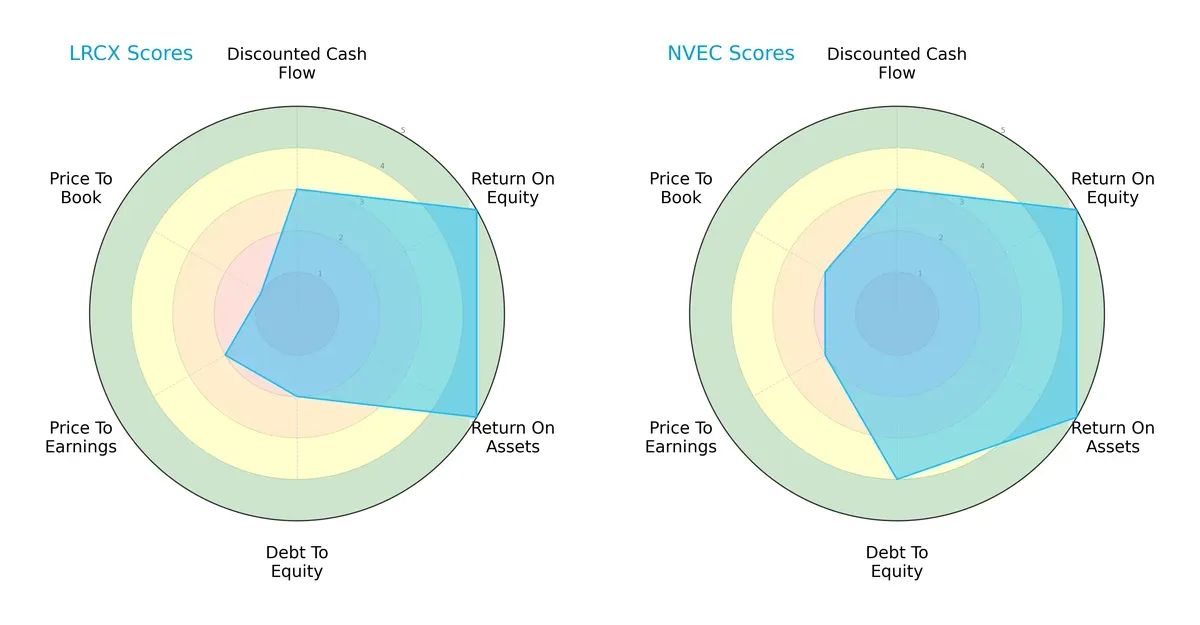
NVE leads with a more balanced financial profile, scoring favorably in debt management and valuation metrics. Lam Research excels in profitability (ROE and ROA) but shows vulnerabilities in debt-to-equity and price-to-book scores. Lam relies heavily on operational efficiency, while NVE maintains steadier capital allocation and market valuation balance.
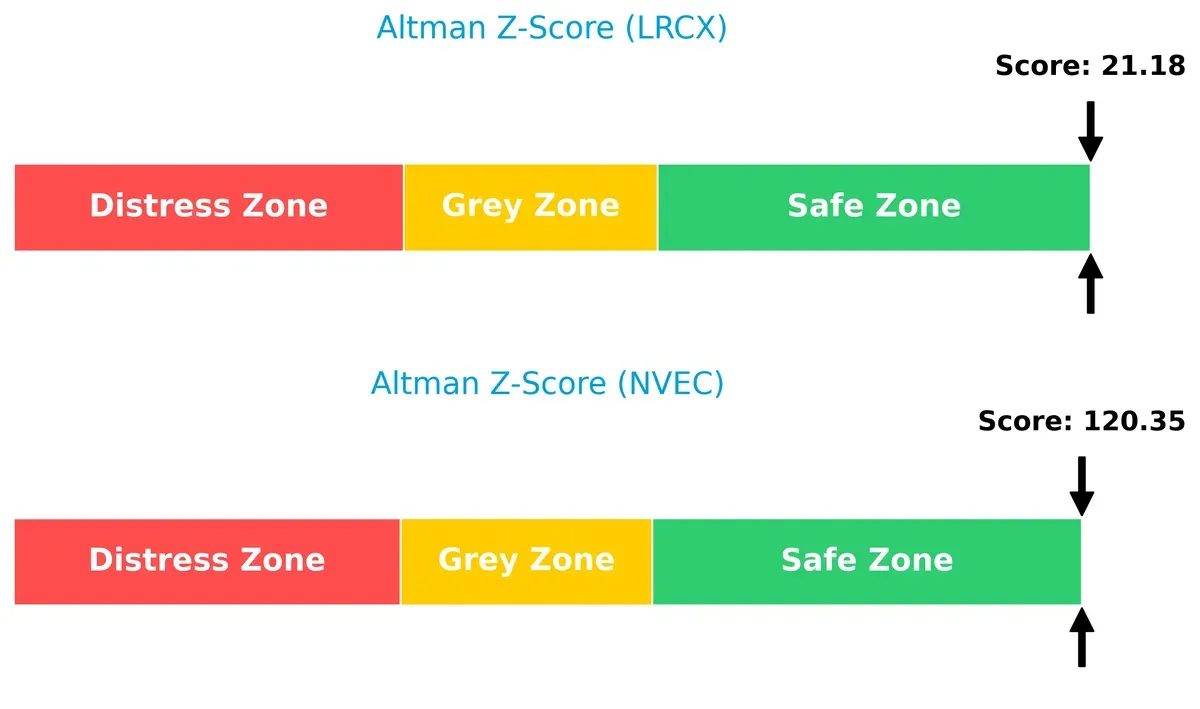
Bankruptcy Risk: Solvency Showdown
NVE’s Altman Z-Score vastly exceeds Lam Research’s, signaling superior long-term solvency and resilience in this market cycle:
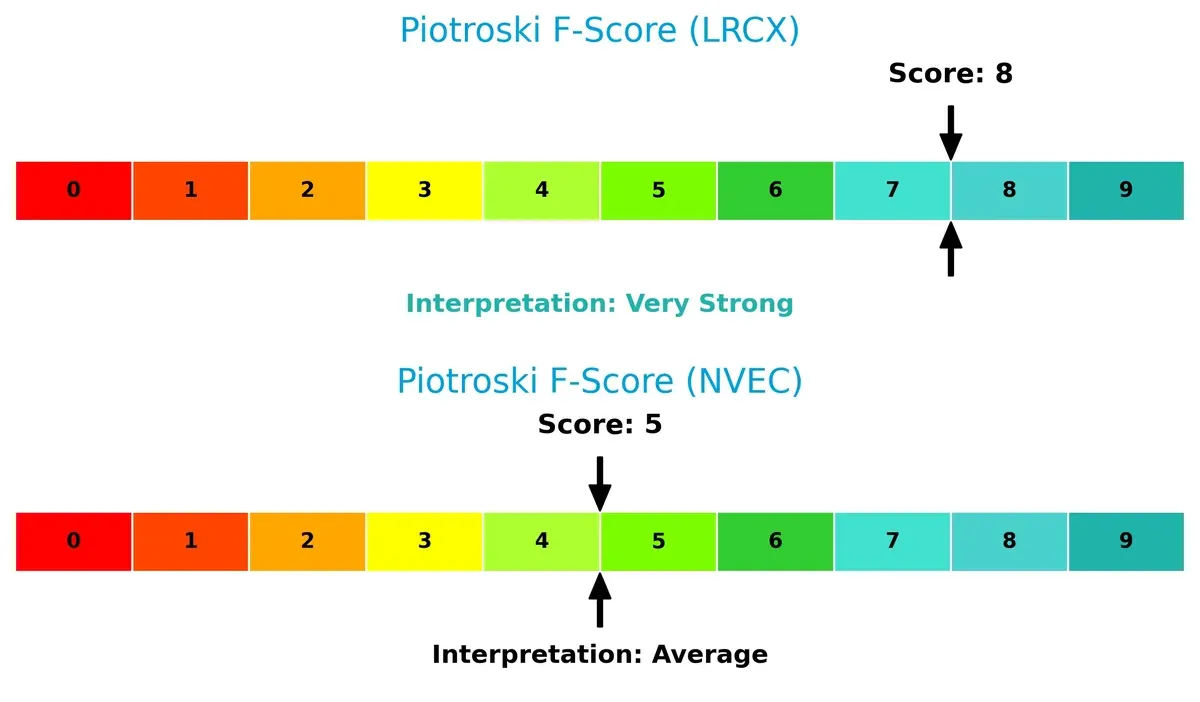
Financial Health: Quality of Operations
Lam Research’s Piotroski F-Score of 8 indicates very strong financial health, outperforming NVE’s average score of 5, which raises mild red flags in internal financial metrics:
How are the two companies positioned?
This section dissects the operational DNA of Lam Research and NVE by comparing their revenue distribution and internal dynamics. The goal is to confront their economic moats to reveal which model offers the strongest, most sustainable competitive edge today.
Revenue Segmentation: The Strategic Mix
This visual comparison dissects how Lam Research and NVE Corporation diversify their income streams and where their primary sector bets lie:
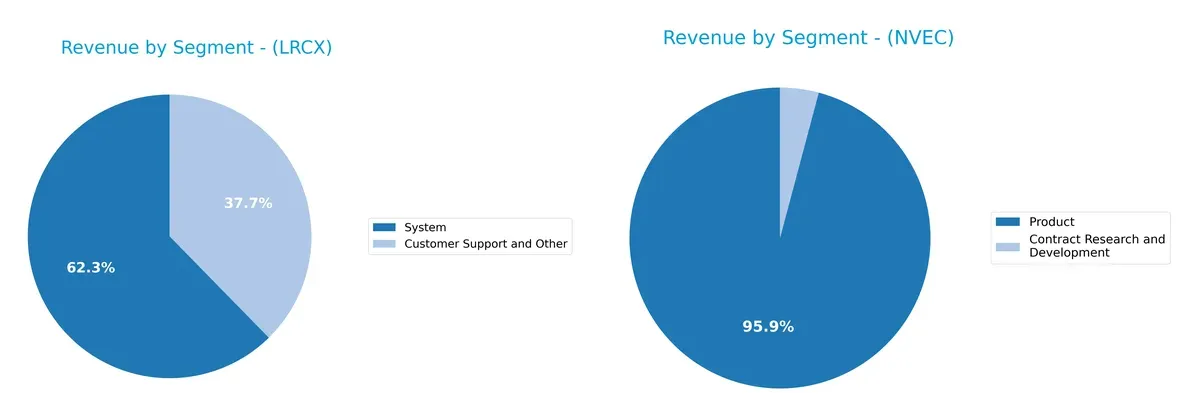
Lam Research anchors its revenue heavily in the System segment, generating $11.5B in 2025, while Customer Support adds $6.9B, showing moderate diversification. NVE Corporation, by contrast, pivots almost entirely on Product sales at $25.9M, with minimal contribution from Contract Research and Development at $1.1M. Lam Research’s broader mix reduces concentration risk, while NVE’s reliance on a single segment signals vulnerability but potential focus-driven innovation.
Strengths and Weaknesses Comparison
This table compares the Strengths and Weaknesses of Lam Research Corporation and NVE Corporation:
Lam Research Corporation Strengths
- Strong profitability with 29% net margin
- High ROE at 54% and ROIC at 34% exceeding WACC
- Healthy liquidity ratios above 1.5
- Low debt levels and strong interest coverage
- Diverse global revenue with significant China and Korea exposure
NVE Corporation Strengths
- Exceptional net margin at 58%
- Solid ROE and ROIC above 20%
- Very low debt and infinite interest coverage
- High fixed asset turnover
- Global presence including strong US and Europe sales
Lam Research Corporation Weaknesses
- WACC exceeds ROIC, indicating capital cost concerns
- High price-to-book ratio may reflect overvaluation
- Dividend yield below 1% offers limited income
- Moderate asset turnover near 0.86 limits efficiency
NVE Corporation Weaknesses
- Extremely high current ratio at 28.4 signals inefficient asset use
- Asset turnover is low at 0.4, reducing asset productivity
- Price-to-book ratio unfavorable compared to peers
- Dividend yield moderate but not standout
Both companies demonstrate robust profitability and low leverage, essential for sustainable growth. Lam Research shows stronger capital efficiency but faces valuation and cost of capital challenges. NVE excels in margin but reveals operational inefficiencies with very high liquidity and low asset turnover, which could affect capital deployment strategies.
The Moat Duel: Analyzing Competitive Defensibility
A structural moat is the sole shield protecting long-term profits from relentless competition erosion. Let’s explore how these two chipmakers defend their ground:
Lam Research Corporation: Precision Engineering Moat
Lam’s moat stems from its intangible assets and specialized semiconductor equipment technology. This delivers a robust 22% ROIC premium above WACC, with margin stability and strong revenue growth. Expansion into advanced wafer cleaning and deposition systems in 2026 should deepen this advantage.
NVE Corporation: Spintronics Niche Moat
NVE leverages proprietary spintronic technology, a narrow but high-margin moat distinct from Lam’s broad equipment base. It commands an 11.7% ROIC premium over WACC, showing rapid ROIC growth despite recent revenue dips. Innovation in IoT sensors offers upside to disrupt adjacent markets.
Capital Efficiency vs. Niche Innovation: Who Holds the Superior Moat?
Lam Research’s wider moat combines scale and consistent value creation, outpacing NVE’s smaller, though rapidly growing, niche moat. Lam’s diverse product portfolio better equips it to defend and expand market share against competitors through 2026 and beyond.
Which stock offers better returns?
Over the past year, Lam Research surged sharply with accelerating gains, while NVE Corporation experienced a steady decline, reflecting contrasting trading dynamics and investor sentiment.
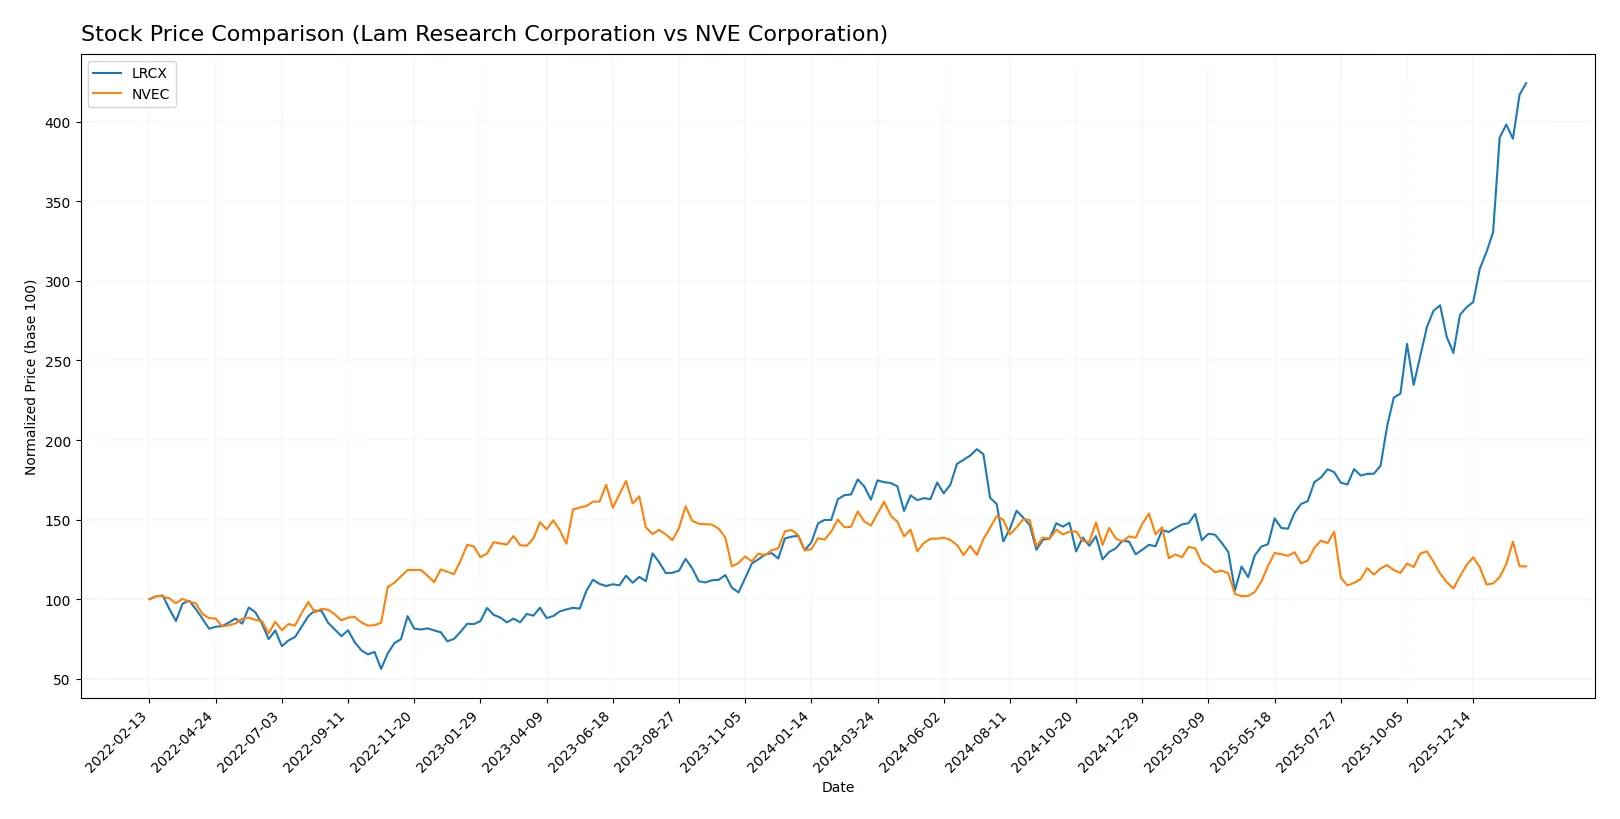
Trend Comparison
Lam Research’s stock price rose 161% over the past 12 months, showing a bullish trend with acceleration and high volatility, ranging from $59.09 to $237.5.
NVE Corporation’s stock fell 17.6% over the same period, marking a bearish trend despite acceleration, with moderate volatility and a price range of $56.99 to $90.18.
Lam Research outperformed NVE Corporation, delivering the highest market returns with strong upward momentum and buyer dominance.
Target Prices
Lam Research Corporation shows a strong target consensus from recognized analysts.
| Company | Target Low | Target High | Consensus |
|---|---|---|---|
| Lam Research Corporation | 127 | 325 | 266.76 |
Analysts expect Lam Research’s stock to rise to 267 on average, about 12% above its current price of 237.5. This signals confidence in its semiconductor equipment leadership.
No verified target price data is available for NVE Corporation.

Don’t Let Luck Decide Your Entry Point
Optimize your entry points with our advanced ProRealTime indicators. You’ll get efficient buy signals with precise price targets for maximum performance. Start outperforming now!
How do institutions grade them?
Below is a summary of the latest institutional grades for Lam Research Corporation and NVE Corporation:
Lam Research Corporation Grades
The following table shows the most recent grades from major financial institutions for Lam Research Corporation:
| Grading Company | Action | New Grade | Date |
|---|---|---|---|
| UBS | Maintain | Buy | 2026-01-29 |
| Wells Fargo | Maintain | Overweight | 2026-01-29 |
| JP Morgan | Maintain | Overweight | 2026-01-29 |
| RBC Capital | Maintain | Outperform | 2026-01-29 |
| Citigroup | Maintain | Buy | 2026-01-29 |
| Stifel | Maintain | Buy | 2026-01-29 |
| Morgan Stanley | Maintain | Equal Weight | 2026-01-29 |
| Needham | Maintain | Buy | 2026-01-29 |
| Susquehanna | Maintain | Positive | 2026-01-29 |
| Goldman Sachs | Maintain | Buy | 2026-01-29 |
Which company has the best grades?
Lam Research Corporation has multiple strong buy and outperform ratings from reputable institutions. NVE Corporation lacks any institutional grades currently. Investors might view Lam Research as more favorably assessed, potentially affecting market confidence and liquidity.
Risks specific to each company
The following categories identify critical pressure points and systemic threats facing Lam Research Corporation and NVE Corporation in the 2026 market environment:
1. Market & Competition
Lam Research Corporation
- Operates in a highly competitive semiconductor equipment market with global giants; faces pressure from rapid innovation cycles.
NVE Corporation
- Niche spintronics market with limited direct competitors but smaller scale limits market influence and growth potential.
2. Capital Structure & Debt
Lam Research Corporation
- Moderate leverage with a debt-to-equity ratio of 0.48 and strong interest coverage at 33.4x, indicating financial stability.
NVE Corporation
- Extremely low debt levels (D/E 0.01) and infinite interest coverage, reflecting a conservative capital structure and low financial risk.
3. Stock Volatility
Lam Research Corporation
- Beta of 1.78 signals higher volatility than the market, exposing investors to greater price swings.
NVE Corporation
- Beta of 1.20 suggests moderately higher volatility but lower than Lam Research, implying less market sensitivity.
4. Regulatory & Legal
Lam Research Corporation
- Exposure to complex international trade regulations and export controls, especially given China’s semiconductor policies.
NVE Corporation
- Smaller international footprint reduces regulatory complexity but spintronics technology may face evolving patent and compliance risks.
5. Supply Chain & Operations
Lam Research Corporation
- Global supply chain exposed to semiconductor material shortages and geopolitical tensions impacting Asia operations.
NVE Corporation
- Limited scale and specialized suppliers may create bottlenecks but supply chain is less complex overall.
6. ESG & Climate Transition
Lam Research Corporation
- Faces high pressure to reduce carbon footprint in manufacturing and comply with increasing ESG standards in tech sector.
NVE Corporation
- ESG risks are lower due to smaller footprint but must monitor evolving standards on nanotech environmental impact.
7. Geopolitical Exposure
Lam Research Corporation
- Significant exposure to U.S.-China tensions; supply chain and sales vulnerable to trade restrictions and tariffs.
NVE Corporation
- Limited global exposure reduces geopolitical risks, but dependency on U.S. market and defense contracts remains a factor.
Which company shows a better risk-adjusted profile?
Lam Research’s biggest risk lies in geopolitical exposure and supply chain complexity, amplified by its global scale and sector volatility. NVE’s primary risk is its concentration in a niche market with limited diversification and operational scale. Despite Lam’s higher stock volatility, its robust capital structure and diversified market presence offer a stronger risk-adjusted profile. NVE’s extreme current ratio suggests liquidity distortions that merit caution, despite its low leverage. Recent data show Lam Research’s interest coverage of 33.4x versus NVE’s infinite coverage, highlighting Lam’s superior operational cash flow resilience amid global uncertainty.
Final Verdict: Which stock to choose?
Lam Research Corporation’s superpower lies in its unmatched capital efficiency and robust profitability, reflected in its high and growing ROIC well above cost of capital. Its point of vigilance is a relatively high price-to-book ratio, which may signal premium valuation risks. It fits well in an Aggressive Growth portfolio seeking durable competitive advantage.
NVE Corporation commands a strategic moat through its impressive gross margins and net margin safety, driven by niche expertise and minimal debt. It offers a safer profile than Lam Research, albeit with recent revenue softness. NVE suits a GARP (Growth at a Reasonable Price) portfolio focused on quality combined with valuation discipline.
If you prioritize efficient capital deployment and strong earnings growth, Lam Research outshines with its durable moat and bullish momentum. However, if you seek stability and margin resilience with a more conservative valuation, NVE offers better safety and defensive characteristics. Both present compelling but distinct analytical scenarios depending on your risk appetite and investment horizon.
Disclaimer: Investment carries a risk of loss of initial capital. The past performance is not a reliable indicator of future results. Be sure to understand risks before making an investment decision.
Go Further
I encourage you to read the complete analyses of Lam Research Corporation and NVE Corporation to enhance your investment decisions: