Home > Comparison > Technology > LRCX vs NVMI
The strategic rivalry between Lam Research Corporation and Nova Ltd. shapes the semiconductor industry’s evolution. Lam Research operates as a capital-intensive leader in semiconductor processing equipment, while Nova Ltd. specializes in precision process control systems. This head-to-head captures a fundamental contrast: scale and manufacturing depth versus technological niche expertise. This analysis aims to identify which corporate trajectory offers the superior risk-adjusted outlook for a diversified portfolio navigating this dynamic sector.
Table of contents
Companies Overview
Lam Research and Nova Ltd. each hold critical roles in semiconductor manufacturing with distinct market footprints and technological strengths.
Lam Research Corporation: Semiconductor Processing Equipment Leader
Lam Research dominates the semiconductor equipment market by designing and servicing advanced wafer fabrication tools. Its revenue stems from sales of etch, deposition, and cleaning systems critical for integrated circuit production. In 2026, Lam focuses on expanding its high-precision plasma and atomic layer deposition technologies to enhance chip manufacturing efficiency worldwide.
Nova Ltd.: Precision Process Control Specialist
Nova Ltd. excels in process control systems that optimize semiconductor manufacturing accuracy. It generates revenue through metrology platforms measuring film thickness, dimension, and chemical properties across multiple fabrication steps. The company’s 2026 strategy emphasizes expanding its footprint in lithography and advanced packaging markets to support foundries and memory manufacturers globally.
Strategic Collision: Similarities & Divergences
Both companies serve the semiconductor industry but with different philosophies: Lam builds hardware-intensive fabrication tools, while Nova provides software-driven process control solutions. Their competition centers on enabling chipmakers to improve yield and performance. Investors must weigh Lam’s capital-intensive manufacturing scale against Nova’s niche focus on precision metrology for a distinct risk-reward balance.
Income Statement Comparison
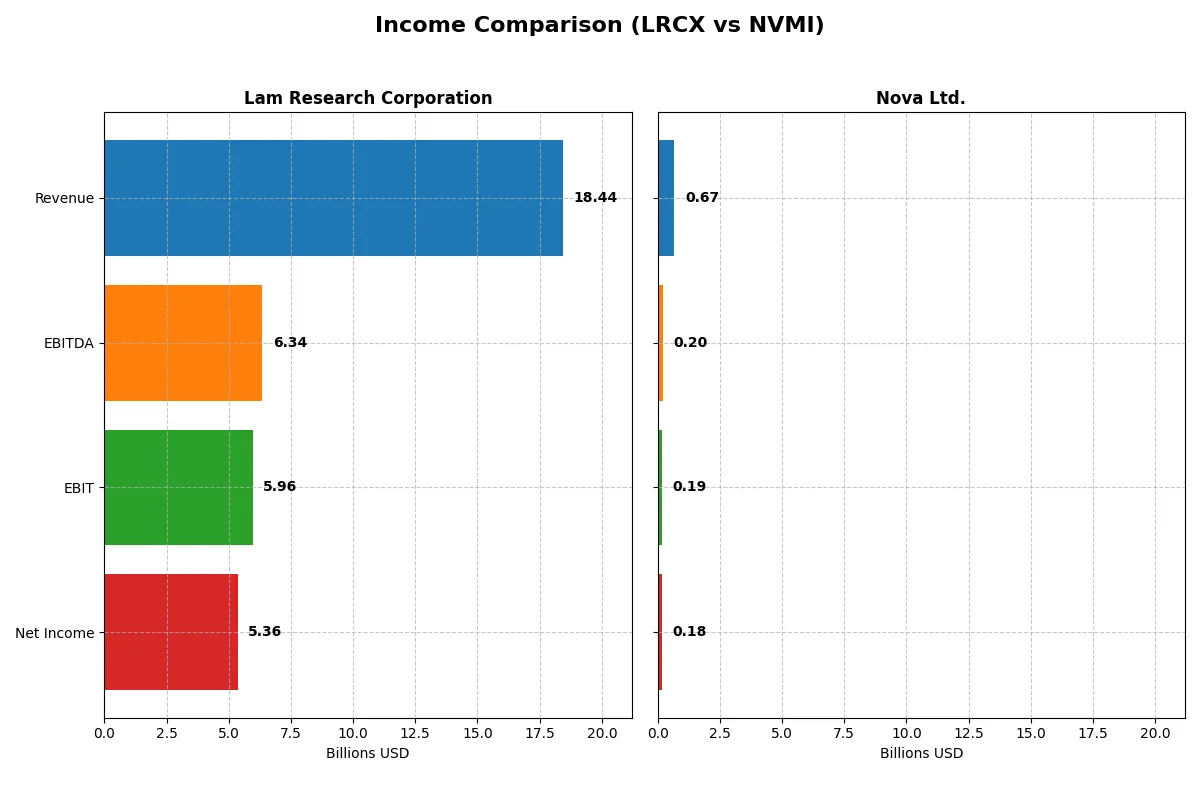
This data dissects the core profitability and scalability of both corporate engines to reveal who dominates the bottom line:
| Metric | Lam Research Corporation (LRCX) | Nova Ltd. (NVMI) |
|---|---|---|
| Revenue | 18.44B | 672M |
| Cost of Revenue | 9.46B | 285M |
| Operating Expenses | 3.08B | 200M |
| Gross Profit | 8.98B | 387M |
| EBITDA | 6.34B | 205M |
| EBIT | 5.96B | 188M |
| Interest Expense | 178M | 1.61M |
| Net Income | 5.36B | 184.9M |
| EPS | 4.17 | 6.31 |
| Fiscal Year | 2025 | 2024 |
Income Statement Analysis: The Bottom-Line Duel
This income statement comparison exposes the operational efficiency and profitability momentum of two leading semiconductor equipment firms.
Lam Research Corporation Analysis
Lam Research’s revenue climbed steadily from 14.6B in 2021 to 18.4B in 2025, pushing net income up 37% over five years to 5.36B. Its gross margin holds firm near 49%, and a net margin of 29% reveals strong cost control. In 2025, Lam’s 23.7% revenue growth and 31% EBIT surge underscore accelerating operational efficiency and robust profitability.
Nova Ltd. Analysis
Nova Ltd. demonstrated rapid expansion, with revenue soaring 150% from 269M in 2020 to 672M in 2024. Net income skyrocketed 284% to 184M, supported by a superior gross margin of 58%. The 2024 fiscal year showed a sharp 30% revenue increase and 20% EBIT growth, reflecting aggressive scaling and improving cost discipline, though net margin growth moderated to a neutral pace.
Verdict: Scale Stability vs. High-Growth Agility
Lam Research outperforms in absolute profitability and margin consistency, benefiting from scale and operational leverage. Nova excels in growth velocity and margin expansion but remains smaller in scale. Investors seeking steady, high-margin cash flow may prefer Lam, while those favoring rapid growth and margin improvement might lean toward Nova’s dynamic profile.
Financial Ratios Comparison
These vital ratios act as a diagnostic tool to expose the underlying fiscal health, valuation premiums, and capital efficiency of the companies compared below:
| Ratios | Lam Research Corporation (LRCX) | Nova Ltd. (NVMI) |
|---|---|---|
| ROE | 54.3% (2025) | 19.8% (2024) |
| ROIC | 34.0% (2025) | 13.4% (2024) |
| P/E | 23.4 (2025) | 31.2 (2024) |
| P/B | 12.7 (2025) | 6.2 (2024) |
| Current Ratio | 2.21 (2025) | 2.32 (2024) |
| Quick Ratio | 1.55 (2025) | 1.92 (2024) |
| D/E | 0.48 (2025) | 0.25 (2024) |
| Debt-to-Assets | 22.3% (2025) | 17.0% (2024) |
| Interest Coverage | 33.1 (2025) | 116.2 (2024) |
| Asset Turnover | 0.86 (2025) | 0.48 (2024) |
| Fixed Asset Turnover | 7.59 (2025) | 5.06 (2024) |
| Payout Ratio | 21.5% (2025) | 0% (2024) |
| Dividend Yield | 0.92% (2025) | 0% (2024) |
| Fiscal Year | 2025 | 2024 |
Efficiency & Valuation Duel: The Vital Signs
Financial ratios act as a company’s DNA, unveiling hidden risks and operational strengths beyond headline numbers.
Lam Research Corporation
Lam Research delivers exceptional profitability with a 54.33% ROE and a robust 29.06% net margin, signaling operational excellence. The P/E of 23.36 suggests a neutral valuation, while a high PB of 12.69 appears stretched. Shareholders receive modest dividends at 0.92%, complemented by solid reinvestment into R&D, fueling future growth.
Nova Ltd.
Nova Ltd. shows solid but lower profitability with a 19.81% ROE and a 27.33% net margin, reflecting efficient operations despite smaller scale. The stock trades at a higher P/E of 31.2, indicating an expensive valuation. No dividends are paid, as Nova prioritizes aggressive R&D spending to support its expansion strategy.
Premium Valuation vs. Operational Safety
Lam Research offers superior returns on equity and capital with a more balanced valuation, while Nova’s stock trades at a premium despite lower profitability. Investors favoring operational safety and steady returns may lean towards Lam, whereas growth-focused investors might consider Nova’s aggressive reinvestment approach.
Which one offers the Superior Shareholder Reward?
Lam Research Corporation (LRCX) pays a modest dividend yield around 0.9% with a sustainable payout ratio near 21%, supported by strong free cash flow coverage above 3x. Its buyback intensity remains robust, enhancing total shareholder returns. Nova Ltd. (NVMI) eschews dividends, reinvesting heavily in growth with free cash flow near 7.5/share and a zero payout ratio. Despite no dividends, NVMI’s buybacks are moderate, and its reinvestment strategy targets long-term value via R&D and acquisitions. I find LRCX’s balanced distribution—combining steady dividends and aggressive buybacks—more sustainable and attractive for total return in 2026.
Comparative Score Analysis: The Strategic Profile
The radar chart reveals the fundamental DNA and trade-offs of Lam Research Corporation and Nova Ltd., highlighting their financial strengths and valuation nuances:
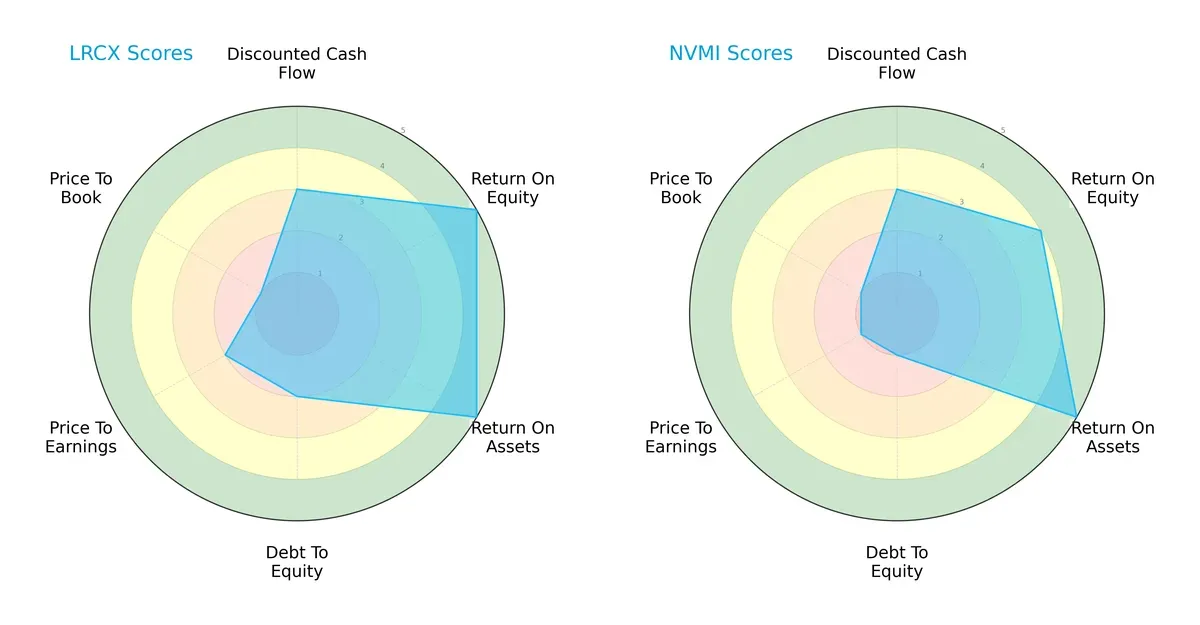
Lam Research presents a more balanced profile with very favorable ROE and ROA scores, indicating operational efficiency. Nova Ltd. lags slightly in ROE but matches LRCX in ROA. However, Nova’s debt-to-equity and valuation scores are weaker, signaling higher financial risk and potential overvaluation. Lam Research relies on robust profitability, while Nova shows vulnerability on leverage and market pricing metrics.
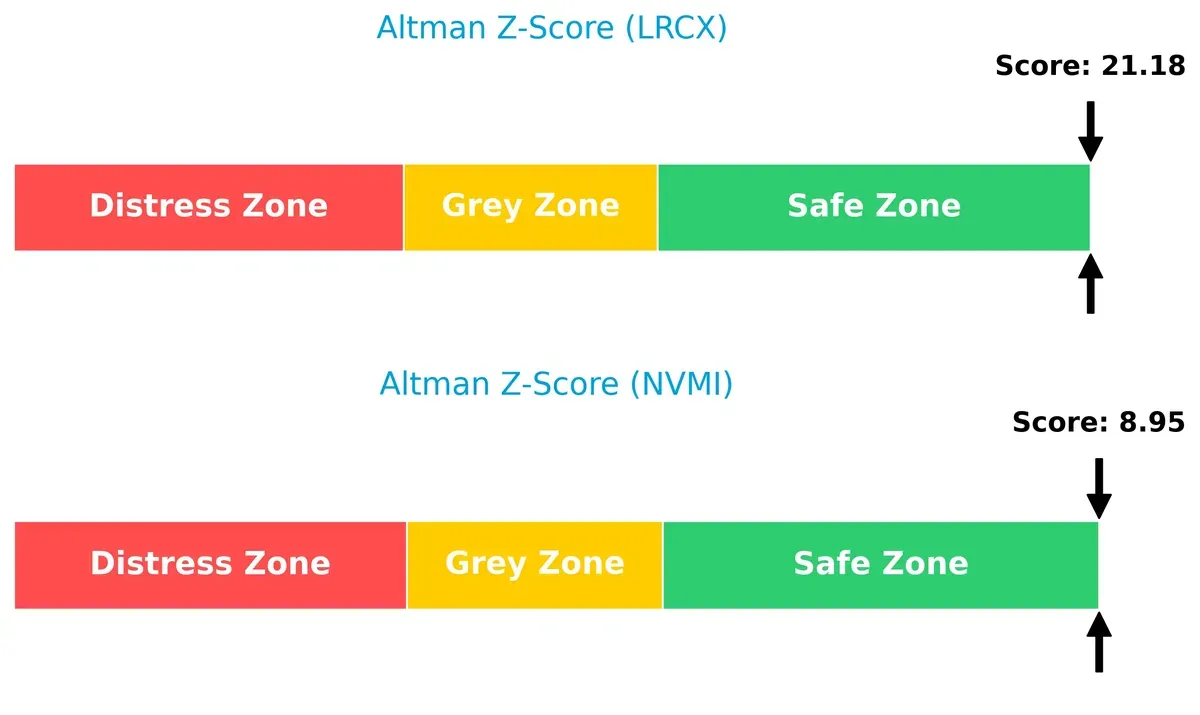
Bankruptcy Risk: Solvency Showdown
Lam Research’s Altman Z-Score of 21.2 dwarfs Nova Ltd.’s 8.95, both safely above distress thresholds, but indicating a stronger solvency position for LRCX in this cycle:
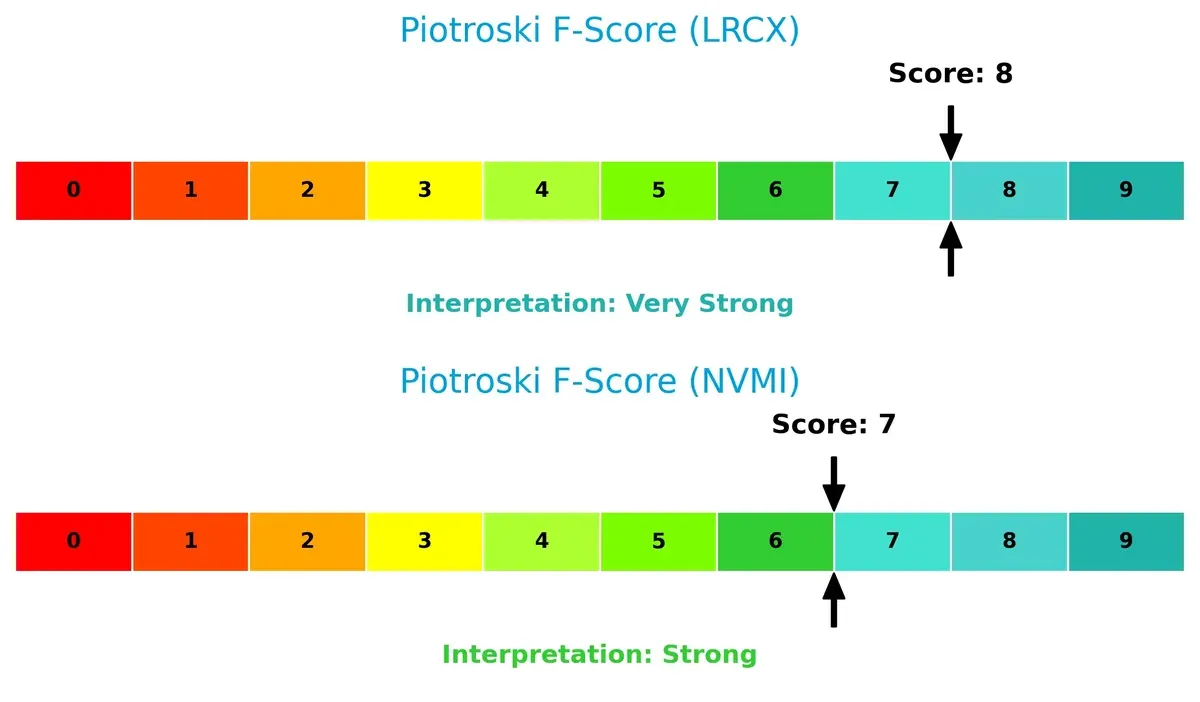
Financial Health: Quality of Operations
Lam Research scores an 8 out of 9 on the Piotroski F-Score, surpassing Nova’s 7, reflecting superior financial health and operational quality with fewer red flags:
How are the two companies positioned?
This section dissects Lam Research and Nova’s operational DNA by comparing their revenue distribution and internal dynamics. The goal is to confront their economic moats and identify which business model offers the most resilient, sustainable competitive advantage today.
Revenue Segmentation: The Strategic Mix
This visual comparison dissects how Lam Research Corporation and Nova Ltd. diversify their income streams and where their primary sector bets lie:
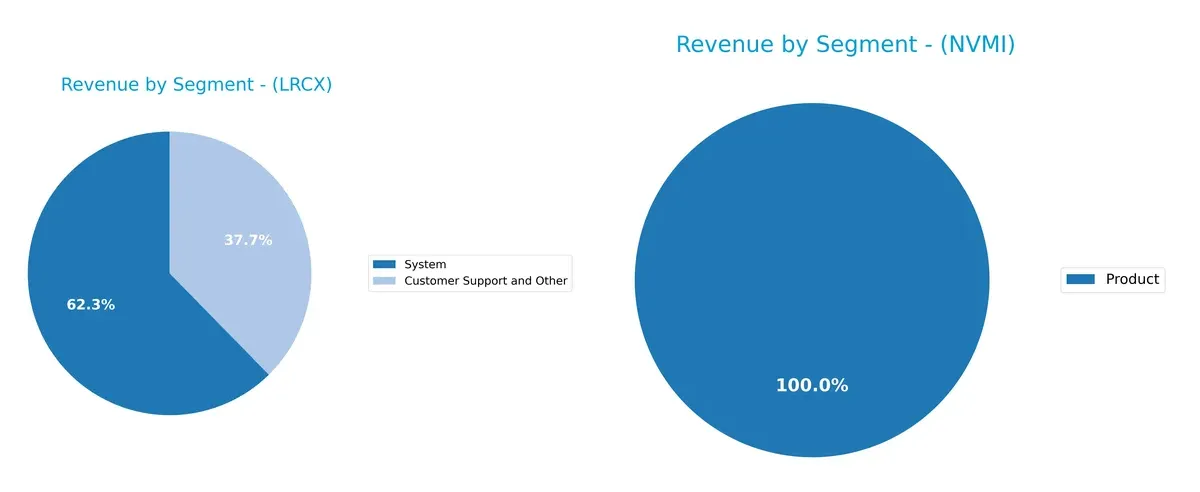
Lam Research dominates with a two-segment model: Systems at $11.5B and Customer Support at $6.9B in 2025, reflecting ecosystem lock-in through hardware plus service. Nova Ltd. pivots entirely on a single Product segment, $538M in 2024, showing concentration risk but focused specialization. Lam’s diversified structure anchors stability; Nova’s narrow base demands careful monitoring amid market shifts.
Strengths and Weaknesses Comparison
This table compares the strengths and weaknesses of Lam Research Corporation and Nova Ltd.:
Lam Research Corporation Strengths
- Strong profitability with 29.06% net margin
- High ROE at 54.33% and ROIC of 34%
- Solid liquidity ratios: current ratio 2.21, quick ratio 1.55
- Moderate leverage: debt-to-assets 22.28%
- Diverse product segments: Systems and Customer Support
- Broad global presence, especially in China, Korea, and Taiwan
Nova Ltd. Strengths
- Favorable profitability with 27.33% net margin
- Positive ROE of 19.81% and ROIC of 13.39%
- Strong liquidity: current ratio 2.32, quick ratio 1.92
- Low financial leverage: debt-to-assets 16.98%
- Very high interest coverage at 116.2
- Focused product line with steady revenue growth
Lam Research Corporation Weaknesses
- WACC exceeds ROIC, indicating higher capital costs
- High price-to-book ratio at 12.69, suggesting overvaluation
- Dividend yield low at 0.92%
- Neutral asset turnover at 0.86 limits efficiency insights
- Dependence on large markets like China may increase geopolitical risk
Nova Ltd. Weaknesses
- WACC also above ROIC, pressuring returns
- High P/E of 31.2 and unfavorable PB ratio at 6.18
- Zero dividend yield may deter income investors
- Unfavorable asset turnover at 0.48 signals lower asset efficiency
- Single product focus limits diversification
Lam Research shows strong financial metrics and global diversification but faces capital cost challenges and valuation risks. Nova maintains solid profitability and liquidity with low leverage but has concentration risks and weaker asset efficiency. Both companies must balance growth and capital allocation amid their structural weaknesses.
The Moat Duel: Analyzing Competitive Defensibility
A structural moat is the only true defense safeguarding long-term profits from relentless competitive erosion. Here’s how two semiconductor players stack up:
Lam Research Corporation: Durable Tech Excellence
Lam Research’s moat stems from proprietary manufacturing equipment and process expertise. It shows in a strong 21.9% ROIC premium over WACC and stable 29% net margins. Expansion into advanced wafer cleaning and etch markets in 2026 should deepen this edge.
Nova Ltd.: Rapidly Improving Process Control
Nova leans on its specialized metrology systems for semiconductor process control, a niche distinct from Lam’s broader equipment scope. ROIC currently lags WACC by a slight margin, but a sharp 70% ROIC growth signals improving competitive positioning, with new platform rollouts set to accelerate in 2026.
Moat Resilience: Precision Manufacturing vs. Process Innovation
Lam’s wider moat reflects established market dominance and consistent high returns. Nova’s faster ROIC growth suggests a narrowing gap but not yet a durable advantage. Lam Research is better positioned to defend market share amid intensifying industry competition.
Which stock offers better returns?
The past year showed strong upward price movements for both Lam Research Corporation and Nova Ltd., with accelerating bullish trends and rising trading volumes.
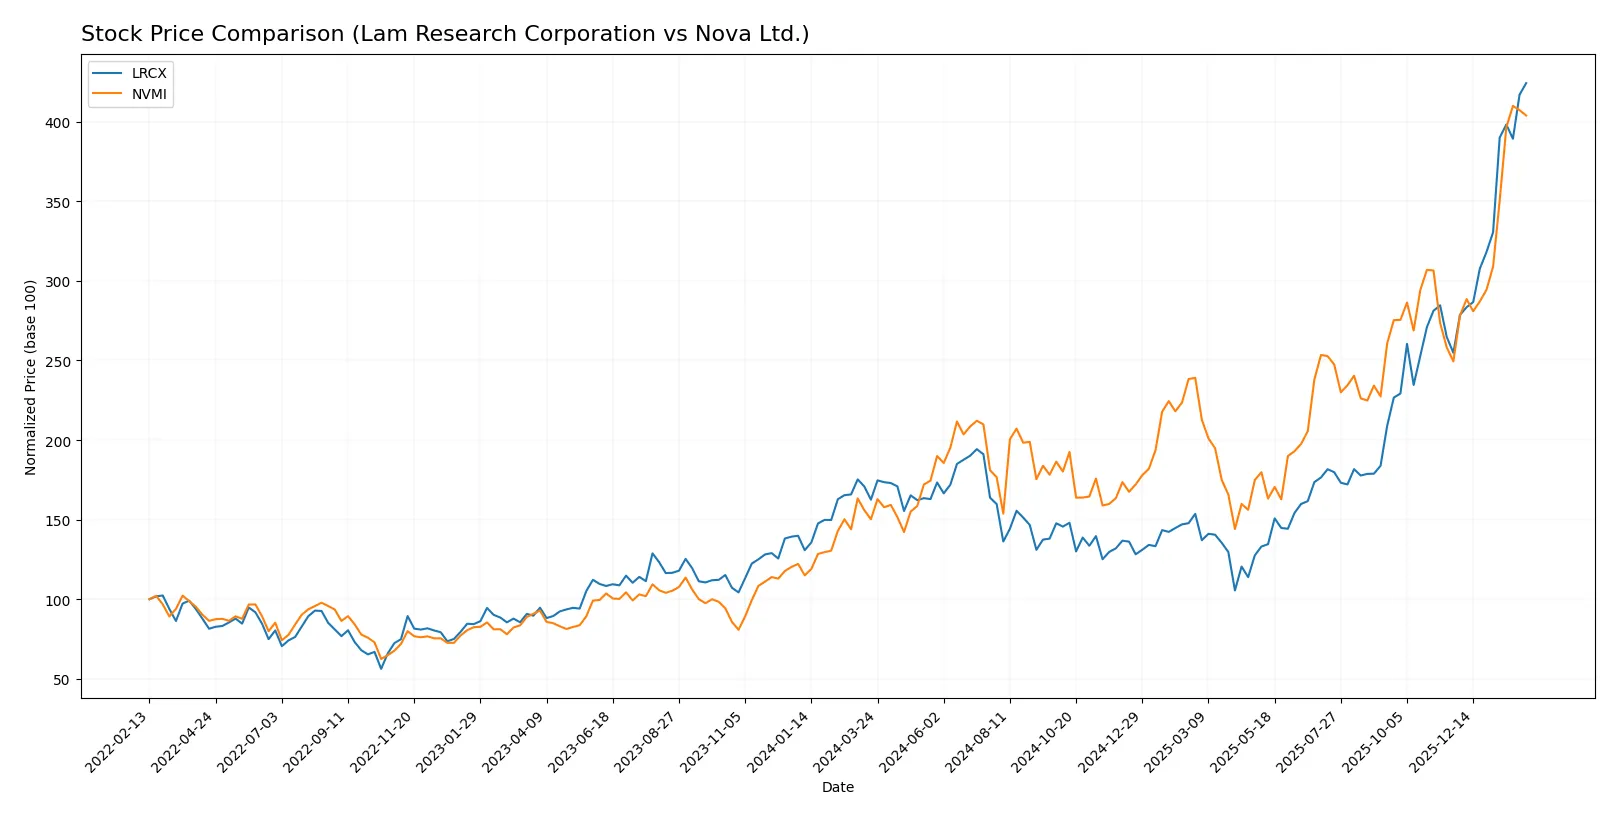
Trend Comparison
Lam Research Corporation’s stock gained 161% over the past 12 months, marking a bullish trend with accelerating momentum. Prices ranged from 59.09 to a high of 237.5, supported by increasing buyer dominance.
Nova Ltd. posted a 169% rise over the same period, also bullish with acceleration. It experienced higher volatility, with a wider price range between 159.92 and 460.91, and strong buyer presence driving the trend.
Comparing both, Nova Ltd. delivered the highest market performance with a 169% gain, outpacing Lam Research’s 161% rise, despite greater volatility.
Target Prices
Analysts present a robust target consensus for both Lam Research Corporation and Nova Ltd., reflecting strong sector momentum.
| Company | Target Low | Target High | Consensus |
|---|---|---|---|
| Lam Research Corporation | 127 | 325 | 266.76 |
| Nova Ltd. | 335 | 500 | 408.33 |
The target consensus for Lam Research sits 12% above its current price of $237.5, suggesting moderate upside. Nova Ltd.’s consensus target at $408.33 is below its current price of $454.15, indicating expectations for a potential correction.

Don’t Let Luck Decide Your Entry Point
Optimize your entry points with our advanced ProRealTime indicators. You’ll get efficient buy signals with precise price targets for maximum performance. Start outperforming now!
How do institutions grade them?
The following tables summarize recent institutional grades for Lam Research Corporation and Nova Ltd.:
Lam Research Corporation Grades
This table shows the latest grades from leading financial institutions for Lam Research Corporation.
| Grading Company | Action | New Grade | Date |
|---|---|---|---|
| UBS | Maintain | Buy | 2026-01-29 |
| Wells Fargo | Maintain | Overweight | 2026-01-29 |
| JP Morgan | Maintain | Overweight | 2026-01-29 |
| RBC Capital | Maintain | Outperform | 2026-01-29 |
| Citigroup | Maintain | Buy | 2026-01-29 |
| Stifel | Maintain | Buy | 2026-01-29 |
| Morgan Stanley | Maintain | Equal Weight | 2026-01-29 |
| Needham | Maintain | Buy | 2026-01-29 |
| Susquehanna | Maintain | Positive | 2026-01-29 |
| Goldman Sachs | Maintain | Buy | 2026-01-29 |
Nova Ltd. Grades
Below are the recent institutional grades for Nova Ltd. from recognized grading companies.
| Grading Company | Action | New Grade | Date |
|---|---|---|---|
| Needham | Upgrade | Buy | 2026-01-20 |
| B of A Securities | Maintain | Buy | 2026-01-13 |
| Jefferies | Maintain | Buy | 2025-12-15 |
| Evercore ISI Group | Maintain | Outperform | 2025-11-07 |
| Benchmark | Maintain | Buy | 2025-11-07 |
| Cantor Fitzgerald | Maintain | Overweight | 2025-06-24 |
| B of A Securities | Maintain | Buy | 2025-06-24 |
| Citigroup | Maintain | Buy | 2025-05-09 |
| Benchmark | Maintain | Buy | 2025-05-09 |
| B of A Securities | Maintain | Buy | 2025-04-16 |
Which company has the best grades?
Lam Research Corporation has a broader consensus of “Buy” and “Outperform” ratings, signaling stronger institutional confidence. Nova Ltd. also receives positive grades but with fewer “Outperform” endorsements. Investors may interpret Lam Research’s consistently higher grades as a reflection of greater market trust.
Risks specific to each company
The following categories identify the critical pressure points and systemic threats facing both firms in the 2026 market environment:
1. Market & Competition
Lam Research Corporation
- Large market cap and strong semiconductor equipment portfolio support competitive position.
Nova Ltd.
- Smaller market cap with niche metrology focus faces intense competition from larger players.
2. Capital Structure & Debt
Lam Research Corporation
- Moderate debt-to-equity ratio (0.48) with strong interest coverage (33.43) signals manageable leverage.
Nova Ltd.
- Lower debt-to-equity (0.25) and very high interest coverage (116.2) indicate robust balance sheet.
3. Stock Volatility
Lam Research Corporation
- Beta of 1.779 suggests above-market volatility, typical for semiconductor sector leaders.
Nova Ltd.
- Slightly higher beta (1.818) points to greater price swings and risk for investors.
4. Regulatory & Legal
Lam Research Corporation
- US-based with exposure to export controls and trade policies affecting semiconductor supply chain.
Nova Ltd.
- Israeli headquarters expose firm to regional regulatory risks and export restrictions.
5. Supply Chain & Operations
Lam Research Corporation
- Global manufacturing footprint supports resilience but vulnerable to geopolitical tensions.
Nova Ltd.
- Smaller scale operations may face higher disruption risk from supply chain bottlenecks.
6. ESG & Climate Transition
Lam Research Corporation
- Increasing ESG focus required to meet investor expectations and regulatory standards.
Nova Ltd.
- ESG initiatives less mature; could face higher transition costs amid tightening regulations.
7. Geopolitical Exposure
Lam Research Corporation
- Significant exposure to China and Asia-Pacific trade dynamics.
Nova Ltd.
- High geopolitical risk due to Middle East location and reliance on global semiconductor markets.
Which company shows a better risk-adjusted profile?
Lam Research faces its greatest risk from geopolitical and regulatory pressures in Asia-Pacific but boasts a stronger balance sheet and operational scale. Nova Ltd. contends with higher stock volatility and geopolitical risks but benefits from an exceptionally strong interest coverage and conservative leverage. Overall, Lam Research exhibits a better risk-adjusted profile due to its diversified footprint, higher ROIC (34% vs. 13.4%), and safer Altman Z-Score (21.2 vs. 9.0). The high beta and valuation concerns for Nova heighten its risk despite solid financial health indicators.
Final Verdict: Which stock to choose?
Lam Research’s superpower lies in its robust capital efficiency and consistent value creation. Its very favorable moat, driven by a high ROIC well above WACC, signals a durable competitive edge. A point of vigilance remains its premium valuation metrics that could pressure returns. It suits aggressive growth portfolios seeking quality leadership.
Nova Ltd. offers a compelling strategic moat through its expanding profitability and R&D intensity, fueling rapid revenue gains. While its financial stability lags slightly behind Lam Research, it benefits from a lower debt load and strong cash flow generation. This profile aligns well with GARP investors focused on growth at a reasonable price.
If you prioritize established competitive advantage and capital efficiency, Lam Research outshines with its proven value creation and financial resilience. However, if you seek higher growth potential with improving profitability and a more attractive entry point, Nova Ltd. offers better upside with increased volatility. Both present favorable scenarios but cater to distinct investor appetites.
Disclaimer: Investment carries a risk of loss of initial capital. The past performance is not a reliable indicator of future results. Be sure to understand risks before making an investment decision.
Go Further
I encourage you to read the complete analyses of Lam Research Corporation and Nova Ltd. to enhance your investment decisions: