Home > Comparison > Technology > MU vs LRCX
The strategic rivalry between Micron Technology, Inc. and Lam Research Corporation shapes the semiconductor industry’s evolution. Micron operates as a capital-intensive memory and storage product manufacturer. Lam Research focuses on high-tech semiconductor processing equipment with a specialized service model. This head-to-head highlights a clash between product innovation and advanced manufacturing solutions. This analysis aims to identify which company offers the superior risk-adjusted potential for a diversified technology portfolio.
Table of contents
Companies Overview
Micron Technology and Lam Research stand as pivotal players shaping the semiconductor industry landscape.
Micron Technology, Inc.: Memory and Storage Powerhouse
Micron Technology dominates the semiconductor memory market with its DRAM and NAND products driving revenue. Its business thrives on supplying high-speed memory solutions across cloud servers, mobile devices, and industrial applications. In 2026, Micron sharpened its strategic focus on expanding embedded memory products and optimizing storage technologies to capitalize on growing data demands.
Lam Research Corporation: Semiconductor Equipment Innovator
Lam Research leads in semiconductor fabrication equipment, selling advanced wafer processing and deposition systems globally. Its core revenue stems from enabling integrated circuit manufacturing with precision etch and deposition tools. The company’s 2026 strategy emphasizes innovating plasma-enhanced chemical vapor deposition and etching technologies to meet evolving chip complexity.
Strategic Collision: Similarities & Divergences
Both firms underpin the semiconductor supply chain but differ sharply in focus. Micron centers on memory product manufacturing, while Lam commands semiconductor equipment markets. They compete indirectly where chip complexity fuels demand for memory and processing tools. Investors should note Micron’s asset-heavy manufacturing contrast with Lam’s equipment-driven capital intensity, shaping distinct risk and growth profiles.
Income Statement Comparison
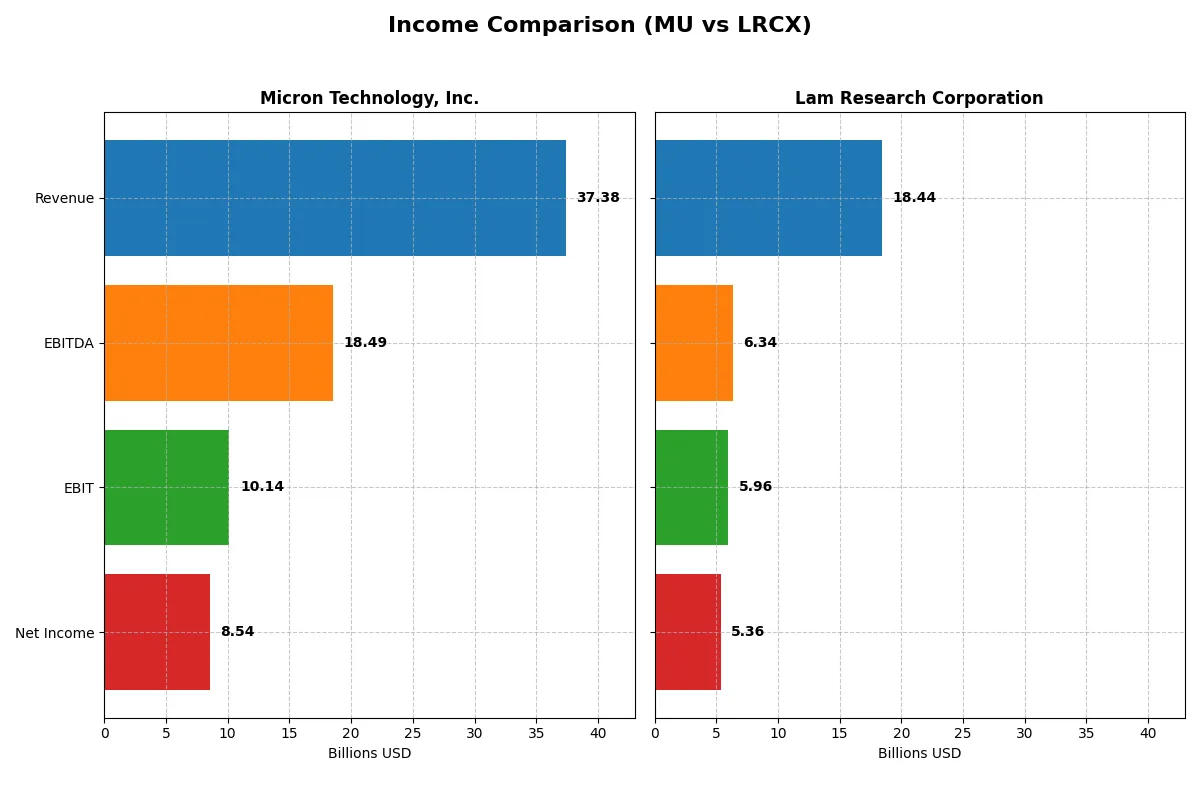
This data dissects the core profitability and scalability of both corporate engines to reveal who dominates the bottom line:
| Metric | Micron Technology, Inc. (MU) | Lam Research Corporation (LRCX) |
|---|---|---|
| Revenue | 37.4B | 18.4B |
| Cost of Revenue | 22.5B | 9.5B |
| Operating Expenses | 5.0B | 3.1B |
| Gross Profit | 14.9B | 9.0B |
| EBITDA | 18.5B | 6.3B |
| EBIT | 10.1B | 6.0B |
| Interest Expense | 477M | 178M |
| Net Income | 8.5B | 5.4B |
| EPS | 7.65 | 4.17 |
| Fiscal Year | 2025 | 2025 |
Income Statement Analysis: The Bottom-Line Duel
Comparing the income statements reveals which company drives profitability more efficiently through its operational engine and margin management.
Micron Technology, Inc. Analysis
Micron’s revenue jumped from 25B in 2024 to 37.4B in 2025, with net income soaring from 778M to 8.5B. Its gross margin stands at a solid 39.8%, while net margin surged to 22.8%, reflecting a sharp turnaround from prior losses. The latest year shows exceptional momentum and impressive margin expansion, signaling operational strength.
Lam Research Corporation Analysis
Lam Research’s revenue increased steadily from 14.9B in 2024 to 18.4B in 2025, with net income growing from 3.8B to 5.4B. Gross margin improved to 48.7%, and net margin rose to 29.1%, underscoring robust profitability. The company maintains consistent margin health and solid earnings growth, demonstrating efficiency and stability in its segment.
Margin Expansion vs. Revenue Acceleration
Micron exhibits explosive revenue and earnings growth, turning previous losses into strong profits with expanding margins. Lam Research delivers steadier but higher margin levels and consistent earnings growth. For investors, Micron’s high momentum suits growth-focused profiles, while Lam appeals to those valuing stable, high-margin profitability.
Financial Ratios Comparison
These vital ratios act as a diagnostic tool to expose the underlying fiscal health, valuation premiums, and capital efficiency of the companies compared below:
| Ratios | Micron Technology, Inc. (MU) | Lam Research Corporation (LRCX) |
|---|---|---|
| ROE | 15.8% | 54.3% |
| ROIC | 12.1% | 34.0% |
| P/E | 15.9 | 23.4 |
| P/B | 2.51 | 12.7 |
| Current Ratio | 2.52 | 2.21 |
| Quick Ratio | 1.79 | 1.55 |
| D/E | 0.28 | 0.48 |
| Debt-to-Assets | 18.5% | 22.3% |
| Interest Coverage | 20.7 | 33.1 |
| Asset Turnover | 0.45 | 0.86 |
| Fixed Asset Turnover | 0.79 | 7.59 |
| Payout Ratio | 6.1% | 21.5% |
| Dividend Yield | 0.38% | 0.92% |
| Fiscal Year | 2025 | 2025 |
Efficiency & Valuation Duel: The Vital Signs
Financial ratios serve as a company’s DNA, revealing hidden risks and operational excellence behind headline numbers.
Micron Technology, Inc.
Micron shows solid profitability with a 15.76% ROE and a strong 22.84% net margin. Its valuation sits at a moderate P/E of 15.94 and P/B of 2.51, marking the stock as fairly priced. Despite a low 0.38% dividend yield, Micron favors reinvestment in R&D, supporting future growth potential amid mixed returns on invested capital.
Lam Research Corporation
Lam Research delivers outstanding profitability, boasting a 54.33% ROE and a 29.06% net margin. It trades at a higher P/E of 23.36 and an expensive P/B of 12.69, reflecting stretched valuation multiples. The company sustains shareholder returns with a 0.92% dividend yield and maintains robust capital efficiency, signaling operational strength alongside premium pricing.
Premium Valuation vs. Operational Safety
Lam Research outperforms on profitability and operational efficiency but trades at a premium valuation. Micron offers a more balanced valuation with decent profitability and reinvestment focus. Investors seeking growth and operational excellence may prefer Lam, while those favoring valuation discipline might lean toward Micron.
Which one offers the Superior Shareholder Reward?
I see Micron Technology (MU) pays a low dividend yield near 0.38% with a conservative 6.1% payout ratio, barely covered by free cash flow. Its buyback activity is modest, leaning on reinvestment in capex and R&D amid cyclical volatility. Lam Research (LRCX) yields a higher 0.92%, with a 21.5% payout ratio and a strong free cash flow coverage near 88%. LRCX aggressively repurchases shares, supported by stable margins and efficient capital allocation. Historically, LRCX’s balanced dividends and robust buybacks offer a more sustainable, superior total shareholder return in 2026 compared to MU’s cautious distribution. I favor Lam Research for disciplined income and growth-driven capital returns.
Comparative Score Analysis: The Strategic Profile
The radar chart reveals the fundamental DNA and trade-offs of Micron Technology and Lam Research Corporation, highlighting their distinct financial strengths and weaknesses:
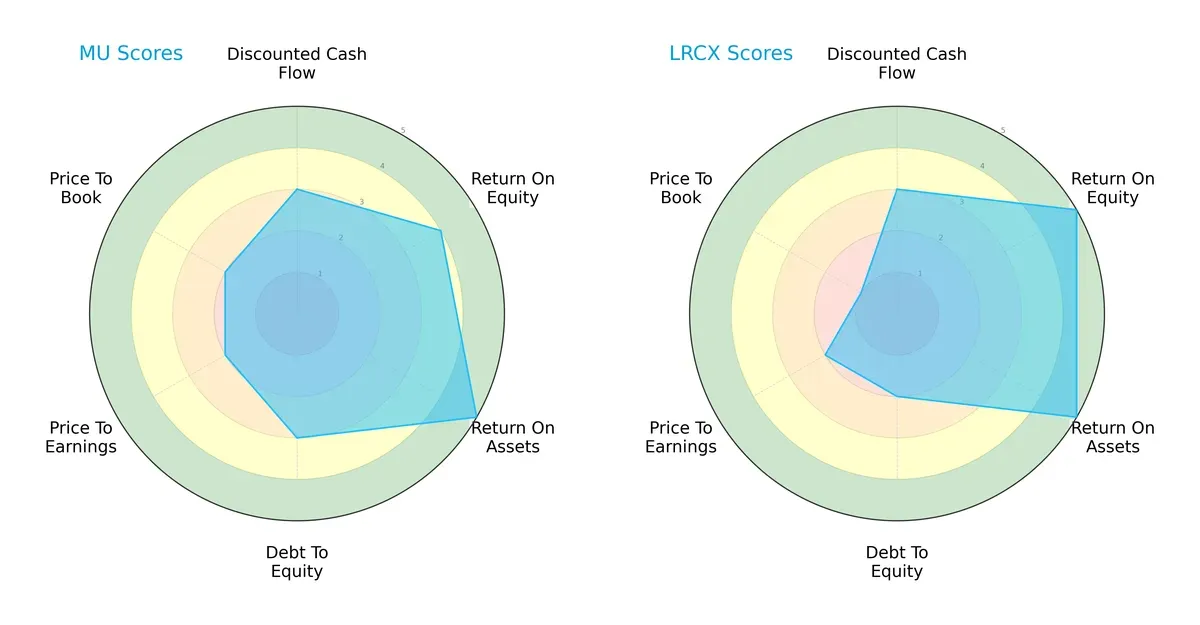
Micron shows solid asset efficiency with a top ROA score (5) and decent ROE (4), balancing moderate leverage and valuation metrics. Lam Research edges out with peak profitability (ROE 5) and equally strong asset use (ROA 5), but carries slightly higher financial risk (Debt/Equity score 2 vs. 3) and a more challenged valuation (P/B score 1). I see Lam relying on superior equity returns while Micron offers a more balanced profile across cash flow and leverage.
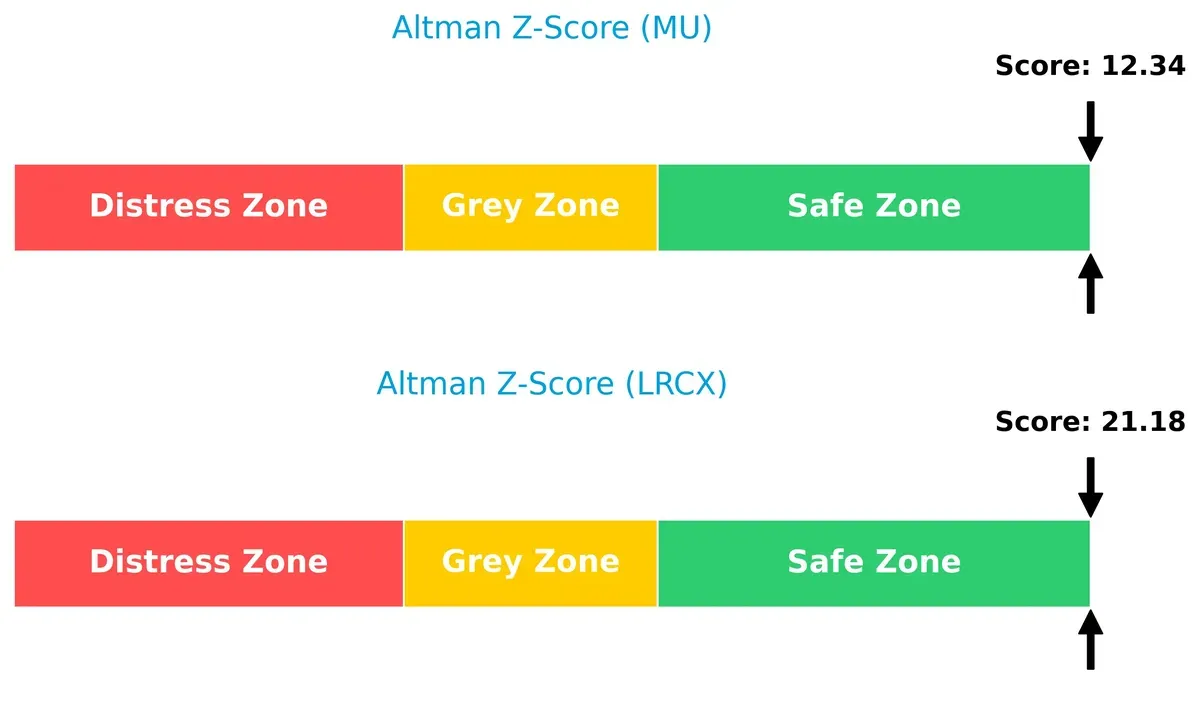
Bankruptcy Risk: Solvency Showdown
Lam Research’s Altman Z-Score of 21.18 far surpasses Micron’s 12.34, both firmly in the safe zone. This gap signals Lam’s superior long-term solvency and resilience in volatile cycles:
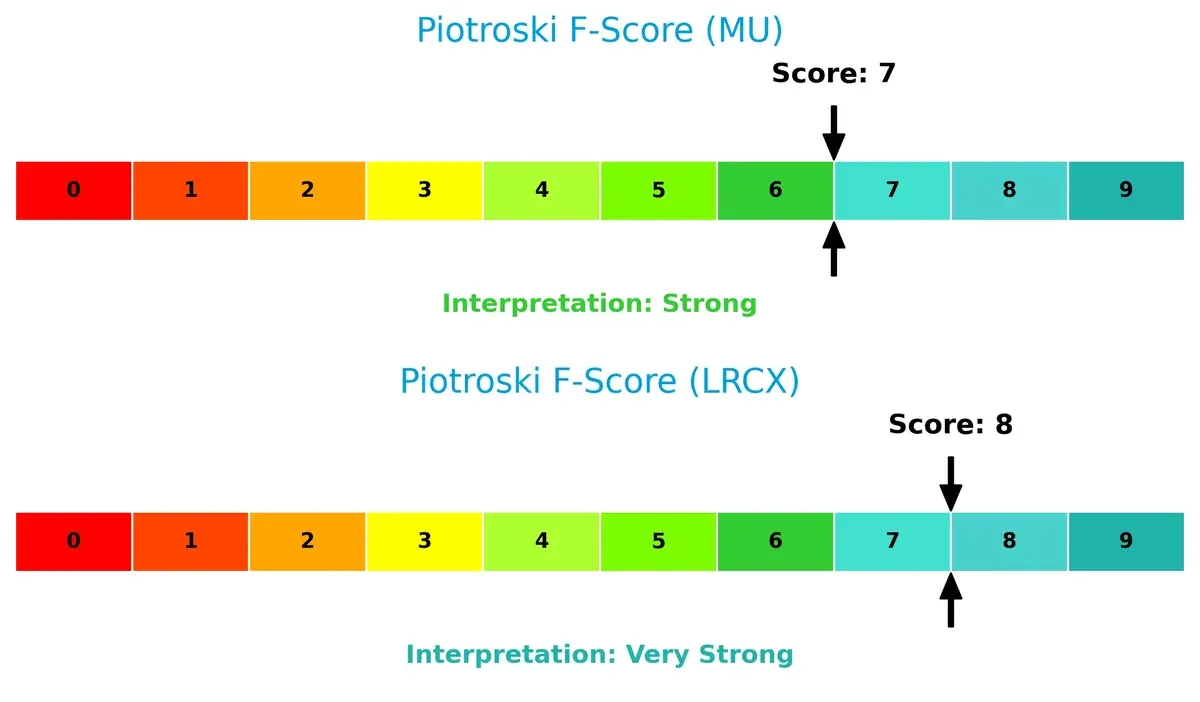
Financial Health: Quality of Operations
Lam Research’s Piotroski F-Score of 8 outperforms Micron’s 7, indicating marginally stronger operational fundamentals and financial discipline. Both firms show robust health, but Micron’s slightly lower score hints at minor red flags in internal metrics:
How are the two companies positioned?
This section dissects Micron Technology and Lam Research’s operational DNA by comparing revenue distribution and internal strengths and weaknesses. The goal is to confront their economic moats to reveal which model offers the most resilient competitive advantage today.
Revenue Segmentation: The Strategic Mix
This visual comparison dissects how Micron Technology and Lam Research diversify their income streams and where their primary sector bets lie:
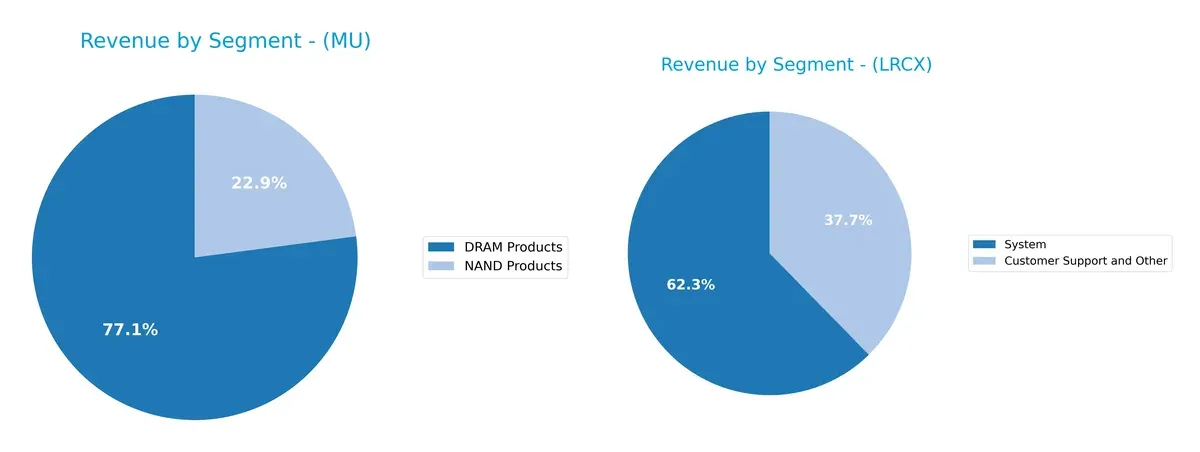
Micron Technology pivots heavily on DRAM Products with $28.6B, dwarfing its NAND segment at $8.5B. This concentration signals reliance on memory chips amid volatile cycles. Conversely, Lam Research balances revenue between System sales at $11.5B and Customer Support at $6.9B, showcasing a diversified mix. Lam’s segmentation reduces concentration risk and leverages infrastructure dominance, while Micron’s focus on DRAM implies exposure to cyclical demand swings in semiconductor memory.
Strengths and Weaknesses Comparison
This table compares the strengths and weaknesses of Micron Technology, Inc. and Lam Research Corporation:
Micron Technology, Inc. Strengths
- Diverse product portfolio including DRAM and NAND segments
- Strong net margin of 22.84% and ROE of 15.76%
- Solid liquidity with current ratio 2.52 and quick ratio 1.79
- Low debt-to-assets ratio at 18.45%
- Significant US and Taiwan revenue base
- Neutral valuation metrics (PE 15.94, PB 2.51)
Lam Research Corporation Strengths
- Higher net margin at 29.06% and exceptional ROE of 54.33%
- Strong ROIC of 34%, outperforming WACC
- Favorable liquidity and interest coverage ratios
- Large global footprint including China, Korea, and Taiwan
- High fixed asset turnover of 7.59 indicating efficient asset use
- Robust system and customer support revenue streams
Micron Technology, Inc. Weaknesses
- ROIC (12.12%) below WACC (22.13%) signals capital inefficiency
- Lower asset turnover ratios (0.45 total, 0.79 fixed)
- Dividend yield low at 0.38%
- Moderate global revenue diversification with heavy US reliance
- Some unfavorable financial ratios (35.71%)
- Limited innovation indicators in data
Lam Research Corporation Weaknesses
- WACC (12.09%) close to ROIC, reducing economic profit margin
- High PB ratio at 12.69 suggests overvaluation risk
- Dividend yield remains low at 0.92%
- Slightly higher debt-to-assets ratio (22.28%)
- Neutral asset turnover (0.86) despite high fixed asset efficiency
- Exposure to geopolitical risks in Asia-Pacific regions
Both companies demonstrate strong profitability and liquidity profiles, but Micron faces capital efficiency challenges while Lam shows signs of valuation risk and geopolitical exposure. Strategic focus for each may involve addressing these specific operational and financial limitations.
The Moat Duel: Analyzing Competitive Defensibility
A structural moat is the sole barrier protecting a company’s long-term profits from relentless competitive erosion. Let’s dissect the moats of two semiconductor giants:
Micron Technology, Inc.: Cost Advantage with Growing Profitability
Micron’s moat hinges on cost leadership in memory and storage products, reflected in its rising gross margin (39.8%) and expanding net margin (22.8%). Despite a slightly unfavorable ROIC vs. WACC, its improving profitability signals strengthening capital efficiency in 2026.
Lam Research Corporation: Durable Value Creator with Technological Edge
Lam Research’s moat stems from specialized semiconductor fabrication equipment and process innovation, shown in a robust 48.7% gross margin and 29.1% net margin. Its ROIC outpaces WACC by 22%, confirming a durable competitive advantage poised for further market expansion.
Cost Leadership vs. Technological Innovation: The Moat Verdict
Lam Research boasts a wider, more durable moat, consistently creating value with superior ROIC and margin stability. Micron improves profitability but still sheds value overall. Lam is better positioned to defend market share amid intensifying competition.
Which stock offers better returns?
Over the past year, Micron Technology and Lam Research have shown strong upward price movements, with Micron experiencing notable acceleration and higher volatility compared to Lam Research.
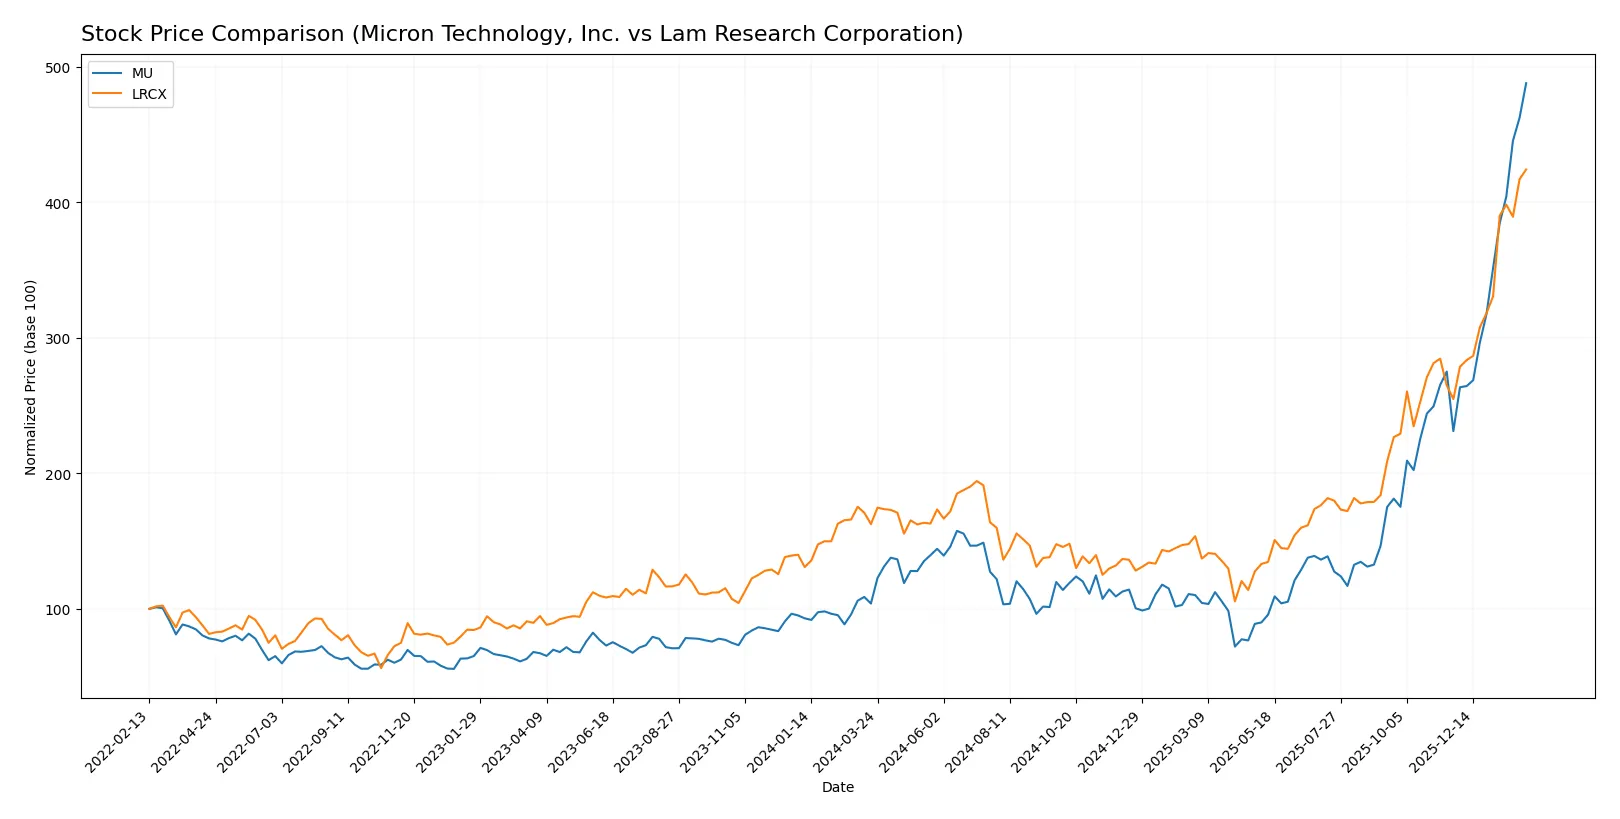
Trend Comparison
Micron Technology’s stock price rose 369.49% over the past year, showing a bullish trend with accelerating momentum and a high standard deviation of 76.07, reflecting significant volatility.
Lam Research’s stock price increased 160.96% over the same period, also bullish with acceleration but lower volatility, as indicated by a standard deviation of 39.19.
Micron outperformed Lam Research, delivering the highest market performance with more than double the price appreciation and stronger recent acceleration.
Target Prices
Analysts present a broad but optimistic consensus for Micron Technology and Lam Research.
| Company | Target Low | Target High | Consensus |
|---|---|---|---|
| Micron Technology, Inc. | 190 | 480 | 345.61 |
| Lam Research Corporation | 127 | 325 | 266.76 |
Micron’s target consensus at 346 suggests upside potential from its 438 current price, while Lam Research’s 267 target is above its 238 market price, signaling moderate growth expectations.

Don’t Let Luck Decide Your Entry Point
Optimize your entry points with our advanced ProRealTime indicators. You’ll get efficient buy signals with precise price targets for maximum performance. Start outperforming now!
How do institutions grade them?
Micron Technology, Inc. Grades
The following table summarizes Micron Technology’s recent institutional grades:
| Grading Company | Action | New Grade | Date |
|---|---|---|---|
| Mizuho | Maintain | Outperform | 2026-01-27 |
| TD Cowen | Maintain | Buy | 2026-01-20 |
| Stifel | Maintain | Buy | 2026-01-20 |
| Rosenblatt | Maintain | Buy | 2026-01-20 |
| Wells Fargo | Maintain | Overweight | 2026-01-15 |
| Citigroup | Maintain | Buy | 2026-01-15 |
| Cantor Fitzgerald | Maintain | Overweight | 2026-01-14 |
| B of A Securities | Maintain | Buy | 2026-01-13 |
| Keybanc | Maintain | Overweight | 2026-01-13 |
| Lynx Global | Maintain | Buy | 2026-01-12 |
Lam Research Corporation Grades
Below is the summary of Lam Research’s latest institutional grades:
| Grading Company | Action | New Grade | Date |
|---|---|---|---|
| UBS | Maintain | Buy | 2026-01-29 |
| Wells Fargo | Maintain | Overweight | 2026-01-29 |
| JP Morgan | Maintain | Overweight | 2026-01-29 |
| RBC Capital | Maintain | Outperform | 2026-01-29 |
| Citigroup | Maintain | Buy | 2026-01-29 |
| Stifel | Maintain | Buy | 2026-01-29 |
| Morgan Stanley | Maintain | Equal Weight | 2026-01-29 |
| Needham | Maintain | Buy | 2026-01-29 |
| Susquehanna | Maintain | Positive | 2026-01-29 |
| Goldman Sachs | Maintain | Buy | 2026-01-29 |
Which company has the best grades?
Both companies receive predominantly positive grades, with numerous “Buy,” “Outperform,” and “Overweight” ratings. Lam Research has a slightly broader consensus at top-tier firms, while Micron shows consistent support from several key analysts. Investors should note the strong institutional confidence reflected in both companies’ grades.
Risks specific to each company
The following categories identify critical pressure points and systemic threats facing both firms in the 2026 market environment:
1. Market & Competition
Micron Technology, Inc.
- Faces intense competition in memory markets with cyclical demand and pricing pressure.
Lam Research Corporation
- Operates in capital equipment with high technological barriers but exposed to semiconductor cycle swings.
2. Capital Structure & Debt
Micron Technology, Inc.
- Maintains low debt-to-equity (0.28) and strong interest coverage, indicating solid financial stability.
Lam Research Corporation
- Higher leverage (debt-to-equity 0.48) but with excellent interest coverage, moderately increasing financial risk.
3. Stock Volatility
Micron Technology, Inc.
- Beta of 1.50 suggests moderate volatility aligned with semiconductor sector trends.
Lam Research Corporation
- Higher beta at 1.78 implies greater sensitivity to market swings and sector cyclicality.
4. Regulatory & Legal
Micron Technology, Inc.
- Subject to US and global trade regulations impacting memory chip exports.
Lam Research Corporation
- Faces regulatory scrutiny on export controls and environmental compliance in semiconductor equipment.
5. Supply Chain & Operations
Micron Technology, Inc.
- Supply chain exposed to raw material volatility and geopolitical risks in Asia-Pacific.
Lam Research Corporation
- Operations depend on precision manufacturing with risks in component sourcing and global logistics.
6. ESG & Climate Transition
Micron Technology, Inc.
- Moderate ESG risks; energy consumption and e-waste management are ongoing challenges.
Lam Research Corporation
- Strong focus on sustainable manufacturing but faces pressures to reduce emissions and resource use.
7. Geopolitical Exposure
Micron Technology, Inc.
- High exposure to US-China tensions affecting sales and supply chains in Asia.
Lam Research Corporation
- Geographic diversification mitigates but does not eliminate risks from trade restrictions and tariffs.
Which company shows a better risk-adjusted profile?
Micron’s biggest risk lies in market cyclicality and geopolitical tensions, which could disrupt revenue streams. Lam Research’s key risk centers on higher financial leverage and stock volatility amid semiconductor cycles. Lam’s superior profitability and stronger returns on assets improve its risk-adjusted profile despite these risks. Notably, Lam’s Altman Z-Score of 21.2 versus Micron’s 12.3 confirms a safer financial position. Investors should weigh Lam’s elevated valuation multiples and leverage against its operational strengths.
Final Verdict: Which stock to choose?
Micron Technology’s superpower lies in its impressive turnaround momentum and operational efficiency. It is rapidly improving profitability despite currently destroying value on capital invested. A point of vigilance is its elevated WACC, which may pressure future returns. This stock suits investors seeking aggressive growth with some tolerance for volatility.
Lam Research boasts a robust strategic moat driven by its durable competitive advantage and superior capital efficiency. Its strong ROIC well above WACC signals consistent value creation. Compared to Micron, Lam offers better stability, albeit at a premium valuation. It fits well in a GARP (Growth at a Reasonable Price) portfolio.
If you prioritize high growth potential and can accept cyclical risks, Micron’s accelerating profitability outshines for aggressive investors. However, if you seek a more stable business with a proven moat and capital discipline, Lam Research offers better stability and durable returns despite its higher valuation. Each represents a distinct analytical scenario for different investor profiles.
Disclaimer: Investment carries a risk of loss of initial capital. The past performance is not a reliable indicator of future results. Be sure to understand risks before making an investment decision.
Go Further
I encourage you to read the complete analyses of Micron Technology, Inc. and Lam Research Corporation to enhance your investment decisions: