Home > Comparison > Technology > LRCX vs MCHP
The strategic rivalry between Lam Research Corporation and Microchip Technology Incorporated shapes the semiconductor industry’s future. Lam Research operates as a capital-intensive equipment manufacturer, specializing in wafer fabrication tools. In contrast, Microchip Technology focuses on high-margin embedded control solutions and microcontrollers. This head-to-head pits industrial scale against product diversification. This analysis aims to identify which company’s trajectory offers the superior risk-adjusted return for a diversified portfolio amid evolving tech demands.
Table of contents
Companies Overview
Lam Research Corporation and Microchip Technology Incorporated stand as pivotal players shaping the semiconductor industry landscape.
Lam Research Corporation: Semiconductor Equipment Innovator
Lam Research Corporation dominates the semiconductor equipment market by designing and manufacturing tools critical for integrated circuit fabrication. Its core revenue derives from advanced deposition, etching, and cleaning systems essential to chip manufacturing. In 2026, Lam’s strategic focus sharpens on expanding its product portfolio with precision plasma and atomic layer deposition technologies to support next-generation semiconductor nodes.
Microchip Technology Incorporated: Embedded Control Solutions Leader
Microchip Technology Incorporated specializes in embedded control solutions, offering a broad range of microcontrollers, microprocessors, and analog products. Its revenue engine hinges on smart, secure chips tailored for automotive, industrial, and communications markets worldwide. In 2026, Microchip prioritizes innovation in low-power microcontrollers and secure connectivity to capitalize on growing demand in IoT and automotive sectors.
Strategic Collision: Similarities & Divergences
Lam Research and Microchip both operate in semiconductors but diverge sharply in approach. Lam invests in high-tech fabrication equipment, enabling chipmakers to push technological boundaries. Microchip emphasizes diversified embedded systems and connectivity solutions. Their primary battleground is the semiconductor value chain’s upstream versus downstream segments. Investors face very different profiles: Lam offers exposure to capital-intensive process technology, while Microchip targets broad applications with embedded innovation.
Income Statement Comparison
This data dissects the core profitability and scalability of both corporate engines to reveal who dominates the bottom line:
| Metric | Lam Research Corporation (LRCX) | Microchip Technology Incorporated (MCHP) |
|---|---|---|
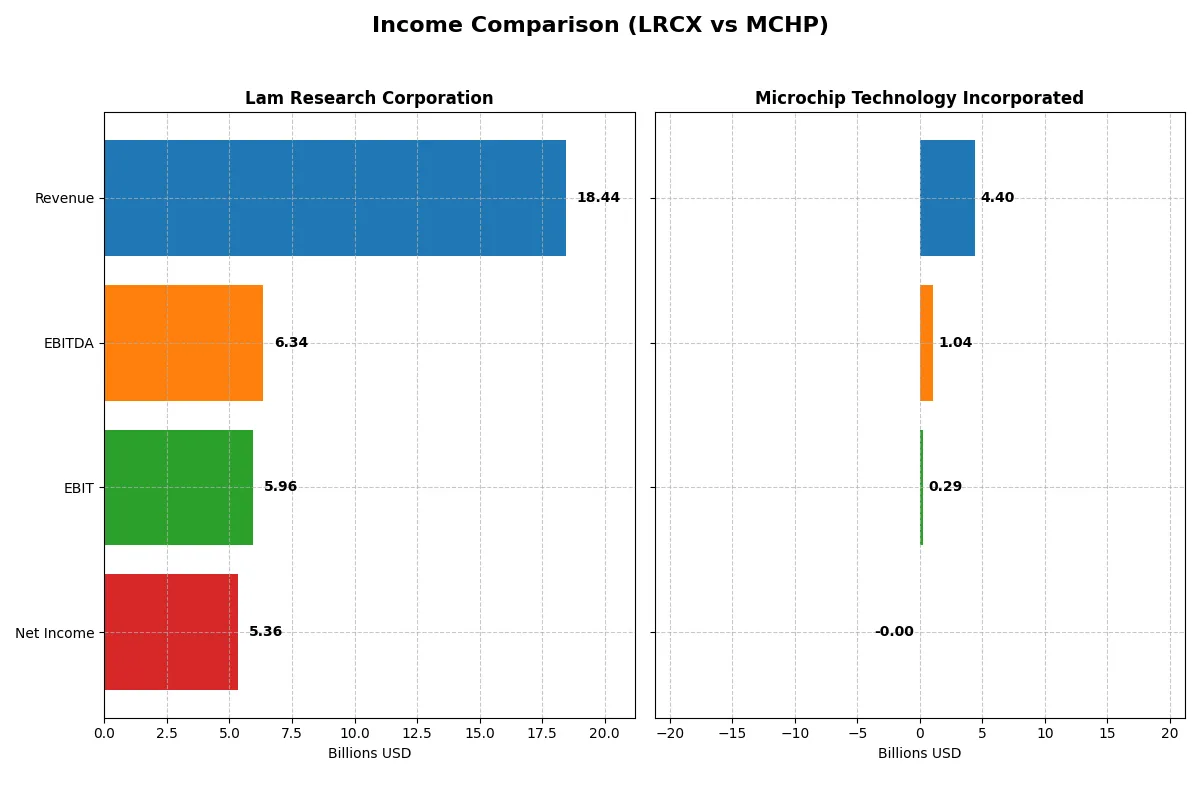
| Revenue | 18.4B | 4.4B |
| Cost of Revenue | 9.5B | 1.9B |
| Operating Expenses | 3.1B | 2.2B |
| Gross Profit | 9.0B | 2.5B |
| EBITDA | 6.3B | 1.0B |
| EBIT | 6.0B | 290M |
| Interest Expense | 178M | 251M |
| Net Income | 5.4B | -0.5M |
| EPS | 4.17 | -0.005 |
| Fiscal Year | 2025 | 2025 |
Income Statement Analysis: The Bottom-Line Duel
This income statement comparison reveals each company’s operational efficiency and profitability trends over recent years.
Lam Research Corporation Analysis
Lam Research’s revenue climbed steadily from $14.6B in 2021 to $18.4B in 2025, with net income rising from $3.9B to $5.4B. The company maintains strong gross margins near 49% and net margins above 29%. In 2025, Lam’s EBIT margin surged to 32.3%, reflecting superior cost control and robust earnings momentum.
Microchip Technology Incorporated Analysis
Microchip’s revenue showed a sharp decline from $7.6B in 2024 to $4.4B in 2025, dragging net income into negative territory at -$2.7M. Despite a healthy gross margin of 56%, its net margin collapsed to -0.01% due to rising expenses and falling EBIT margin at 6.6%. The latest fiscal year highlights severe profitability challenges and deteriorating operational leverage.
Verdict: Robust Profitability vs. Troubled Decline
Lam Research clearly outperforms Microchip, delivering consistent revenue growth and expanding margins across the board. Microchip’s steep revenue drop and negative net income signal structural issues. For investors, Lam’s profile offers superior earnings quality and growth potential, making it the fundamentally stronger choice in this comparison.
Financial Ratios Comparison
These vital ratios act as a diagnostic tool to expose the underlying fiscal health, valuation premiums, and capital efficiency of each company:
| Ratios | Lam Research (LRCX) | Microchip Technology (MCHP) |
|---|---|---|
| ROE | 54.3% | -0.01% |
| ROIC | 34.0% | -0.03% |
| P/E | 23.4 | -52021 |
| P/B | 12.7 | 3.67 |
| Current Ratio | 2.21 | 2.59 |
| Quick Ratio | 1.55 | 1.47 |
| D/E (Debt-to-Equity) | 0.48 | 0.80 |
| Debt-to-Assets | 22.3% | 36.9% |
| Interest Coverage | 33.1 | 1.18 |
| Asset Turnover | 0.86 | 0.29 |
| Fixed Asset Turnover | 7.59 | 3.72 |
| Payout ratio | 21.5% | -1951% |
| Dividend yield | 0.92% | 3.75% |
| Fiscal Year | 2025 | 2025 |
Efficiency & Valuation Duel: The Vital Signs
Financial ratios act as the company’s DNA, revealing hidden risks and operational excellence that shape investor decisions.
Lam Research Corporation
Lam Research delivers exceptional profitability with a 54.33% ROE and a strong 29.06% net margin. Its valuation appears fairly valued with a 23.36 P/E but stretched with a high 12.69 P/B ratio. The firm prioritizes shareholder returns via modest dividends (0.92% yield) while reinvesting heavily in R&D, fueling future growth and operational efficiency.
Microchip Technology Incorporated
Microchip Technology struggles with negative returns, posting a -0.01% ROE and net margin, signaling operational challenges. Despite an unusual negative P/E, its P/B ratio of 3.67 remains moderate. The company supports shareholders with a high 3.75% dividend yield, offsetting weak profitability, but risks persist given low asset turnover and strained interest coverage.
Premium Valuation vs. Operational Safety
Lam Research offers a superior balance of robust returns and solid operational metrics despite a high P/B ratio. Microchip presents higher income through dividends but faces significant profitability and leverage risks. Growth-oriented investors may prefer Lam’s efficient capital deployment, while income seekers might lean toward Microchip’s yield amid caution.
Which one offers the Superior Shareholder Reward?
Lam Research (LRCX) and Microchip Technology (MCHP) pursue contrasting shareholder reward strategies. LRCX delivers a modest dividend yield near 0.9% with a conservative payout ratio around 21%, supported by strong free cash flow coverage. It also executes steady buybacks, enhancing total returns sustainably. MCHP, despite a higher dividend yield near 3.75%, shows volatile earnings and weaker dividend coverage, raising sustainability concerns. Its payout ratio fluctuates widely, sometimes negative, reflecting uneven profitability. Buybacks at MCHP are less consistent, limiting total shareholder return. I conclude LRCX offers a superior, more reliable total return profile in 2026, balancing dividends with disciplined buybacks and robust cash flow.
Comparative Score Analysis: The Strategic Profile
The radar chart reveals the fundamental DNA and trade-offs of Lam Research Corporation and Microchip Technology Incorporated, exposing their financial strengths and valuation challenges:
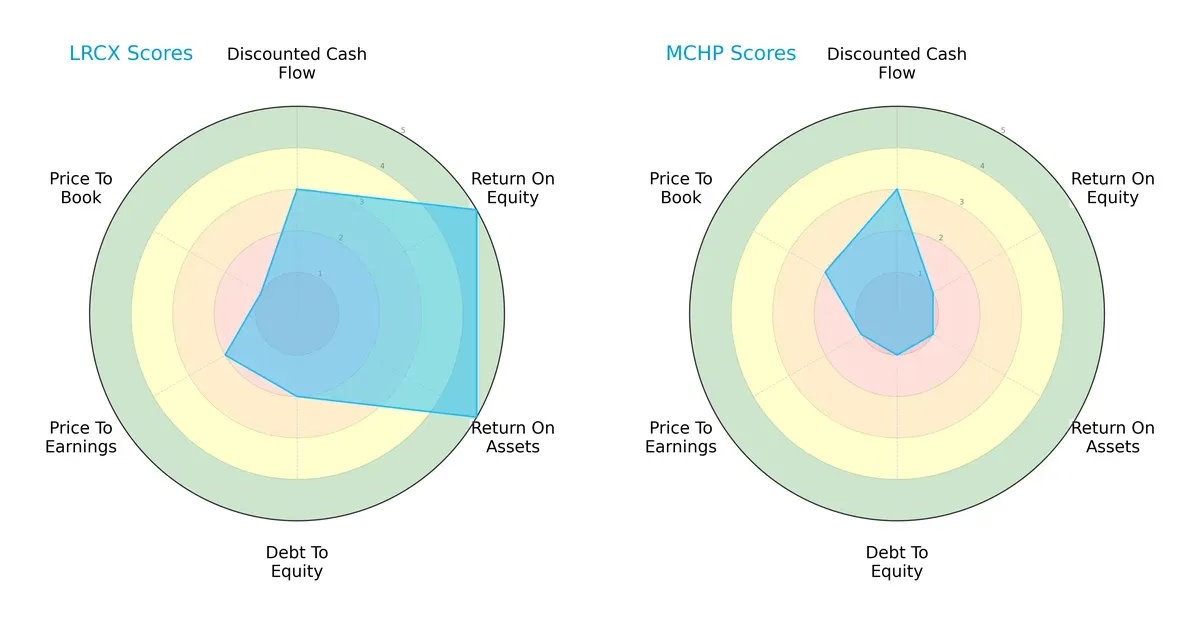
Lam Research boasts strong profitability with top-tier ROE and ROA scores (5 each), highlighting efficient capital and asset use. However, its debt-to-equity and valuation metrics lag, signaling moderate financial leverage and an expensive price relative to book value. Microchip Technology shows uniformly weak profitability and financial risk scores, relying mostly on a moderate discounted cash flow score. Lam Research presents a more balanced profile, while Microchip depends on limited valuation appeal without operational strength.
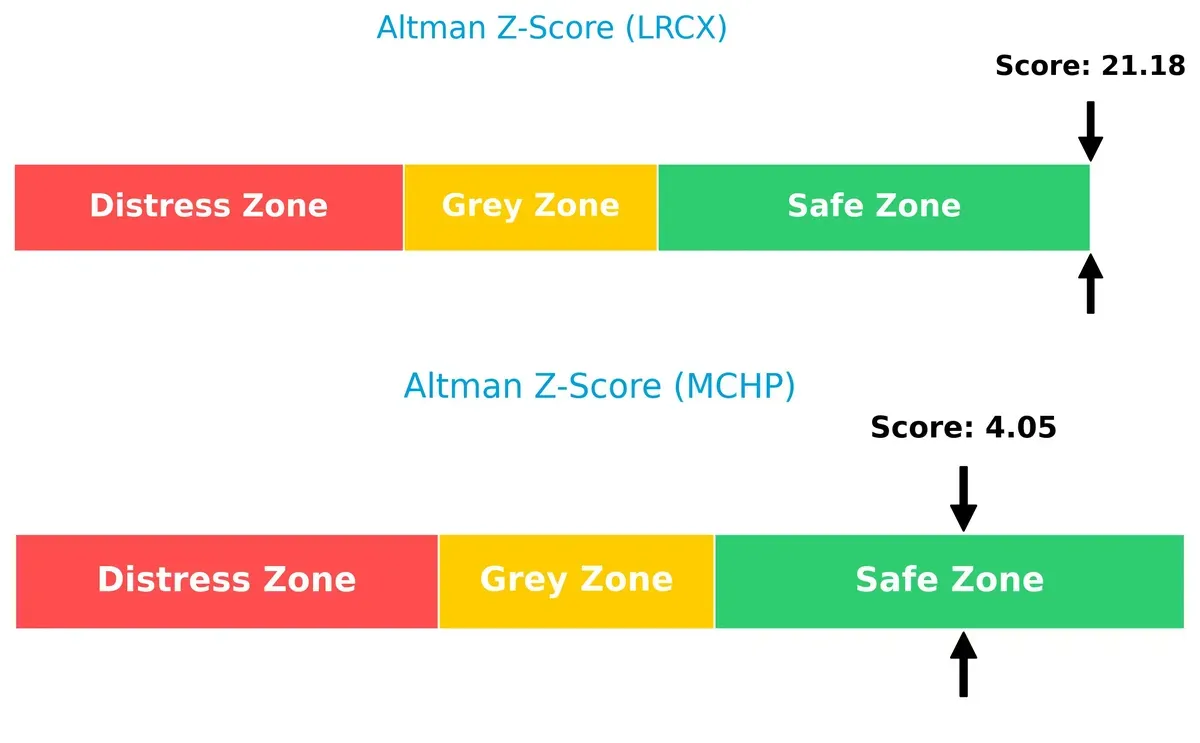
Bankruptcy Risk: Solvency Showdown
Lam Research’s Altman Z-Score of 21.2 vastly outpaces Microchip’s 4.1, indicating superior solvency and a safer long-term survival outlook in this phase of the market cycle:
Financial Health: Quality of Operations
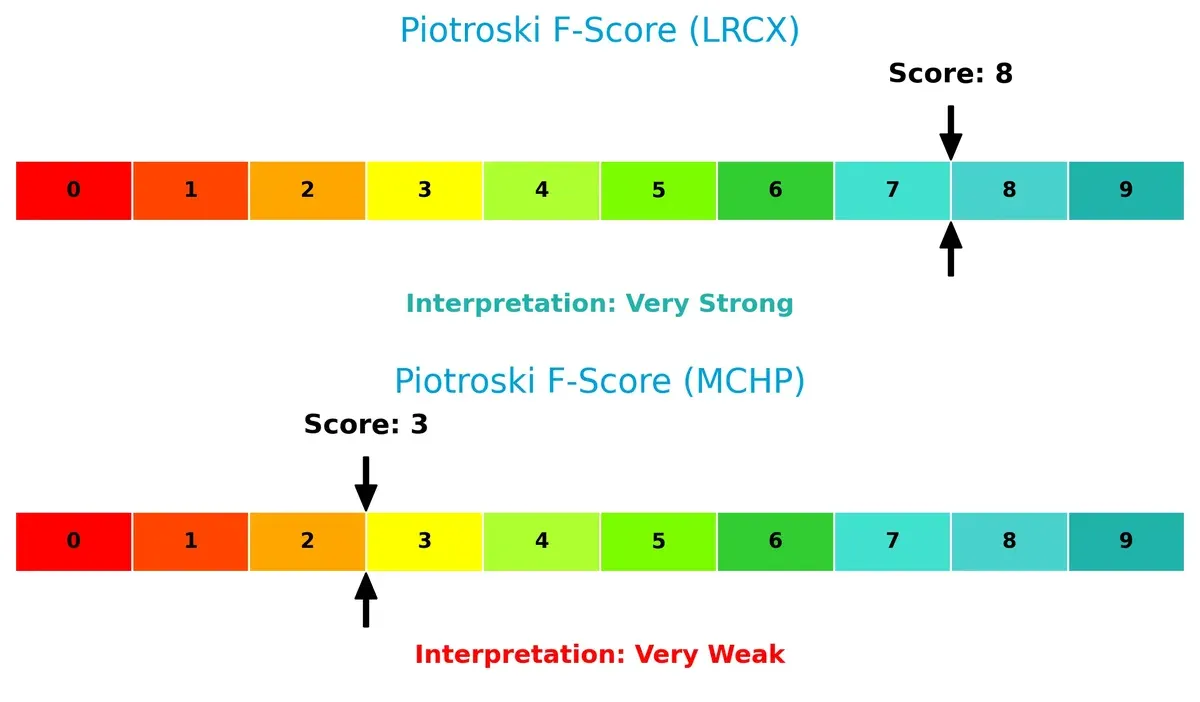
Lam Research scores an impressive 8 on the Piotroski F-Score, signaling robust financial health and operational strength. Microchip’s low score of 3 raises red flags about internal weaknesses and financial fragility:
How are the two companies positioned?
This section dissects the operational DNA of Lam Research and Microchip by comparing their revenue distribution and internal dynamics. The goal is to confront their economic moats to determine which model offers the most resilient, sustainable advantage today.
Revenue Segmentation: The Strategic Mix
This visual comparison dissects how Lam Research Corporation and Microchip Technology diversify their income streams and where their primary sector bets lie:
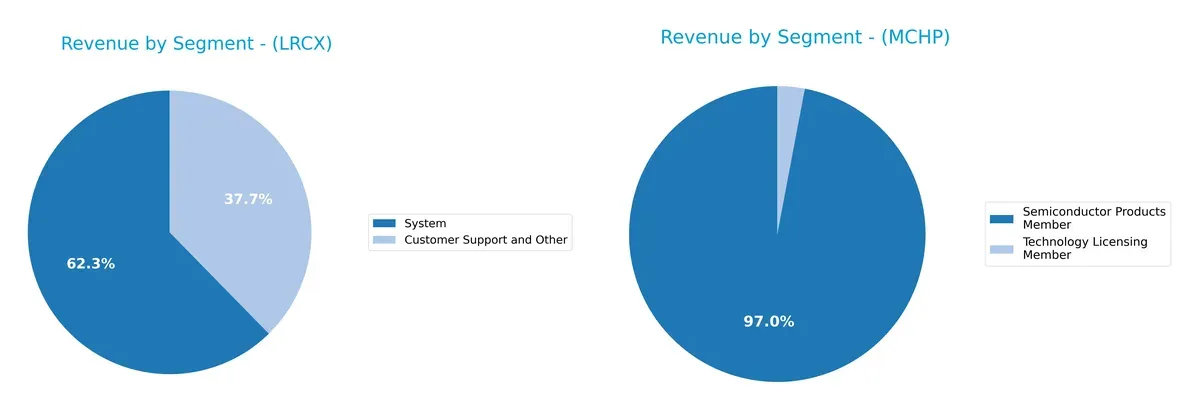
Lam Research anchors revenue in its System segment with $11.5B in 2025, complemented by $6.9B from Customer Support. This mix shows a strong infrastructure dominance with recurring service revenue. Microchip, however, pivots almost entirely on Semiconductor Products, generating $4.3B and a minimal $131M from Technology Licensing. Lam’s diversified approach mitigates concentration risk, while Microchip’s reliance on one segment increases exposure but underscores product specialization.
Strengths and Weaknesses Comparison
This table compares the Strengths and Weaknesses of Lam Research Corporation and Microchip Technology Incorporated:
Lam Research Corporation Strengths
- High profitability with 29.06% net margin and 54.33% ROE
- Strong liquidity ratios: current ratio 2.21, quick ratio 1.55
- Low debt levels: debt-to-assets 22.28%
- Superior asset efficiency: fixed asset turnover 7.59
- Significant market presence in Asia-Pacific including China and Korea
- Diversified revenue from Systems and Customer Support
Microchip Technology Incorporated Strengths
- Positive price-to-earnings indicator despite losses
- Favorable dividend yield at 3.75%
- Good liquidity: current ratio 2.59, quick ratio 1.47
- Reasonable fixed asset turnover at 3.72
- Established semiconductor product revenue stream
Lam Research Corporation Weaknesses
- High price-to-book ratio at 12.69 may indicate overvaluation
- Weighted average cost of capital (WACC) of 12.09% exceeds ROIC caution
- Dividend yield low at 0.92%
- Neutral asset turnover at 0.86 limits overall efficiency
Microchip Technology Incorporated Weaknesses
- Negative profitability metrics: net margin, ROE, and ROIC below zero
- Low interest coverage ratio at 1.15 signals financial risk
- High debt levels: debt-to-assets 36.85% and debt-to-equity 0.8
- Poor asset turnover at 0.29 reduces capital efficiency
Lam Research exhibits strong profitability and financial health driven by diversified global revenue. Microchip faces challenges in profitability and operational efficiency despite solid liquidity and dividend yield. These factors shape their strategic priorities and capital allocation going forward.
The Moat Duel: Analyzing Competitive Defensibility
A structural moat is the only reliable shield protecting long-term profits from relentless competitive erosion in dynamic markets:
Lam Research Corporation: Capital Efficiency and Technological Edge
Lam Research’s moat stems from its superior capital allocation and innovation in semiconductor equipment. This drives a robust 21.9% ROIC premium over WACC and margin stability. New product launches and geographic expansion in Asia deepen its moat in 2026.
Microchip Technology Incorporated: Fragmented Market Position and Declining Returns
Microchip relies on product breadth and embedded systems expertise, but its ROIC lags WACC by nearly 10%, signaling value destruction. Unlike Lam, its competitive edge weakens amid shrinking margins and revenue declines, raising concerns about sustaining growth.
Capital Efficiency vs. Market Fragmentation: Who Holds the Stronger Moat?
Lam Research boasts a wider, more durable moat, underscored by consistent value creation and expanding profitability. Microchip’s deteriorating returns highlight a fragile competitive position. Lam is clearly better equipped to defend market share in 2026.
Which stock offers better returns?
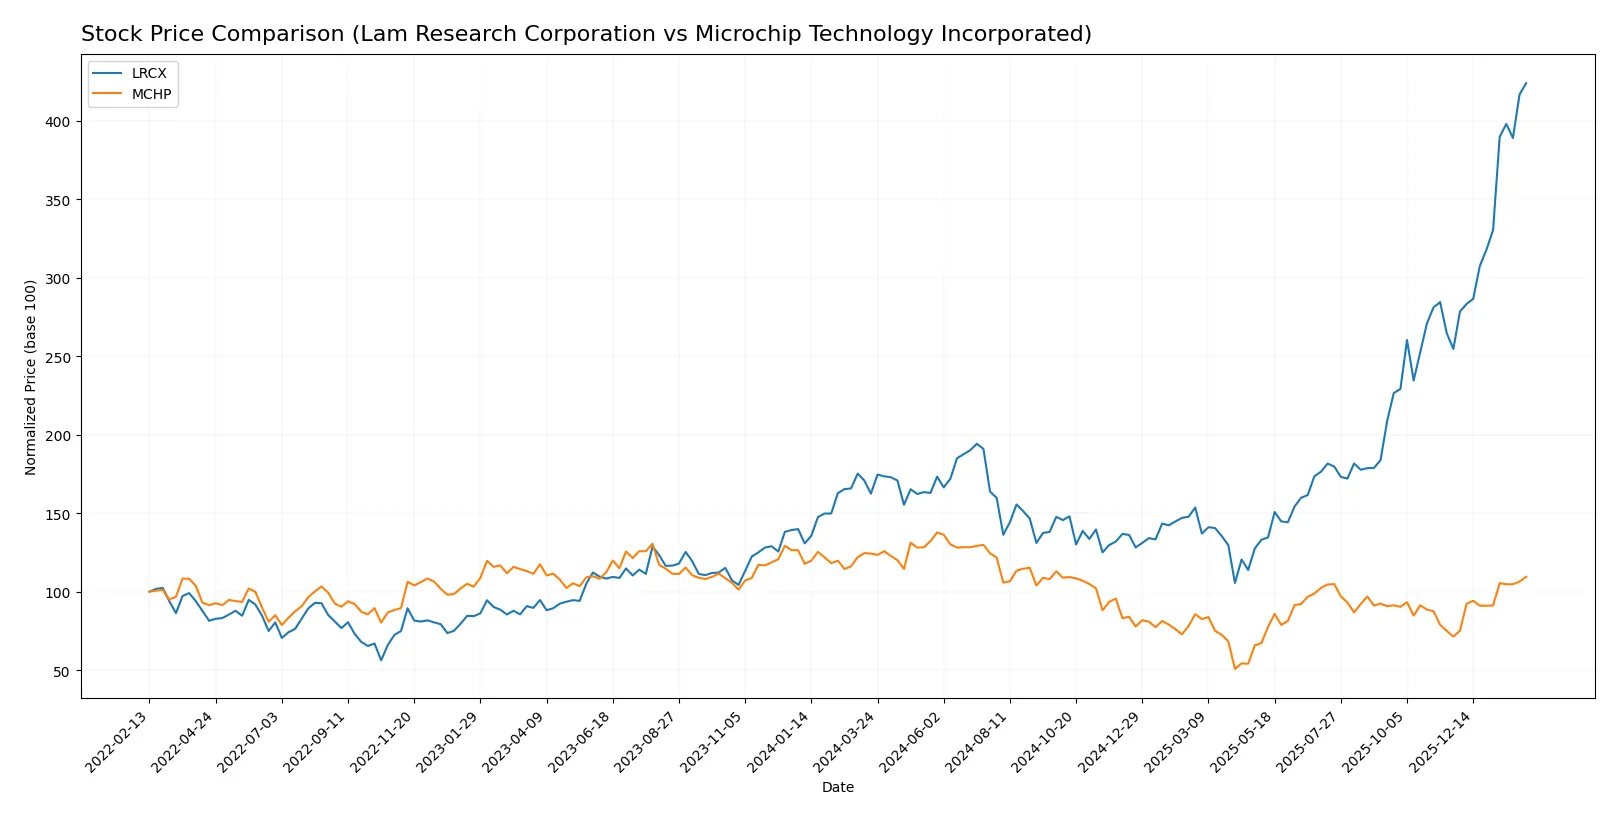
Over the past year, Lam Research Corporation’s stock surged sharply with accelerating gains. Microchip Technology Incorporated experienced a notable decline followed by recent recovery. Trading volumes increased significantly for both.
Trend Comparison
Lam Research’s stock price rose 161% over the past 12 months, marking a strong bullish trend with accelerating momentum. Its price ranged from 59.09 to a high of 237.5, reflecting significant volatility (std deviation 39.19).
Microchip Technology’s stock declined 11.9% over the last year, indicating a bearish trend despite accelerating price action. The price fluctuated between 36.22 and 98.23 with moderate volatility (std deviation 14.14).
Comparing both, Lam Research delivered substantially higher market performance, outperforming Microchip with a strong bullish trend and greater price appreciation.
Target Prices
The current analyst consensus suggests solid upside potential for both Lam Research Corporation and Microchip Technology Incorporated.
| Company | Target Low | Target High | Consensus |
|---|---|---|---|
| Lam Research Corporation | 127 | 325 | 266.76 |
| Microchip Technology Incorporated | 60 | 100 | 82.46 |
Analysts expect Lam Research’s stock to rise roughly 12% above its current price of $237.5. Microchip Technology’s consensus target implies a modest 6% upside from $78.08. Both companies show favorable growth expectations relative to current valuations.

Don’t Let Luck Decide Your Entry Point
Optimize your entry points with our advanced ProRealTime indicators. You’ll get efficient buy signals with precise price targets for maximum performance. Start outperforming now!
How do institutions grade them?
The following tables summarize recent institutional grades for Lam Research Corporation and Microchip Technology Incorporated:
Lam Research Corporation Grades
The table below shows Lam Research Corporation’s latest grades from reputable financial institutions.
| Grading Company | Action | New Grade | Date |
|---|---|---|---|
| UBS | Maintain | Buy | 2026-01-29 |
| Wells Fargo | Maintain | Overweight | 2026-01-29 |
| JP Morgan | Maintain | Overweight | 2026-01-29 |
| RBC Capital | Maintain | Outperform | 2026-01-29 |
| Citigroup | Maintain | Buy | 2026-01-29 |
| Stifel | Maintain | Buy | 2026-01-29 |
| Morgan Stanley | Maintain | Equal Weight | 2026-01-29 |
| Needham | Maintain | Buy | 2026-01-29 |
| Susquehanna | Maintain | Positive | 2026-01-29 |
| Goldman Sachs | Maintain | Buy | 2026-01-29 |
Microchip Technology Incorporated Grades
Below is a summary of Microchip Technology Incorporated’s most recent institutional grades.
| Grading Company | Action | New Grade | Date |
|---|---|---|---|
| UBS | Maintain | Buy | 2026-01-26 |
| Susquehanna | Maintain | Positive | 2026-01-22 |
| B of A Securities | Maintain | Neutral | 2026-01-21 |
| Citigroup | Maintain | Buy | 2026-01-15 |
| Piper Sandler | Maintain | Overweight | 2026-01-15 |
| B. Riley Securities | Maintain | Buy | 2026-01-12 |
| Mizuho | Maintain | Outperform | 2026-01-09 |
| Wells Fargo | Maintain | Equal Weight | 2026-01-07 |
| JP Morgan | Maintain | Overweight | 2026-01-06 |
| Rosenblatt | Maintain | Buy | 2026-01-06 |
Which company has the best grades?
Lam Research receives consistently positive grades, including multiple “Buy” and “Outperform” recommendations, indicating strong institutional confidence. Microchip shows more mixed ratings with some “Neutral” and “Equal Weight” grades. Investors may interpret Lam Research’s broader bullish support as a sign of stronger market endorsement.
Risks specific to each company
The following categories identify critical pressure points and systemic threats facing Lam Research Corporation and Microchip Technology Incorporated in the 2026 market environment:
1. Market & Competition
Lam Research Corporation
- Operates in advanced semiconductor equipment with strong innovation moat. Faces intense competition from applied materials and Tokyo Electron.
Microchip Technology Incorporated
- Competes in embedded microcontrollers and analog solutions, a crowded field with pricing pressure and technological shifts.
2. Capital Structure & Debt
Lam Research Corporation
- Healthy leverage with debt/equity at 0.48 and strong interest coverage of 33.4x. Low financial risk.
Microchip Technology Incorporated
- Higher leverage at debt/equity 0.8 and weak interest coverage at 1.15x, raising solvency concerns.
3. Stock Volatility
Lam Research Corporation
- Beta of 1.78 indicates above-market volatility, typical for semiconductor equipment makers.
Microchip Technology Incorporated
- Beta of 1.45 suggests moderately high volatility but less than Lam Research.
4. Regulatory & Legal
Lam Research Corporation
- Subject to export controls and IP litigation risks common in semiconductor capital equipment.
Microchip Technology Incorporated
- Faces regulatory scrutiny on product safety and export compliance in microcontroller markets.
5. Supply Chain & Operations
Lam Research Corporation
- Complex global supply chain vulnerable to geopolitical tensions, but strong operational efficiency (fixed asset turnover 7.59).
Microchip Technology Incorporated
- Supply chain exposed to component shortages; lower asset turnover (3.72) signals operational challenges.
6. ESG & Climate Transition
Lam Research Corporation
- Increasing pressure to reduce emissions in manufacturing and improve sustainability practices.
Microchip Technology Incorporated
- Faces challenges integrating ESG in legacy manufacturing and product design.
7. Geopolitical Exposure
Lam Research Corporation
- Significant exposure to China and Asia-Pacific markets, risking disruption from US-China tensions.
Microchip Technology Incorporated
- Also exposed to US-China trade tensions but with more diversified end markets globally.
Which company shows a better risk-adjusted profile?
Lam Research’s strongest risk is its market and geopolitical exposure, but it offsets this with a robust capital structure and operational efficiency. Microchip’s biggest risk lies in its weak profitability and debt profile, heightening financial distress risk. Lam Research demonstrates a superior risk-adjusted profile, supported by an Altman Z-Score of 21.2 and a strong Piotroski score of 8 versus Microchip’s lower scores. This contrast underscores Lam’s resilience despite market volatility, while Microchip’s profitability and solvency metrics raise caution flags.
Final Verdict: Which stock to choose?
Lam Research Corporation (LRCX) shines as a powerhouse of operational excellence and capital efficiency. Its ability to consistently generate returns well above its cost of capital signals a durable competitive advantage. A point of vigilance remains its premium valuation metrics, which demand justified growth. LRCX suits investors seeking aggressive growth with strong fundamentals.
Microchip Technology Incorporated (MCHP) offers a strategic moat rooted in its recurring revenue streams and specialized semiconductor niche. However, its deteriorating profitability and declining returns on invested capital raise concerns. Relative to LRCX, MCHP presents a riskier profile but might appeal to portfolios focused on turnaround potential and value opportunities under recovery scenarios.
If you prioritize durable profitability and a proven capital return track record, Lam Research stands out due to its clear value creation and robust financial health. However, if you seek exposure to a high-risk, potentially undervalued semiconductor player with a niche market, Microchip could offer a speculative opportunity, albeit with significant caution warranted.
Disclaimer: Investment carries a risk of loss of initial capital. The past performance is not a reliable indicator of future results. Be sure to understand risks before making an investment decision.
Go Further
I encourage you to read the complete analyses of Lam Research Corporation and Microchip Technology Incorporated to enhance your investment decisions: