Home > Comparison > Technology > LRCX vs MXL
The strategic rivalry between Lam Research Corporation and MaxLinear, Inc. shapes the semiconductor sector’s evolution. Lam Research operates as a capital-intensive equipment manufacturer, while MaxLinear specializes in high-performance mixed-signal communication SoCs. This head-to-head pits manufacturing scale against technological integration. This analysis will clarify which company presents a superior risk-adjusted profile for diversified portfolios navigating cyclical and innovation-driven market forces.
Table of contents
Companies Overview
Lam Research and MaxLinear stand as pivotal players in the semiconductor industry, shaping technology infrastructure globally.
Lam Research Corporation: Semiconductor Equipment Powerhouse
Lam Research dominates semiconductor equipment manufacturing. It generates revenue by designing and servicing advanced wafer fabrication tools, including deposition, etch, and cleaning systems. In 2026, it strategically emphasizes innovation in plasma-enhanced CVD and atomic layer deposition to support the relentless demand for smaller, faster chips.
MaxLinear, Inc.: Communications SoC Specialist
MaxLinear focuses on high-performance analog and mixed-signal SoCs for communications infrastructure. It earns through integrated solutions powering broadband modems, wireless routers, and 4G/5G base stations. Its 2026 strategy targets expanding its footprint in fiber-optic modules and power management systems to capitalize on rising data traffic and network modernization.
Strategic Collision: Similarities & Divergences
Both operate in semiconductors but diverge in focus: Lam Research builds manufacturing tools, while MaxLinear designs integrated communication chips. Their competition centers on enabling next-gen connectivity—Lam through fabrication precision, MaxLinear via system integration. This contrast defines distinct investment profiles: one capitalizes on capital equipment cycles, the other on scalable communications demand.
Income Statement Comparison
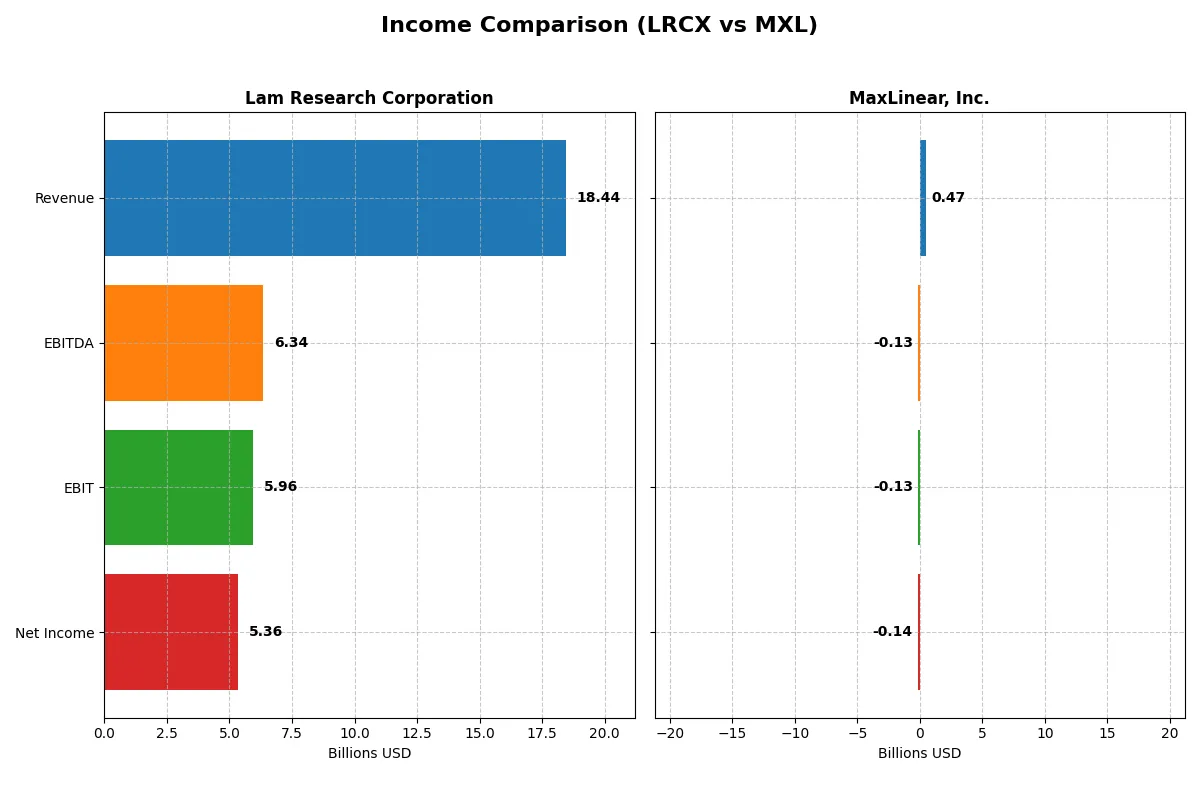
This data dissects the core profitability and scalability of both corporate engines to reveal who dominates the bottom line:
| Metric | Lam Research Corporation (LRCX) | MaxLinear, Inc. (MXL) |
|---|---|---|
| Revenue | 18.4B | 468M |
| Cost of Revenue | 9.46B | 202M |
| Operating Expenses | 3.08B | 393M |
| Gross Profit | 8.98B | 266M |
| EBITDA | 6.34B | -131M |
| EBIT | 5.96B | -131M |
| Interest Expense | 178M | 10.1M |
| Net Income | 5.36B | -137M |
| EPS | 4.17 | -1.58 |
| Fiscal Year | 2025 | 2025 |
Income Statement Analysis: The Bottom-Line Duel
This income statement comparison exposes each company’s true operational efficiency and profitability momentum over recent years.
Lam Research Corporation Analysis
Lam Research’s revenue climbed steadily from 14.6B in 2021 to 18.4B in 2025, with net income surging from 3.9B to 5.4B. Gross margins remain robust near 49%, and net margins improved to 29%, reflecting excellent cost control and operational leverage. The 2025 fiscal year shows strong momentum, with a 24% revenue growth and a 13% net margin increase year-over-year.
MaxLinear, Inc. Analysis
MaxLinear’s top line shows volatility, peaking at 1.1B in 2022 but dropping to 468M in 2025. The firm consistently posts net losses, including -137M in 2025, despite a favorable gross margin near 57%. EBIT and net margins remain negative, though recent year growth rates suggest improving operational efficiency from a low base. The latest year reveals a 30% revenue rise and a 57% net margin improvement, signaling a possible turnaround phase.
Growth Stability vs. Recovery Challenge
Lam Research dominates with consistent revenue and profit growth, high margins, and expanding earnings per share. MaxLinear struggles with profitability despite some recent operational gains and margin expansion. For investors, Lam offers a proven, steady growth profile, while MaxLinear presents a higher-risk recovery story requiring cautious scrutiny.
Financial Ratios Comparison
These vital ratios act as a diagnostic tool to expose the underlying fiscal health, valuation premiums, and capital efficiency for the companies compared below:
| Ratios | Lam Research Corporation (LRCX) | MaxLinear, Inc. (MXL) |
|---|---|---|
| ROE | 54.3% | -47.5% |
| ROIC | 34.0% | -24.3% |
| P/E | 23.4 | -6.7 |
| P/B | 12.7 | 3.20 |
| Current Ratio | 2.21 | 1.77 |
| Quick Ratio | 1.55 | 1.28 |
| D/E (Debt-to-Equity) | 0.48 | 0.29 |
| Debt-to-Assets | 22.3% | 17.2% |
| Interest Coverage | 33.1 | -15.5 |
| Asset Turnover | 0.86 | 0.42 |
| Fixed Asset Turnover | 7.59 | 4.65 |
| Payout ratio | 21.5% | 0% |
| Dividend yield | 0.92% | 0% |
| Fiscal Year | 2025 | 2024 |
Efficiency & Valuation Duel: The Vital Signs
Financial ratios act as a company’s DNA, exposing hidden risks and revealing operational excellence in profitability and valuation.
Lam Research Corporation
Lam Research commands a strong profitability profile with a 54.33% ROE and a solid 29.06% net margin, signaling operational efficiency. Its P/E of 23.36 appears fairly valued against its peers. The firm supports shareholders modestly with a 0.92% dividend yield, while maintaining ample reinvestment in R&D at 11.4% of revenue, fueling sustainable growth.
MaxLinear, Inc.
MaxLinear suffers from deep profitability challenges, posting a negative 47.49% ROE and a steep -68.01% net margin, reflecting operational struggles. Its negative P/E signals losses, though the 3.2 PB ratio suggests moderate asset valuation. The company pays no dividends, instead allocating a high 62.5% of revenue to R&D, aiming for a turnaround via innovation investment.
Operational Strength vs. Turnaround Risk
Lam Research offers a superior balance of robust profitability and disciplined valuation, suited for risk-conscious investors seeking steady returns. MaxLinear’s metrics reveal significant risk and ongoing losses, fitting investors with a high tolerance for volatility betting on a growth recovery.
Which one offers the Superior Shareholder Reward?
Lam Research Corporation (LRCX) pays a modest but sustainable dividend yield around 0.9% with a payout ratio near 21%, well-covered by free cash flow. It also executes steady buybacks, supporting total returns. MaxLinear, Inc. (MXL) offers no dividends, suffering negative margins and free cash flow, relying on reinvestment for growth. Its buyback activity is negligible, reflecting financial strain. Historically in semiconductors, consistent dividends and disciplined buybacks deliver superior shareholder rewards versus speculative growth. I conclude LRCX offers the more attractive total return profile in 2026 due to its balanced, sustainable distribution strategy and stronger cash generation.
Comparative Score Analysis: The Strategic Profile
The radar chart reveals the fundamental DNA and trade-offs of both firms, highlighting their financial strengths and valuation nuances:
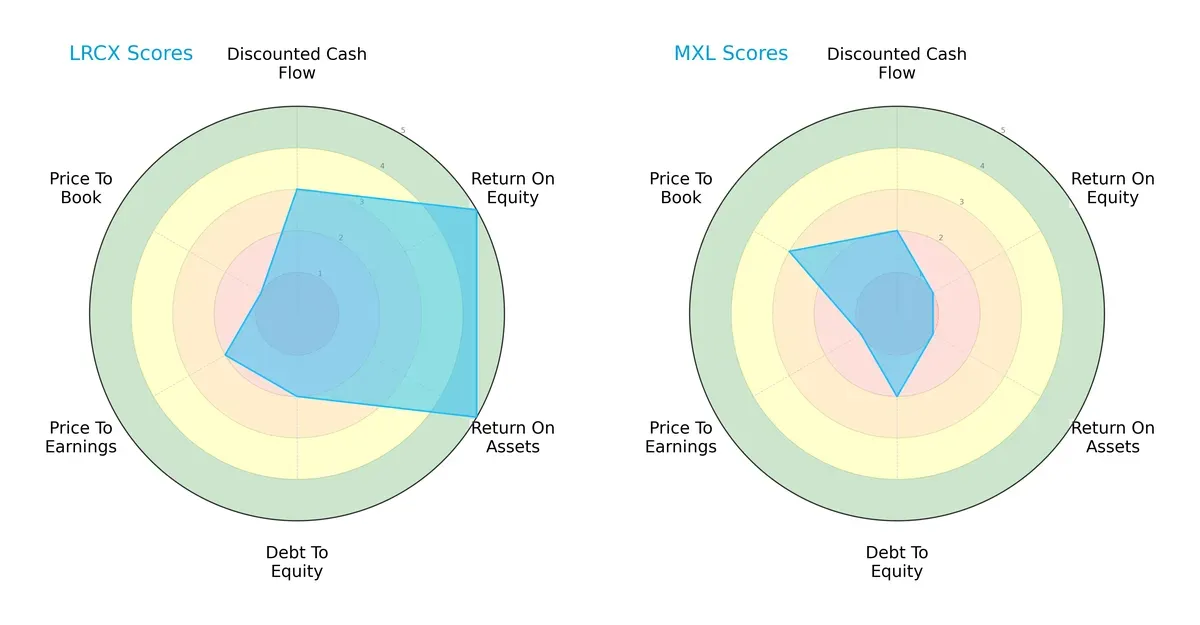
Lam Research Corporation (LRCX) delivers a balanced financial profile, excelling in ROE and ROA with top scores of 5 each. MaxLinear, Inc. (MXL) lags notably in profitability metrics, scoring 1 in both ROE and ROA. Both firms share moderate debt-to-equity scores of 2, suggesting similar leverage risk. LRCX’s valuation metrics (P/E 2, P/B 1) indicate potential overvaluation risks, contrasting with MXL’s mixed valuation (P/E 1, P/B 3) that may offer better book value alignment. Overall, LRCX relies on operational efficiency, while MXL’s profile depends more on valuation edges.
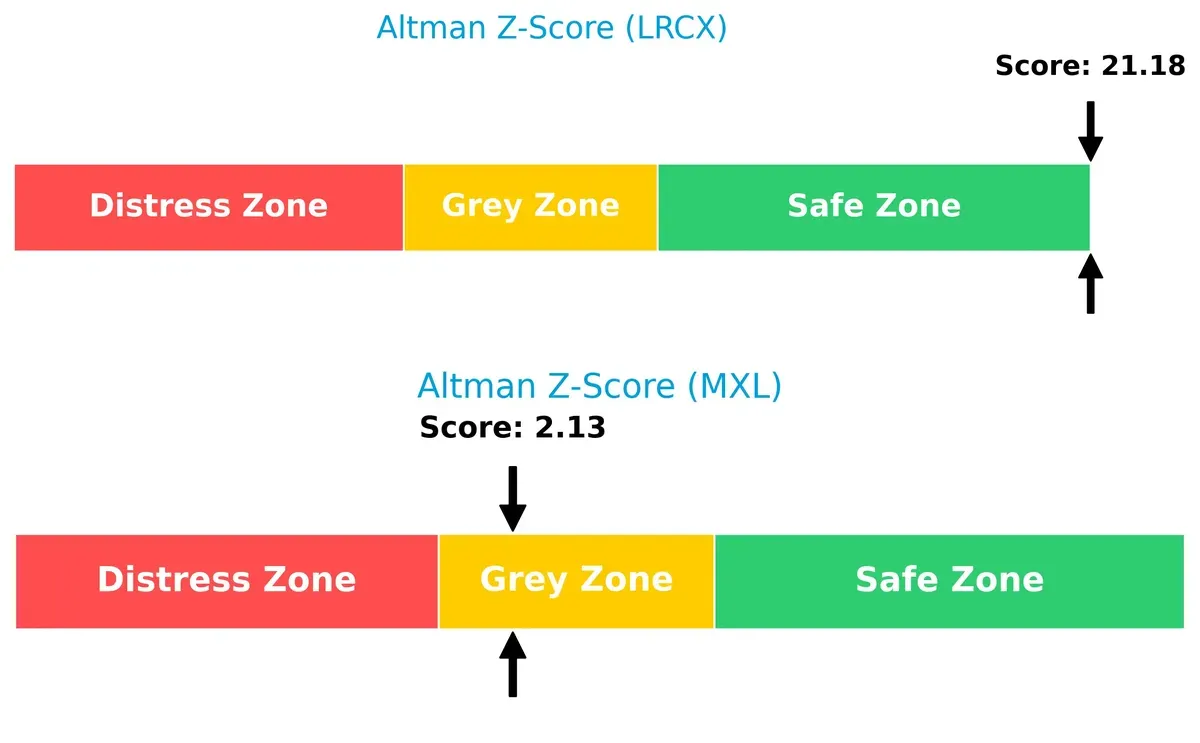
Bankruptcy Risk: Solvency Showdown
Lam Research’s Altman Z-Score of 21.2 firmly places it in the safe zone, signaling robust long-term solvency. In contrast, MaxLinear’s score of 2.13 lands in the grey zone, indicating moderate bankruptcy risk in this cycle:
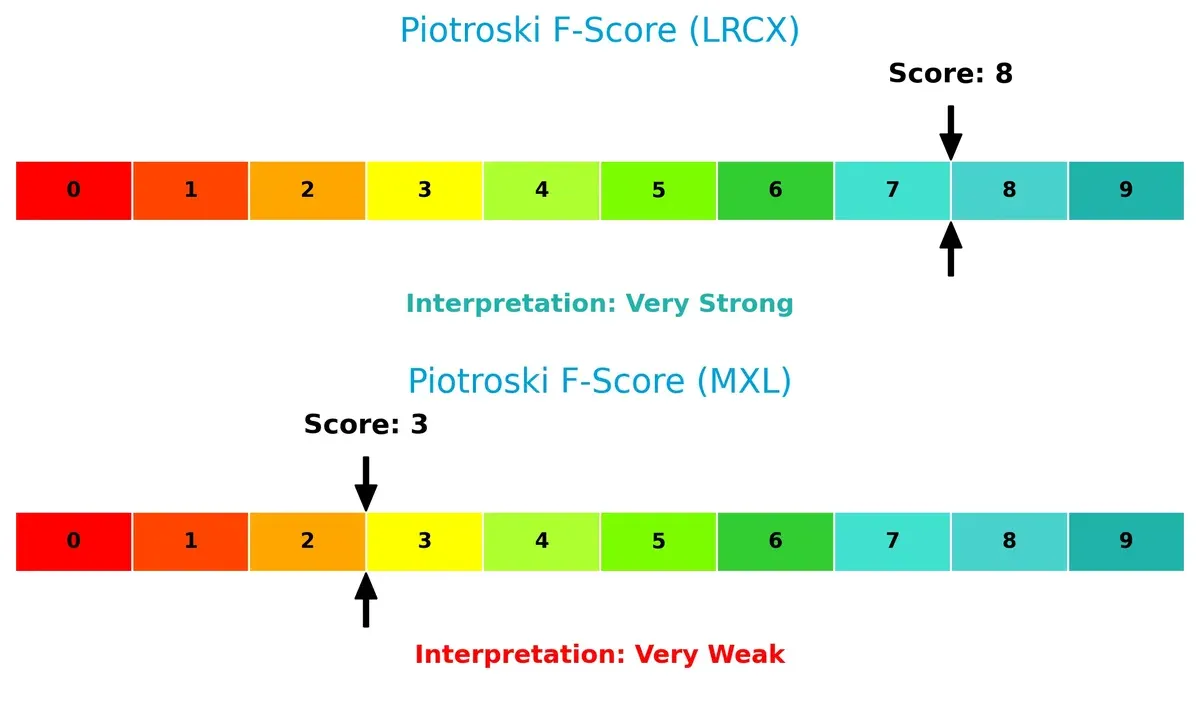
Financial Health: Quality of Operations
Lam Research’s Piotroski F-Score of 8 reflects very strong financial health and operational quality. MaxLinear’s score of 3 flags significant red flags, suggesting weak internal metrics and higher risk:
How are the two companies positioned?
This section dissects LRCX and MXL’s operational DNA by comparing their revenue distribution and internal strengths and weaknesses. The goal is to confront their economic moats to reveal which model offers the most resilient competitive advantage today.
Revenue Segmentation: The Strategic Mix
This comparison unpacks how Lam Research and MaxLinear diversify their income streams and reveals their core sector bets for 2025:
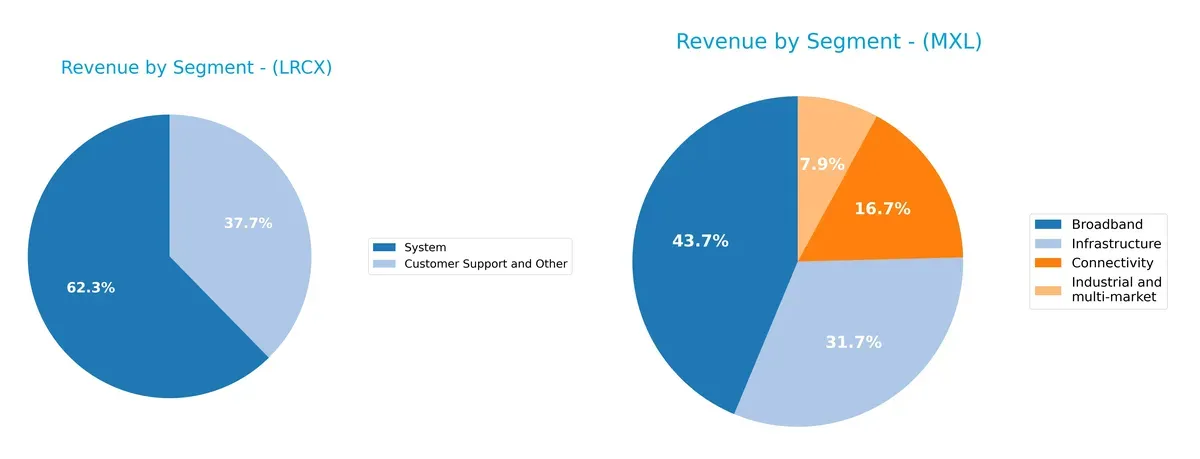
Lam Research anchors 62B USD revenue in “System,” dwarfing its 6.9B USD “Customer Support and Other” segment, showing a concentrated but robust tech infrastructure focus. MaxLinear, by contrast, pivots on a more balanced mix: “Broadband” leads at 204M USD, with “Infrastructure” at 148M USD and other segments contributing meaningfully. Lam’s concentration signals infrastructure dominance but heightens dependency risk. MaxLinear’s diversification cushions against volatility but may dilute scale advantages.
Strengths and Weaknesses Comparison
This table compares the Strengths and Weaknesses of Lam Research Corporation and MaxLinear, Inc.:
Lam Research Corporation Strengths
- High profitability with 29% net margin and 54% ROE
- Strong capital efficiency with 34% ROIC vs 12% WACC
- Solid liquidity ratios above 1.5
- Low leverage with debt-to-assets at 22%
- Diverse revenue streams across systems and support
- Significant global presence, notably in China and Korea
MaxLinear, Inc. Strengths
- Favorable current and quick ratios above 1.2
- Low debt-to-assets ratio at 17%
- Diverse product segments including broadband and infrastructure
- Moderate price-to-earnings ratio (negative but considered favorable)
- Presence in Asia and US markets
- Steady revenue from broadband and connectivity
Lam Research Corporation Weaknesses
- Unfavorable WACC at 12%, above ROIC benchmark
- High price-to-book ratio at 12.7 indicating premium valuation
- Dividend yield below 1%
- Neutral asset turnover at 0.86, suggesting moderate asset use efficiency
MaxLinear, Inc. Weaknesses
- Negative profitability metrics: -68% net margin and -47% ROE
- Negative interest coverage ratio signaling financial stress
- Low asset turnover at 0.42
- No dividend yield
- Unfavorable price-to-book ratio at 3.2
Lam Research shows robust profitability and financial strength, supported by global reach and diversified revenue. MaxLinear faces significant profitability challenges despite diversified products and decent liquidity. This contrast has implications for their strategic focus on operational efficiency and financial health.
The Moat Duel: Analyzing Competitive Defensibility
A structural moat is the only true shield protecting long-term profits from relentless competitive erosion in the semiconductor industry:
Lam Research Corporation: Capital Efficiency and Innovation Moat
Lam Research’s moat stems from superior capital allocation and advanced process technology. Its 21.9% ROIC premium over WACC drives high margins and stable profits. New product cycles in 2026 promise deeper market entrenchment.
MaxLinear, Inc.: Niche Integration Challenge
MaxLinear relies on product integration in RF and mixed-signal SoCs, but faces declining ROIC and negative margins. Its shrinking capital efficiency contrasts sharply with Lam’s. Growth hinges on breakthrough innovation to reverse current losses.
Capital Efficiency vs. Product Integration: The Moat Verdict
Lam Research commands a wider and more durable moat through consistent value creation and expanding profitability. MaxLinear’s deteriorating ROIC signals a fragile moat. Lam is decisively better positioned to defend and grow market share.
Which stock offers better returns?
The past year shows Lam Research Corporation’s stock surging over 160%, sharply outperforming MaxLinear, Inc., whose price remained nearly flat amid low volatility and modest upward momentum.
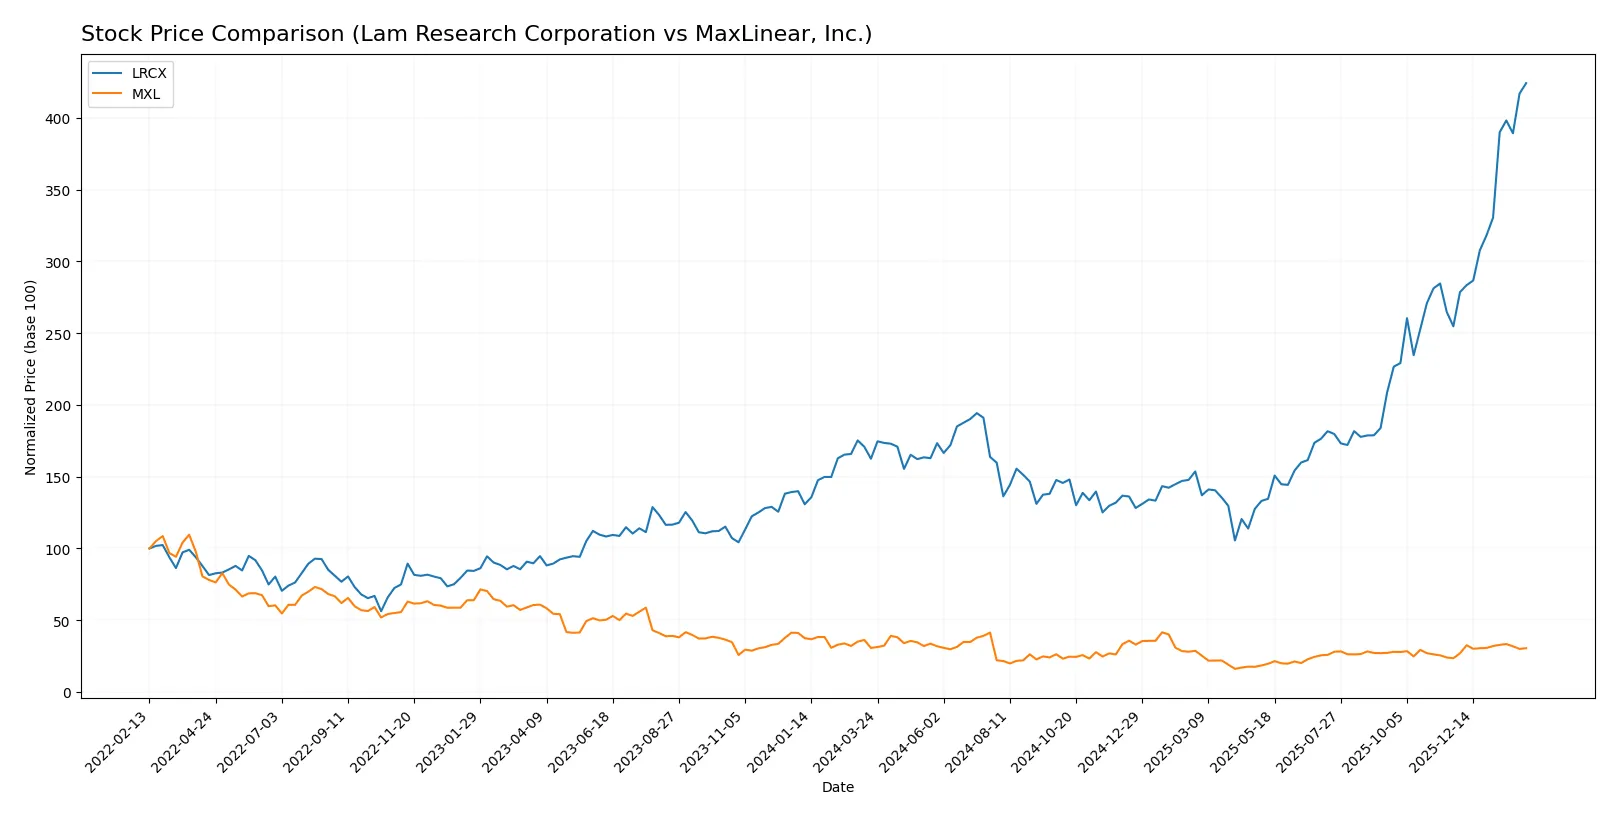
Trend Comparison
Lam Research shows a strong bullish trend over the past 12 months, with a 161% price increase and accelerating momentum. The stock peaked at $237.5 and bottomed at $59.1, reflecting high volatility.
MaxLinear’s stock trend is bearish over the same period, with a slight 0.6% price decline despite recent modest gains. It exhibits low volatility and a narrow price range between $9.3 and $24.1.
Lam Research delivers significantly higher market performance than MaxLinear, driven by robust price appreciation and dominant buyer volume throughout the year.
Target Prices
Analysts present a broad consensus on target prices for Lam Research Corporation and MaxLinear, Inc.
| Company | Target Low | Target High | Consensus |
|---|---|---|---|
| Lam Research Corporation | 127 | 325 | 266.76 |
| MaxLinear, Inc. | 15 | 25 | 21 |
Lam Research’s consensus target of 267 suggests significant upside from the current 237.5 price. MaxLinear’s target consensus at 21 also implies modest appreciation versus its 17.64 market price.

Don’t Let Luck Decide Your Entry Point
Optimize your entry points with our advanced ProRealTime indicators. You’ll get efficient buy signals with precise price targets for maximum performance. Start outperforming now!
How do institutions grade them?
Lam Research Corporation Grades
The table below displays recent grades from major financial institutions for Lam Research Corporation.
| Grading Company | Action | New Grade | Date |
|---|---|---|---|
| UBS | Maintain | Buy | 2026-01-29 |
| Wells Fargo | Maintain | Overweight | 2026-01-29 |
| JP Morgan | Maintain | Overweight | 2026-01-29 |
| RBC Capital | Maintain | Outperform | 2026-01-29 |
| Citigroup | Maintain | Buy | 2026-01-29 |
| Stifel | Maintain | Buy | 2026-01-29 |
| Morgan Stanley | Maintain | Equal Weight | 2026-01-29 |
| Needham | Maintain | Buy | 2026-01-29 |
| Susquehanna | Maintain | Positive | 2026-01-29 |
| Goldman Sachs | Maintain | Buy | 2026-01-29 |
MaxLinear, Inc. Grades
Below is a summary of recent grades from reputable firms for MaxLinear, Inc.
| Grading Company | Action | New Grade | Date |
|---|---|---|---|
| Wells Fargo | Maintain | Equal Weight | 2026-01-30 |
| Benchmark | Maintain | Buy | 2026-01-16 |
| Benchmark | Maintain | Buy | 2025-10-24 |
| Benchmark | Maintain | Buy | 2025-10-17 |
| Benchmark | Maintain | Buy | 2025-09-02 |
| Loop Capital | Maintain | Hold | 2025-08-04 |
| Wells Fargo | Maintain | Equal Weight | 2025-07-24 |
| Benchmark | Maintain | Buy | 2025-07-24 |
| Susquehanna | Maintain | Neutral | 2025-07-24 |
| Susquehanna | Maintain | Neutral | 2025-07-22 |
Which company has the best grades?
Lam Research consistently receives stronger grades, including multiple “Buy,” “Overweight,” and “Outperform” ratings. MaxLinear’s grades are more mixed, with several “Buy” but also “Hold,” “Equal Weight,” and “Neutral” ratings. Investors might interpret Lam Research’s higher consensus as a sign of stronger institutional confidence.
Risks specific to each company
The following categories identify the critical pressure points and systemic threats facing both firms in the 2026 market environment:
1. Market & Competition
Lam Research Corporation (LRCX)
- Dominates semiconductor equipment with strong innovation but faces intense global competition from rivals and cyclical demand.
MaxLinear, Inc. (MXL)
- Operates in a niche within communications SoCs but suffers from negative margins and intense competition from larger, diversified chipmakers.
2. Capital Structure & Debt
Lam Research Corporation (LRCX)
- Maintains a solid balance sheet with moderate leverage (D/E 0.48) and strong interest coverage (33.43x), indicating low financial risk.
MaxLinear, Inc. (MXL)
- Low leverage (D/E 0.29) but negative interest coverage (-13x) signals distress and inability to service debt comfortably.
3. Stock Volatility
Lam Research Corporation (LRCX)
- Beta of 1.78 suggests higher-than-market volatility, reflecting semiconductor cyclicality and sensitivity to tech cycles.
MaxLinear, Inc. (MXL)
- Similar beta of 1.71 indicates comparable volatility but with added risk from weak fundamentals and earnings instability.
4. Regulatory & Legal
Lam Research Corporation (LRCX)
- Faces typical semiconductor export controls and IP litigation risks, especially given global supply chain geopolitics.
MaxLinear, Inc. (MXL)
- Exposed to regulatory risks in communications standards and potential patent disputes, common in mixed-signal semiconductor space.
5. Supply Chain & Operations
Lam Research Corporation (LRCX)
- Complex global supply chains make it vulnerable to chip shortages and geopolitical tensions but benefits from scale and operational expertise.
MaxLinear, Inc. (MXL)
- Smaller scale increases vulnerability to supplier disruptions and less operational flexibility in volatile markets.
6. ESG & Climate Transition
Lam Research Corporation (LRCX)
- Increasing pressure to improve environmental footprint; already integrating sustainability in manufacturing but must accelerate to meet investor expectations.
MaxLinear, Inc. (MXL)
- ESG efforts less documented; lagging peers on climate initiatives could pose reputational and regulatory risks.
7. Geopolitical Exposure
Lam Research Corporation (LRCX)
- Significant exposure to US-China tensions due to sales and manufacturing footprint; risks include export restrictions and tariffs.
MaxLinear, Inc. (MXL)
- Also exposed to geopolitical risks in global communications markets but with less scale and diversification to absorb shocks.
Which company shows a better risk-adjusted profile?
Lam Research faces intense market competition and geopolitical risks but boasts a robust balance sheet, superior profitability, and strong financial health signals. MaxLinear struggles with profitability, negative interest coverage, and operational vulnerabilities, reflecting a higher risk profile. Recent scores confirm LRCX’s safe zone Altman Z-score (21.18) and very strong Piotroski (8), contrasted with MXL’s grey zone Z-score (2.13) and very weak Piotroski (3). The single largest risk for LRCX is geopolitical exposure impacting supply chains. For MXL, severe profitability and liquidity issues dominate. Overall, Lam Research presents a markedly better risk-adjusted profile for 2026 investors.
Final Verdict: Which stock to choose?
Lam Research Corporation’s superpower lies in its durable competitive advantage and exceptional capital efficiency. It consistently generates strong returns well above its cost of capital, signaling a robust economic moat. A point of vigilance is its relatively high price-to-book ratio, which suggests a premium valuation. This stock suits portfolios targeting aggressive growth with a tolerance for elevated valuation multiples.
MaxLinear, Inc. offers a promising strategic moat in its niche semiconductor technology, supported by strong R&D investment and potential for revenue expansion. Compared to Lam Research, MaxLinear presents a more cautious risk profile due to its ongoing profitability challenges and weaker cash flow generation. It fits investors looking for GARP—growth at a reasonable price—willing to weather operational volatility for upside potential.
If you prioritize strong economic moats and proven capital returns, Lam Research outshines as the compelling choice due to its consistent value creation and bullish market momentum. However, if you seek growth opportunities in emerging semiconductor segments with a more conservative valuation, MaxLinear offers better stability despite current earnings headwinds. Both scenarios require careful risk management aligned with your investment horizon.
Disclaimer: Investment carries a risk of loss of initial capital. The past performance is not a reliable indicator of future results. Be sure to understand risks before making an investment decision.
Go Further
I encourage you to read the complete analyses of Lam Research Corporation and MaxLinear, Inc. to enhance your investment decisions: