Home > Comparison > Technology > LRCX vs MRVL
The strategic rivalry between Lam Research Corporation and Marvell Technology defines the current trajectory of the semiconductor sector. Lam Research operates as a capital-intensive equipment manufacturer, while Marvell focuses on high-margin integrated circuit design. This clash highlights a battle between manufacturing scale and product innovation. This analysis aims to determine which corporate strategy offers superior risk-adjusted returns for a diversified technology portfolio.
Table of contents
Companies Overview
Lam Research and Marvell Technology stand as pivotal players shaping the semiconductor industry’s future.
Lam Research Corporation: Semiconductor Equipment Innovator
Lam Research dominates the semiconductor equipment market by designing and servicing advanced fabrication tools. Its revenue comes from selling systems for deposition, etching, and wafer cleaning critical to integrated circuit manufacturing. In 2026, the company emphasizes innovation in plasma-enhanced chemical vapor deposition and atomic layer deposition technologies to boost chip production efficiency globally.
Marvell Technology, Inc.: Integrated Circuits Specialist
Marvell leads in designing and selling integrated circuits including Ethernet controllers, processors, and storage solutions. It generates revenue primarily from networking and storage semiconductor products serving data centers and communications. Its 2026 strategy focuses on expanding high-performance ASICs and mixed-signal solutions to meet growing demands in cloud infrastructure and 5G networking.
Strategic Collision: Similarities & Divergences
Lam Research pursues a hardware-centric model focused on fabrication equipment, while Marvell champions chip design and system integration. Both battle for dominance in semiconductor supply chains but in distinct layers—equipment versus components. Their investment profiles diverge: Lam holds a capital-intensive manufacturing moat, whereas Marvell leverages scalable intellectual property and software-driven innovation.
Income Statement Comparison
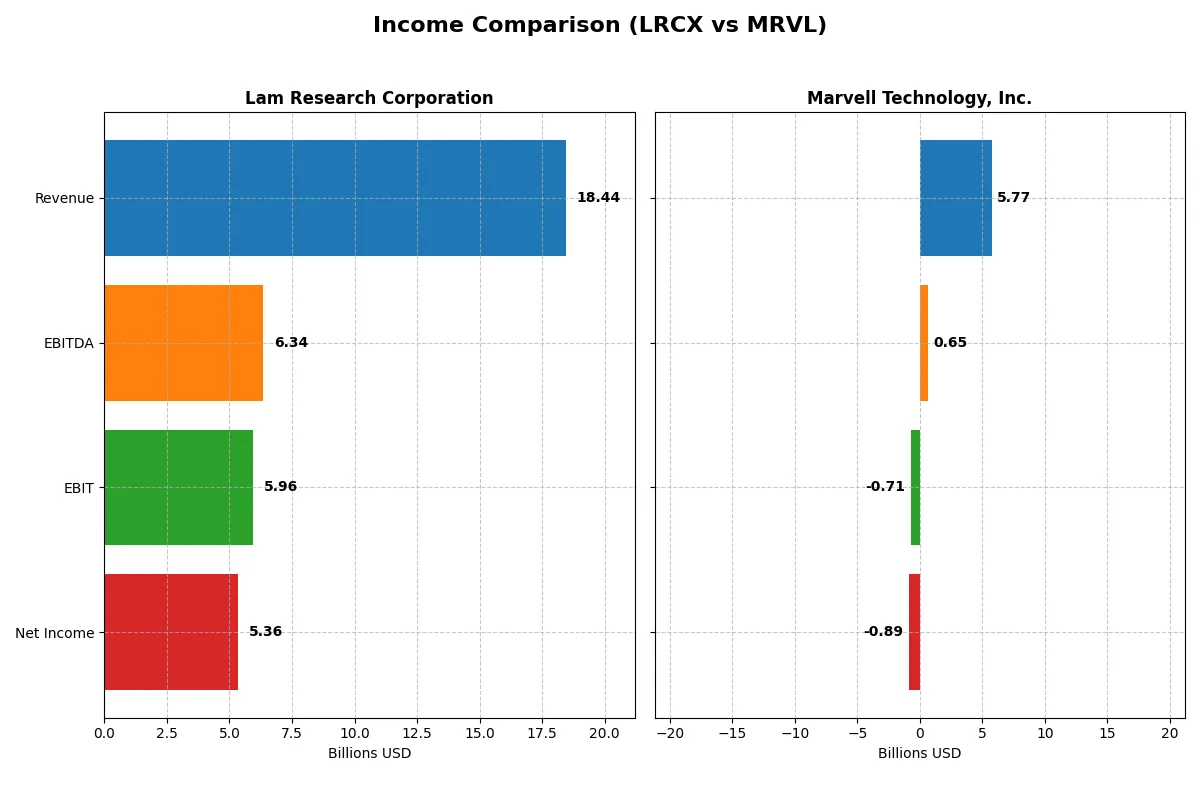
The following data dissects the core profitability and scalability of both corporate engines to reveal who dominates the bottom line:
| Metric | Lam Research Corporation (LRCX) | Marvell Technology, Inc. (MRVL) |
|---|---|---|
| Revenue | 18.4B | 5.77B |
| Cost of Revenue | 9.46B | 3.39B |
| Operating Expenses | 3.08B | 3.10B |
| Gross Profit | 8.98B | 2.38B |
| EBITDA | 6.34B | 652M |
| EBIT | 5.96B | -705M |
| Interest Expense | 178M | 189M |
| Net Income | 5.36B | -885M |
| EPS | 4.17 | -1.02 |
| Fiscal Year | 2025 | 2025 |
Income Statement Analysis: The Bottom-Line Duel
This income statement comparison reveals which company operates with greater efficiency and stronger profitability in a competitive market.
Lam Research Corporation Analysis
Lam Research’s revenue rose 24% year-over-year to 18.4B in 2025, while net income jumped 40% to 5.36B. Its gross margin stands at a robust 48.7%, with net margin healthy at 29.1%. The company shows strong momentum, improving EBIT margin to 32.3%, signaling excellent cost control and operational leverage.
Marvell Technology, Inc. Analysis
Marvell’s revenue grew modestly by 4.7% to 5.77B in 2025, but the company recorded a net loss of 885M. Gross margin remains decent at 41.3%, yet negative EBIT and net margins (-12.2% and -15.4%) highlight ongoing profitability challenges. Despite slight margin improvement, Marvell struggles with high expenses and negative bottom-line results.
Margin Dominance vs. Revenue Expansion
Lam Research outperforms Marvell with superior margins, strong net income growth, and efficient capital deployment. Marvell shows revenue expansion but suffers sustained losses and unfavorable margin trends. For investors prioritizing profitability and margin strength, Lam Research presents a more attractive profile than Marvell’s turnaround risk.
Financial Ratios Comparison
These vital ratios act as a diagnostic tool to expose the underlying fiscal health, valuation premiums, and capital efficiency of the companies analyzed:
| Ratios | Lam Research (LRCX) | Marvell Technology (MRVL) |
|---|---|---|
| ROE | 54.3% | -6.6% |
| ROIC | 34.0% | -3.9% |
| P/E | 23.4 | -110.4 |
| P/B | 12.7 | 7.3 |
| Current Ratio | 2.21 | 1.54 |
| Quick Ratio | 1.55 | 1.03 |
| D/E | 0.48 | 0.32 |
| Debt-to-Assets | 22.3% | 21.5% |
| Interest Coverage | 33.1 | -3.8 |
| Asset Turnover | 0.86 | 0.29 |
| Fixed Asset Turnover | 7.59 | 5.56 |
| Payout ratio | 21.5% | -23.4% |
| Dividend yield | 0.92% | 0.21% |
| Fiscal Year | 2025 | 2025 |
Efficiency & Valuation Duel: The Vital Signs
Ratios serve as the company’s DNA, uncovering hidden risks and operational strengths behind headline numbers.
Lam Research Corporation
Lam Research reports a robust 54.3% ROE and a strong 29.1% net margin, signaling superior profitability. Its P/E of 23.4 is fairly valued, while a high P/B of 12.7 flags potential overvaluation. The modest 0.92% dividend yield contrasts with solid reinvestment in R&D, fueling innovation and growth.
Marvell Technology, Inc.
Marvell suffers a negative ROE of -6.6% and a net margin of -15.4%, reflecting operational struggles. Despite a negative P/E, its EV/Sales ratio of 17.5 suggests the stock remains expensive. The company offers a low 0.21% dividend yield and channels heavy spending into R&D, attempting a turnaround through innovation.
Solid Profitability vs. Turnaround Risk
Lam Research balances strong profitability with fair valuation, offering operational stability. Marvell presents a higher risk profile, burdened by losses and stretched valuation. Investors seeking steady returns likely favor Lam’s efficiency, while those targeting potential recovery may consider Marvell’s growth-oriented but uncertain strategy.
Which one offers the Superior Shareholder Reward?
Lam Research (LRCX) delivers more attractive shareholder rewards in 2026. Its 0.92% dividend yield is supported by a prudent 21% payout ratio and robust free cash flow coverage (3.2x). Lam combines this with significant buybacks, enhancing total returns. Marvell (MRVL) pays a scant 0.21% yield with a negative payout ratio, signaling dividend sustainability concerns. Marvell’s reinvestment leans heavily into growth, but its negative profit margins and weak cash flow coverage (0.39x) undermine near-term distributions. I see Lam’s balanced dividend plus buyback approach as more sustainable and rewarding than Marvell’s growth-first model.
Comparative Score Analysis: The Strategic Profile
The radar chart reveals the fundamental DNA and trade-offs of Lam Research Corporation and Marvell Technology, Inc.:
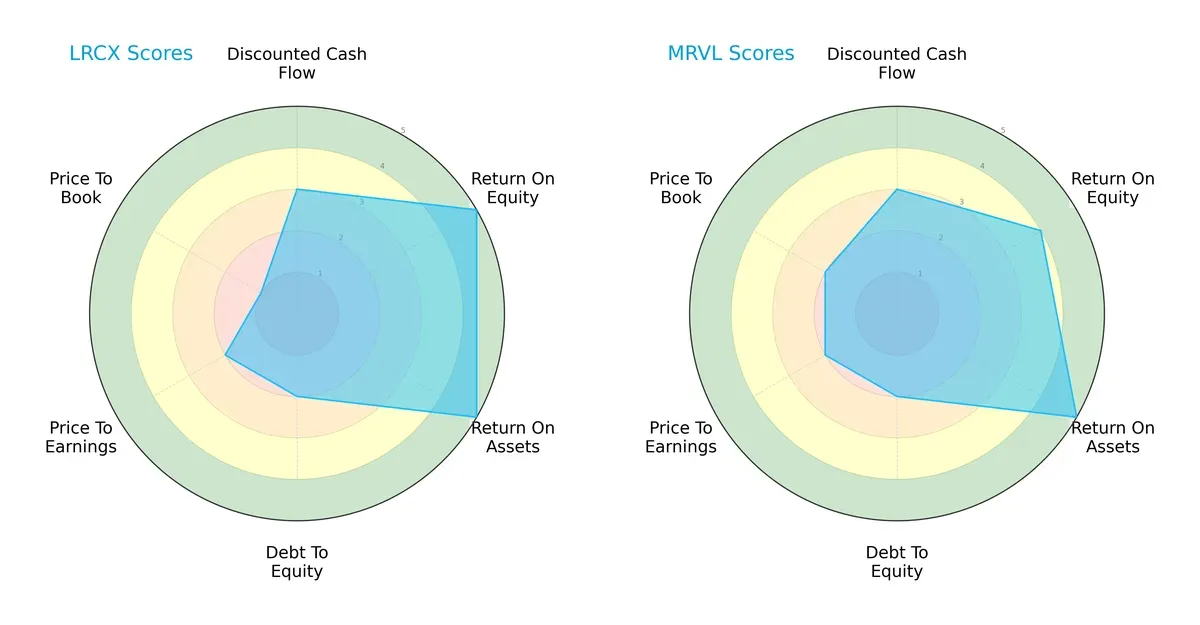
Lam Research delivers superior returns on equity (5 vs. 4) with equally strong asset efficiency (both 5). Marvell matches Lam on discounted cash flow (3) and debt management (2). However, Lam suffers from a notably weak price-to-book score (1 vs. 2), indicating valuation risk. Marvell offers a more balanced valuation profile, while Lam leans on its operational excellence to justify premium pricing.
—
Bankruptcy Risk: Solvency Showdown
Lam Research’s Altman Z-Score of 21.18 vastly exceeds Marvell’s 6.80, indicating a much stronger buffer against bankruptcy risk in this cycle:
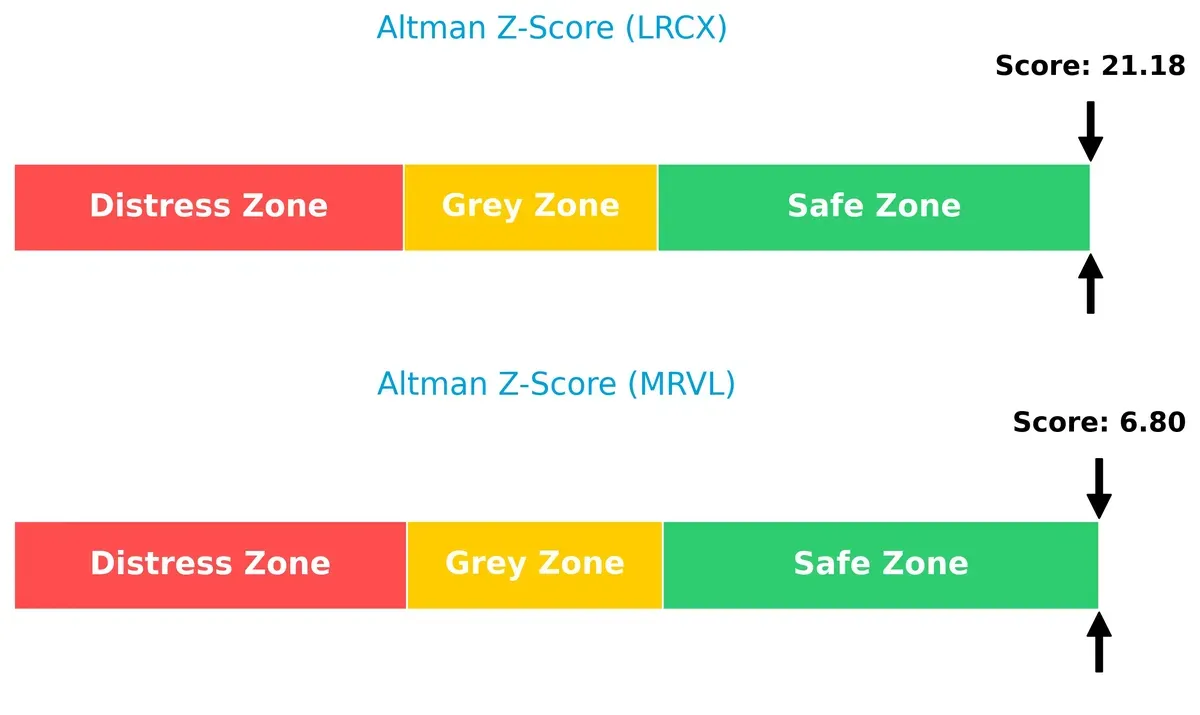
Lam sits deep in the safe zone, signaling exceptional financial stability. Marvell, while also safe, faces higher relative risk, suggesting investors should monitor leverage and liquidity trends closely.
—
Financial Health: Quality of Operations
Lam Research posts a Piotroski F-Score of 8, outpacing Marvell’s strong 7, highlighting more robust internal financial health and operational quality:
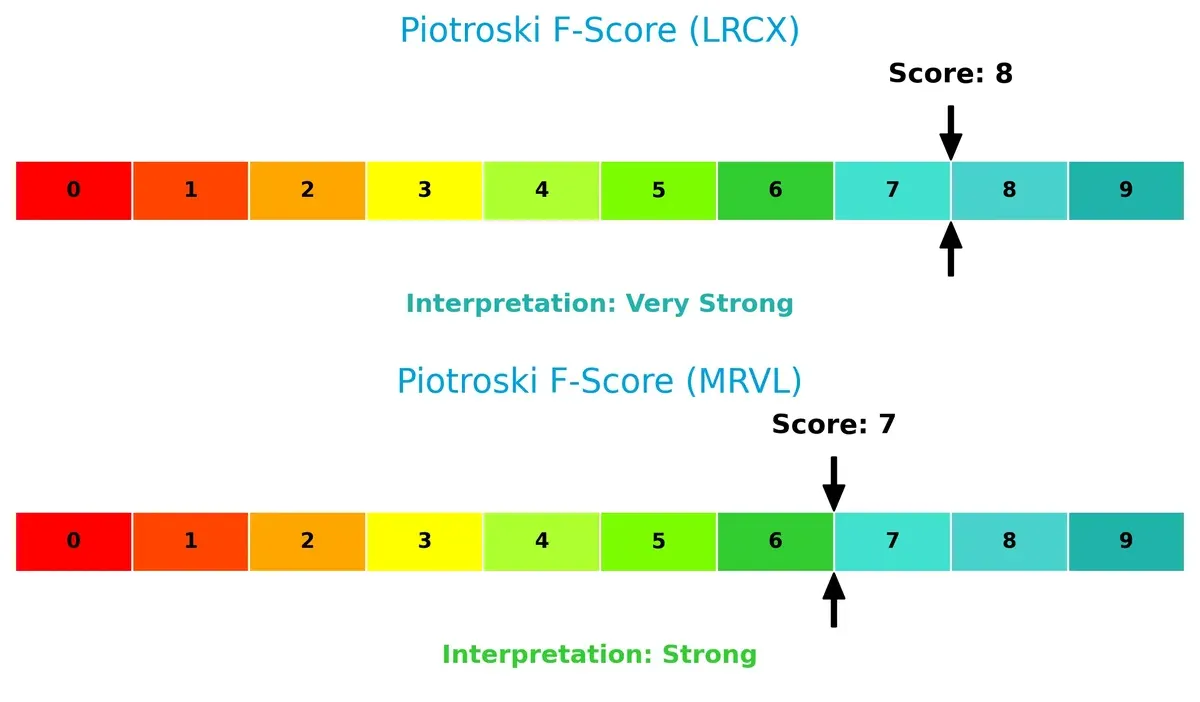
Lam’s near-peak score signals excellent profitability, liquidity, and efficiency metrics. Marvell remains solid but shows mild room for improvement, especially in internal value generation compared to Lam.
How are the two companies positioned?
This section dissects the operational DNA of Lam Research and Marvell by comparing their revenue distribution and analyzing internal strengths and weaknesses. The goal is to confront their economic moats to identify which business model delivers the most resilient competitive advantage today.
Revenue Segmentation: The Strategic Mix
This visual comparison dissects how Lam Research and Marvell Technology diversify their income streams and where their primary sector bets lie:
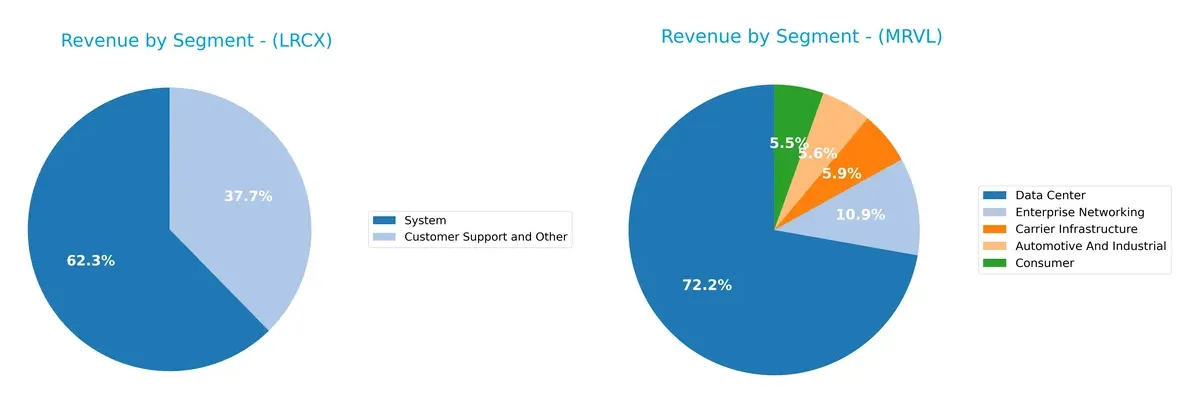
Lam Research anchors its revenue in two segments: Systems at $11.5B and Customer Support at $6.9B, showing a focused but balanced mix. Marvell dominates with a $4.16B Data Center segment but spreads the rest across Automotive, Carrier Infrastructure, Consumer, and Enterprise Networking, reflecting broader diversification. Lam’s concentrated model suggests deep ecosystem lock-in, while Marvell’s mix mitigates risk via multiple growth engines.
Strengths and Weaknesses Comparison
This table compares the Strengths and Weaknesses of Lam Research Corporation and Marvell Technology, Inc.:
Lam Research Corporation Strengths
- High profitability with 29% net margin
- Strong ROE at 54%
- Favorable liquidity ratios
- Low debt-to-assets ratio
- Diverse global presence including China and Korea
- Robust system segment revenues
Marvell Technology, Inc. Strengths
- Favorable current and quick ratios
- Moderate debt levels
- Presence in diverse product segments like Data Center and Automotive
- Significant revenue from China and US
- Favorable P/E due to negative earnings
Lam Research Corporation Weaknesses
- Unfavorable WACC relative to ROIC
- High price-to-book ratio
- Low dividend yield
- Neutral asset turnover ratio
Marvell Technology, Inc. Weaknesses
- Negative profitability metrics including net margin and ROE
- Unfavorable interest coverage ratio
- Low asset turnover
- Low dividend yield
- Unfavorable P/B ratio
Lam Research’s strengths lie in profitability and financial health, supporting its global system-focused strategy. Marvell faces profitability challenges despite solid liquidity and product diversification, indicating strategic execution risks.
The Moat Duel: Analyzing Competitive Defensibility
A structural moat is the only thing protecting long-term profits from the erosion of competition. Let’s dissect the unique moats of Lam Research and Marvell Technology:
Lam Research Corporation: Precision Engineering & High ROIC Moat
Lam Research’s moat stems from its specialized semiconductor equipment and high ROIC of over 20%, reflecting efficient capital use and pricing power. Its expanding product suite and rising profitability in 2026 signal a durable moat.
Marvell Technology, Inc.: Broad Portfolio but Declining Capital Efficiency
Marvell’s moat relies on diversified semiconductor solutions but suffers from a negative ROIC trend, indicating value destruction. Unlike Lam, Marvell’s profitability and competitive edge weaken, though growth in niche markets could offer upside.
Capital Efficiency vs. Portfolio Breadth: The Moat Showdown
Lam Research’s wide, durable moat driven by superior ROIC eclipses Marvell’s eroding capital returns. Lam is better positioned to defend its market share amid intensifying semiconductor competition.
Which stock offers better returns?
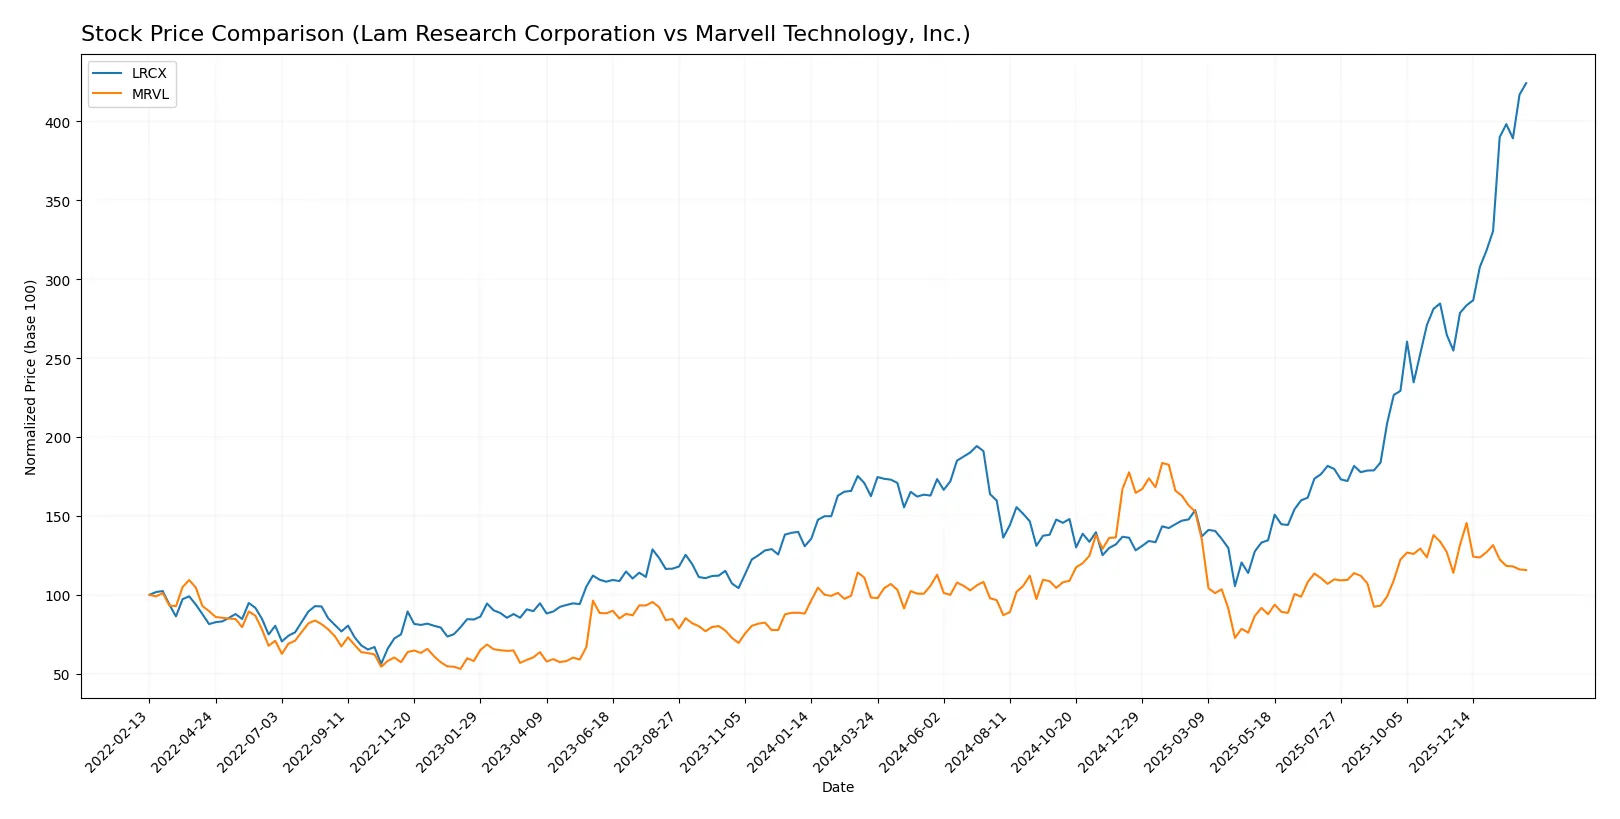
The past year shows divergent price dynamics for Lam Research and Marvell Technology, with Lam Research exhibiting a sharp uptrend and Marvell Technology delivering moderate gains amid contrasting buyer activity.
Trend Comparison
Lam Research’s stock price surged 161% over the past year, reflecting a strong bullish trend with accelerating momentum. Its price ranged from 59.09 to a high of 237.5, showing substantial volatility with a 39.19 standard deviation.
Marvell Technology’s stock rose 17.6% over the same period, maintaining a bullish but decelerating trend. The price fluctuated between 49.43 and 124.76, with lower volatility at a 16.41 standard deviation and recent price gains nearly flat at 1.56%.
Comparing both, Lam Research outperformed Marvell Technology significantly, delivering the highest market returns with accelerating momentum and stronger buyer dominance.
Target Prices
Analysts present a broad but optimistic consensus on target prices for Lam Research Corporation and Marvell Technology, Inc.
| Company | Target Low | Target High | Consensus |
|---|---|---|---|
| Lam Research Corporation | 127 | 325 | 266.76 |
| Marvell Technology, Inc. | 80 | 156 | 117 |
Lam Research’s consensus target at $267 exceeds its current $237.5 price, signaling upside potential. Marvell’s $117 target also sits well above the $78.66 market price, reflecting bullish analyst sentiment.

Don’t Let Luck Decide Your Entry Point
Optimize your entry points with our advanced ProRealTime indicators. You’ll get efficient buy signals with precise price targets for maximum performance. Start outperforming now!
How do institutions grade them?
Here is a summary of the latest institutional grades for Lam Research Corporation and Marvell Technology, Inc.:
Lam Research Corporation Grades
The table below shows recent grades from reputable financial institutions for Lam Research Corporation.
| Grading Company | Action | New Grade | Date |
|---|---|---|---|
| UBS | Maintain | Buy | 2026-01-29 |
| Wells Fargo | Maintain | Overweight | 2026-01-29 |
| JP Morgan | Maintain | Overweight | 2026-01-29 |
| RBC Capital | Maintain | Outperform | 2026-01-29 |
| Citigroup | Maintain | Buy | 2026-01-29 |
| Stifel | Maintain | Buy | 2026-01-29 |
| Morgan Stanley | Maintain | Equal Weight | 2026-01-29 |
| Needham | Maintain | Buy | 2026-01-29 |
| Susquehanna | Maintain | Positive | 2026-01-29 |
| Goldman Sachs | Maintain | Buy | 2026-01-29 |
Marvell Technology, Inc. Grades
The following table presents recent institutional grades for Marvell Technology, Inc.
| Grading Company | Action | New Grade | Date |
|---|---|---|---|
| Rosenblatt | Maintain | Buy | 2026-01-07 |
| Melius Research | Upgrade | Buy | 2026-01-05 |
| Benchmark | Downgrade | Hold | 2025-12-08 |
| JP Morgan | Maintain | Overweight | 2025-12-03 |
| Oppenheimer | Maintain | Outperform | 2025-12-03 |
| Roth Capital | Maintain | Buy | 2025-12-03 |
| Deutsche Bank | Maintain | Buy | 2025-12-03 |
| Needham | Maintain | Buy | 2025-12-03 |
| Evercore ISI Group | Maintain | Outperform | 2025-12-03 |
| Keybanc | Maintain | Overweight | 2025-12-03 |
Which company has the best grades?
Lam Research displays consistently strong buy and outperform ratings across top-tier firms. Marvell’s grades are mixed, including a downgrade to hold by Benchmark. Lam Research’s higher consensus grades may indicate stronger institutional confidence, potentially influencing investor sentiment.
Risks specific to each company
The following categories identify the critical pressure points and systemic threats facing both firms in the 2026 market environment:
1. Market & Competition
Lam Research Corporation
- Leading semiconductor equipment provider with strong market position but faces intense capital equipment cycles.
Marvell Technology, Inc.
- Competes in diverse semiconductor segments but struggles with profitability and lower asset turnover.
2. Capital Structure & Debt
Lam Research Corporation
- Conservative leverage with debt-to-equity at 0.48 and strong interest coverage of 33.4x.
Marvell Technology, Inc.
- Lower leverage (0.32 D/E) but negative interest coverage signals financial strain.
3. Stock Volatility
Lam Research Corporation
- Beta of 1.78 indicates higher-than-market volatility but within typical semiconductor range.
Marvell Technology, Inc.
- Higher beta at 1.95 suggests greater sensitivity to market swings and risk.
4. Regulatory & Legal
Lam Research Corporation
- Operates globally with exposure to trade restrictions, especially US-China tensions.
Marvell Technology, Inc.
- Also globally exposed; product diversity may mitigate some regulatory risks but still vulnerable.
5. Supply Chain & Operations
Lam Research Corporation
- Complex supply chain in advanced semiconductor fabrication; risks from component shortages persist.
Marvell Technology, Inc.
- Relies on global manufacturing hubs, facing supply chain disruption risks in Asia-Pacific regions.
6. ESG & Climate Transition
Lam Research Corporation
- Strong ESG initiatives expected in capital equipment sector; energy efficiency in manufacturing critical.
Marvell Technology, Inc.
- ESG efforts ongoing but profitability and operational challenges may limit investments in climate transition.
7. Geopolitical Exposure
Lam Research Corporation
- Significant exposure to US-China trade dynamics and export controls on semiconductor tech.
Marvell Technology, Inc.
- Similar geopolitical risks with added exposure to Southeast Asian manufacturing locations.
Which company shows a better risk-adjusted profile?
Lam Research faces substantial cyclical market risks but benefits from robust financial health and superior capital structure. Marvell exhibits operational and profitability weaknesses, reflected in negative margins and interest coverage, raising concerns about financial stability. Lam’s Altman Z-Score of 21.2 versus Marvell’s 6.8 underscores its safer profile. The most impactful risk for Lam is market cyclicality; for Marvell, it is financial distress. Lam’s strong liquidity and coverage position it better for 2026 market challenges.
Final Verdict: Which stock to choose?
Lam Research’s superpower lies in its durable competitive advantage, demonstrated by a robust and growing return on invested capital well above its cost of capital. This cash-generating machine excels in profitability and operational efficiency. A point of vigilance remains its premium valuation multiples, which could temper near-term upside. It suits an aggressive growth portfolio focused on quality leaders.
Marvell Technology’s strategic moat centers on its high R&D intensity and technology investment, positioning it for future innovation. However, its financials reveal challenges with negative returns and declining profitability, signaling higher risk. Relative to Lam Research, it offers more speculative appeal, fitting a growth-at-a-reasonable-price (GARP) investor willing to tolerate volatility for potential turnaround gains.
If you prioritize resilient profitability and proven value creation, Lam Research outshines as the compelling choice due to its strong economic moat and consistent cash flow generation. However, if you seek a high-risk, high-reward growth play with technological upside, Marvell offers a speculative opportunity despite its current financial headwinds. Each scenario demands careful risk assessment aligned with your investment horizon and tolerance.
Disclaimer: Investment carries a risk of loss of initial capital. The past performance is not a reliable indicator of future results. Be sure to understand risks before making an investment decision.
Go Further
I encourage you to read the complete analyses of Lam Research Corporation and Marvell Technology, Inc. to enhance your investment decisions: