Home > Comparison > Technology > LRCX vs LSCC
The strategic rivalry between Lam Research Corporation and Lattice Semiconductor Corporation shapes the semiconductor sector’s evolution. Lam Research operates as a capital-intensive equipment manufacturer with a broad global footprint. In contrast, Lattice Semiconductor focuses on specialized programmable chips, emphasizing nimble innovation. This analysis pits industrial scale against targeted agility to identify which trajectory delivers superior risk-adjusted returns. Investors will gain clarity on the optimal semiconductor exposure for a balanced portfolio.
Table of contents
Companies Overview
Lam Research Corporation and Lattice Semiconductor Corporation hold pivotal roles in the semiconductor industry, driving innovation and technology adoption globally.
Lam Research Corporation: Semiconductor Equipment Powerhouse
Lam Research Corporation leads as a semiconductor equipment designer and manufacturer. It generates revenue by selling advanced wafer fabrication tools like plasma etch and deposition systems. In 2026, its strategic focus remains on expanding high-precision equipment that supports next-generation chip manufacturing, reinforcing its leadership in improving die yield and process efficiency.
Lattice Semiconductor Corporation: FPGA Innovator
Lattice Semiconductor Corporation specializes in field programmable gate arrays (FPGAs) and semiconductor products. Its revenue stems from FPGA sales and IP licensing targeting communications, computing, and automotive markets. In 2026, Lattice prioritizes broadening its product portfolio with low-power, cost-effective solutions, aiming to enhance connectivity and customization in embedded systems worldwide.
Strategic Collision: Similarities & Divergences
Lam Research and Lattice diverge sharply in their business models; Lam operates a capital-intensive, high-barrier equipment market, while Lattice pursues scalable FPGA solutions and IP licensing. Their primary battleground lies in semiconductor innovation, with Lam focusing on fabrication tools and Lattice on programmable logic devices. These differences create distinct investment profiles: Lam offers industrial scale and precision; Lattice presents agility and niche specialization.
Income Statement Comparison
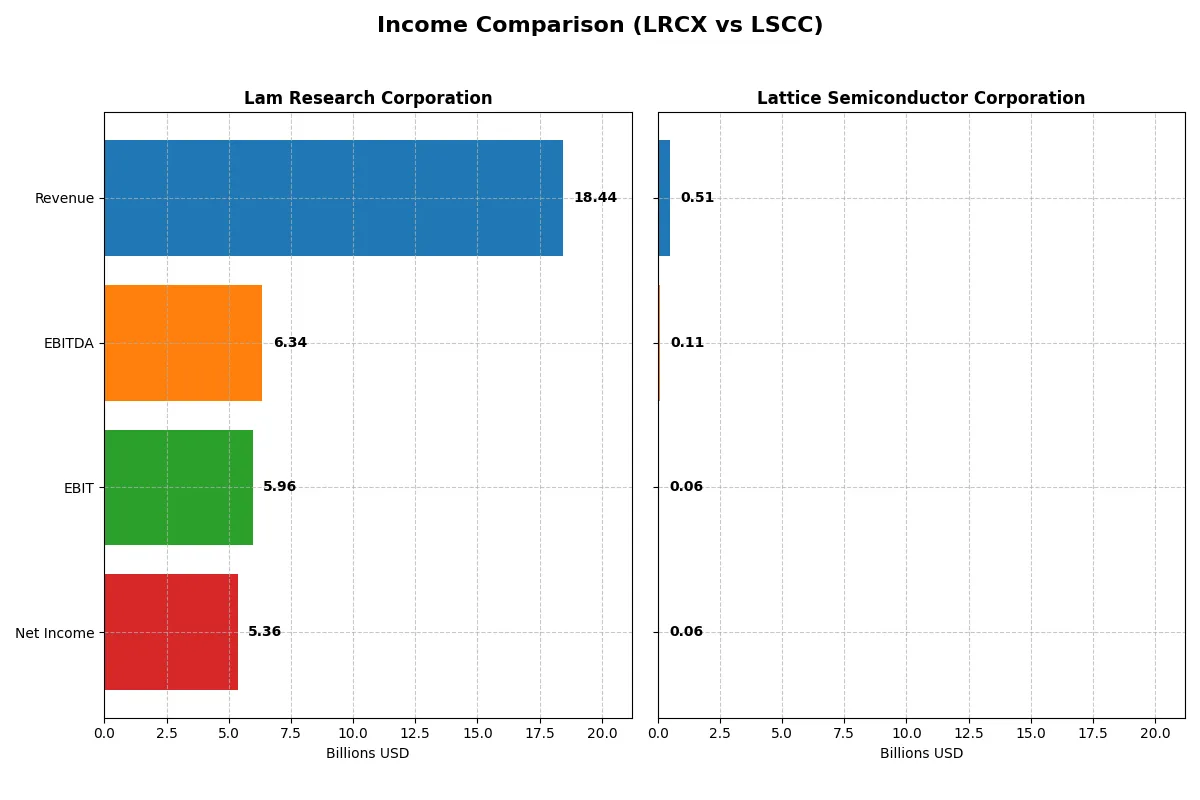
This data dissects the core profitability and scalability of both corporate engines to reveal who dominates the bottom line:
| Metric | Lam Research Corporation (LRCX) | Lattice Semiconductor Corporation (LSCC) |
|---|---|---|
| Revenue | 18.4B | 509M |
| Cost of Revenue | 9.5B | 169M |
| Operating Expenses | 3.1B | 306M |
| Gross Profit | 9.0B | 340M |
| EBITDA | 6.3B | 107M |
| EBIT | 6.0B | 61M |
| Interest Expense | 178M | 0.27M |
| Net Income | 5.4B | 61M |
| EPS | 4.17 | 0.44 |
| Fiscal Year | 2025 | 2024 |
Income Statement Analysis: The Bottom-Line Duel
This income statement comparison reveals the true efficiency and profitability dynamics powering each company’s financial engine.
Lam Research Corporation Analysis
Lam Research’s revenue grew 23.7% to $18.4B in 2025, with net income surging 40% to $5.36B. The company maintains a strong gross margin of 48.7% and a robust net margin of 29.1%, reflecting excellent operational leverage. Recent momentum is evident as EBIT expanded 31%, signaling impressive efficiency and profitability gains.
Lattice Semiconductor Corporation Analysis
Lattice Semiconductor’s 2024 revenue declined 31% to $509M, with net income plunging 76% to $61M. Despite a healthy gross margin of 66.8%, the net margin halved to 12%. The sharp drop in EBIT by 72% highlights weakening profitability and operational challenges in the latest fiscal year.
Margin Strength vs. Revenue Momentum
Lam Research delivers superior scale and margin expansion, driving consistent bottom-line growth. Lattice Semiconductor shows strong product-level margins but struggles with declining revenue and profitability. For investors, Lam’s profile offers more reliable earnings power, while Lattice carries higher risk amid recent volatility.
Financial Ratios Comparison
These vital ratios act as a diagnostic tool to expose the underlying fiscal health, valuation premiums, and capital efficiency of the companies compared below:
| Ratios | Lam Research (LRCX) | Lattice Semiconductor (LSCC) |
|---|---|---|
| ROE | 54.3% | 8.6% |
| ROIC | 34.0% | 4.6% |
| P/E | 23.4 | 132.7 |
| P/B | 12.7 | 11.4 |
| Current Ratio | 2.21 | 3.66 |
| Quick Ratio | 1.55 | 2.62 |
| D/E | 0.48 | 0.02 |
| Debt-to-Assets | 22.3% | 1.8% |
| Interest Coverage | 33.1 | 129.5 |
| Asset Turnover | 0.86 | 0.60 |
| Fixed Asset Turnover | 7.59 | 7.62 |
| Payout Ratio | 21.5% | 0% |
| Dividend Yield | 0.92% | 0% |
| Fiscal Year | 2025 | 2024 |
Efficiency & Valuation Duel: The Vital Signs
Financial ratios act as a company’s DNA, exposing hidden risks and operational strengths vital for sound investment decisions.
Lam Research Corporation
Lam Research exhibits robust profitability with a 54.33% ROE and a strong 29.06% net margin, signaling operational excellence. Its P/E ratio of 23.36 suggests a fairly valued stock, neither cheap nor stretched. Despite a low 0.92% dividend yield, Lam reinvests heavily in R&D, fueling sustained growth and shareholder value.
Lattice Semiconductor Corporation
Lattice Semiconductor posts a modest 8.6% ROE and a 12% net margin, indicating weaker profitability. The stock’s P/E ratio at 132.74 marks it as highly expensive. It pays no dividend, focusing instead on aggressive R&D investment at over 31% of revenue, aiming to drive future growth despite current valuation pressures.
Premium Valuation vs. Operational Safety
Lam Research offers a superior balance of high returns on equity and reasonable valuation, reflecting operational strength with manageable risk. Lattice’s expensive valuation paired with lower profitability suggests higher risk without current income. Investors preferring stable, efficient operations will likely find Lam’s profile more fitting.
Which one offers the Superior Shareholder Reward?
Lam Research Corporation (LRCX) provides a balanced distribution approach with a 0.92% dividend yield and a 21.5% payout ratio, supported by strong free cash flow coverage (3.2x). It also executes steady buybacks, enhancing total returns. Lattice Semiconductor Corporation (LSCC) pays no dividends but reinvests aggressively in growth and R&D, reflected in its high margins but elevated valuation multiples (P/E > 130). LSCC’s buyback activity is negligible. I see LRCX’s sustainable dividend plus buybacks as delivering superior shareholder reward in 2026, combining income and capital appreciation, while LSCC’s model, though growth-oriented, remains riskier and less immediately rewarding.
Comparative Score Analysis: The Strategic Profile
The radar chart reveals the fundamental DNA and trade-offs of Lam Research and Lattice Semiconductor, illustrating their core financial strengths and weaknesses:
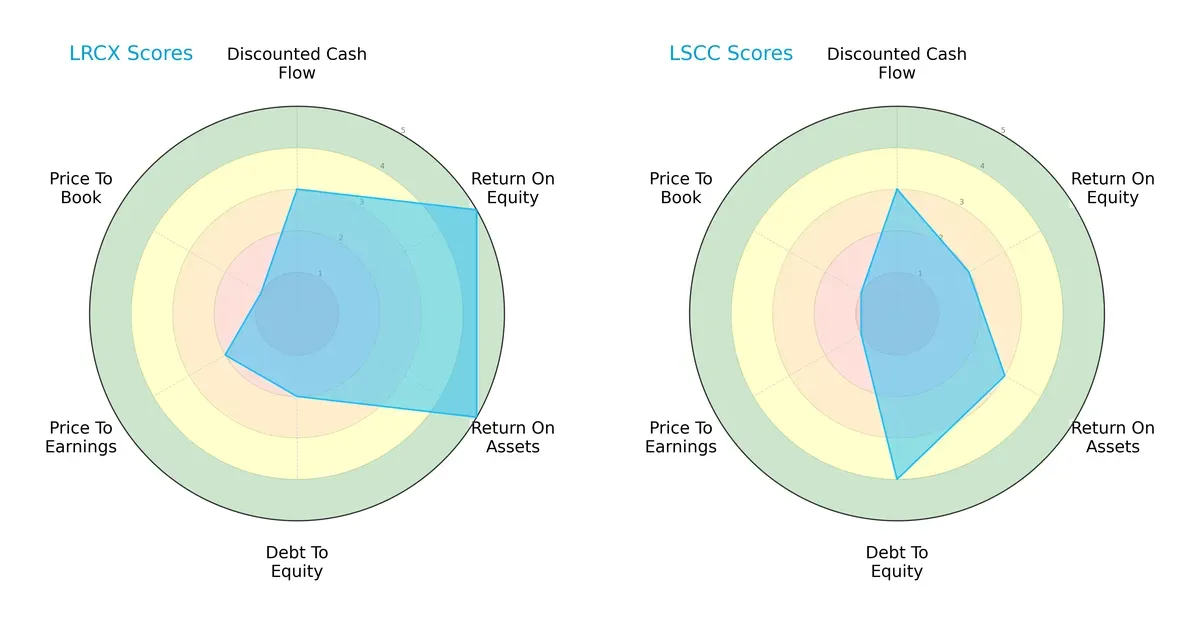
Lam Research boasts superior profitability with top ROE and ROA scores (5 each), reflecting excellent capital efficiency. Lattice Semiconductor counters with a stronger balance sheet, evidenced by a favorable debt-to-equity score (4 vs. Lam’s 2). Both firms share moderate DCF scores (3), but Lam trades at a relatively less attractive valuation, given its weaker P/E (2) and P/B (1) scores. Overall, Lam Research presents a more balanced profile powered by operational efficiency, while Lattice leans on financial prudence with lower leverage.
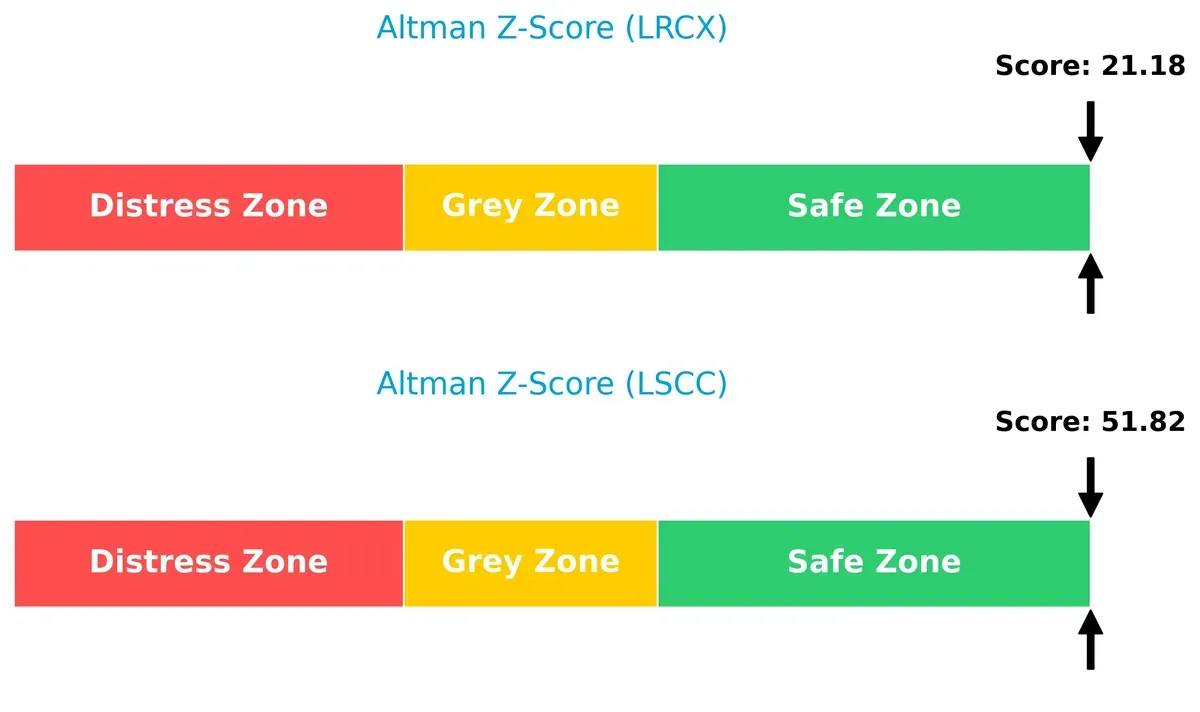
Bankruptcy Risk: Solvency Showdown
Lam Research’s Altman Z-Score stands at 21.18, while Lattice Semiconductor’s is even higher at 51.82, placing both comfortably in the safe zone. This wide gap indicates exceptional solvency for both, with Lattice showing an especially robust buffer against bankruptcy risks in this cycle:
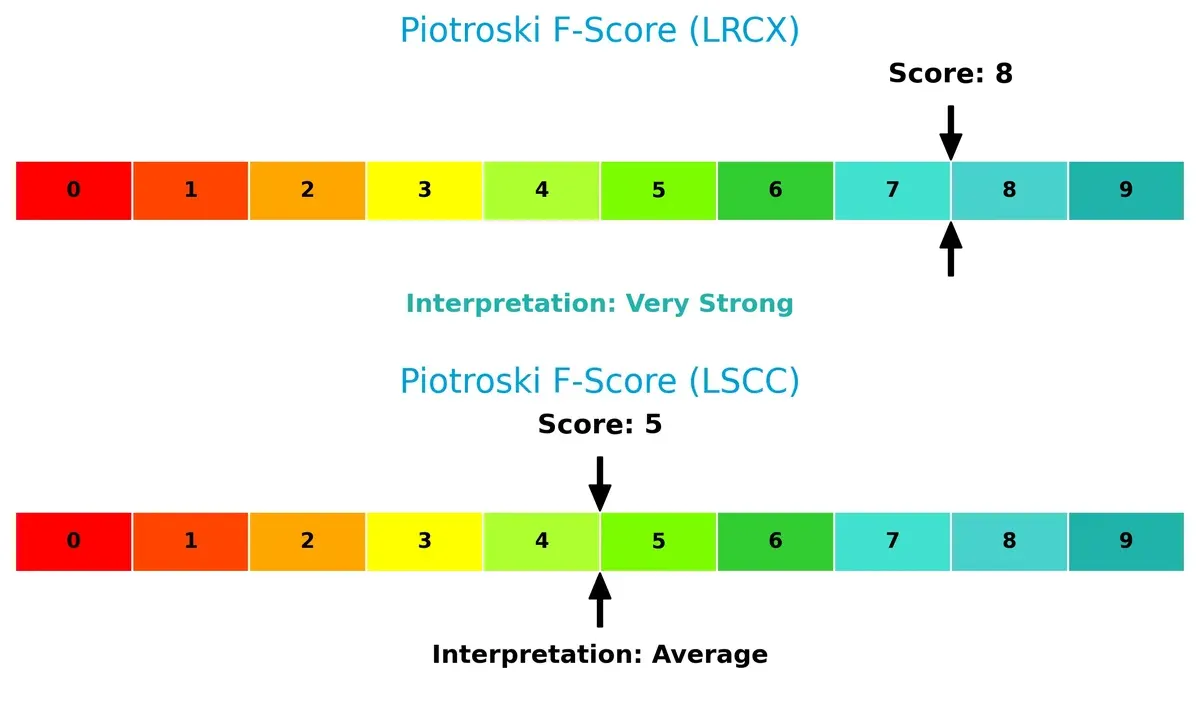
Financial Health: Quality of Operations
Lam Research scores an 8 on the Piotroski F-Score, signaling very strong financial health with solid profitability, liquidity, and operational efficiency. Lattice Semiconductor’s 5 marks an average standing, indicating moderate strength but potential red flags in internal metrics compared to Lam:
How are the two companies positioned?
This section dissects Lam Research and Lattice Semiconductor’s operational DNA by comparing revenue distribution and internal strengths and weaknesses. The goal is to confront their economic moats and reveal which model offers the most resilient, sustainable advantage today.
Revenue Segmentation: The Strategic Mix
This visual comparison dissects how Lam Research Corporation and Lattice Semiconductor diversify their income streams and highlights their primary sector bets:
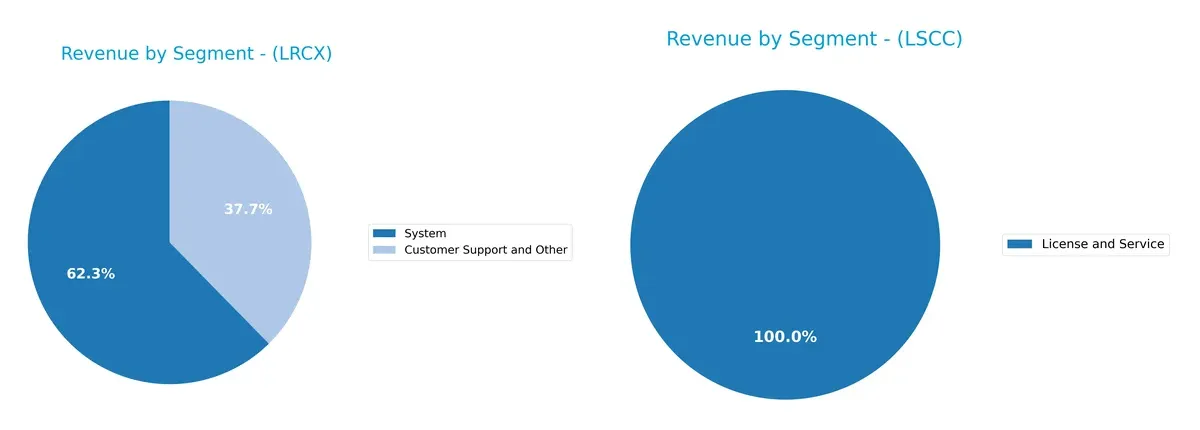
Lam Research anchors its revenue in two strong segments: Systems at $11.5B and Customer Support at $6.9B, reflecting a balanced mix with infrastructure dominance. Lattice Semiconductor, by contrast, pivots almost entirely on Product Revenue and Licensing, with a heavy skew toward distributors at $331M, indicating concentration risk. Lam’s diversified segmentation supports ecosystem lock-in, while Lattice’s model hinges on a narrower, distribution-heavy channel.
Strengths and Weaknesses Comparison
This table compares the strengths and weaknesses of Lam Research Corporation and Lattice Semiconductor Corporation:
LRCX Strengths
- High net margin of 29.06%
- Strong ROE at 54.33%
- Solid ROIC of 34.0%
- Favorable debt-to-assets ratio at 22.28%
- Diverse geographic sales including China and Korea
- Robust fixed asset turnover at 7.59
LSCC Strengths
- Favorable net margin at 12.0%
- Very low debt-to-assets at 1.81%
- Exceptional interest coverage at 228.11
- High quick ratio of 2.62
- Favorable fixed asset turnover at 7.62
- Global sales presence in Asia and Americas
LRCX Weaknesses
- WACC higher than ROIC at 12.09%
- Unfavorable price-to-book at 12.69
- Dividend yield below 1%
- Neutral asset turnover at 0.86
- Limited product diversification, mainly systems and support
LSCC Weaknesses
- Low ROE at 8.6%
- ROIC below WACC at 4.59%
- High P/E of 132.74 indicating overvaluation
- Unfavorable price-to-book at 11.41
- Current ratio flagged unfavorable at 3.66
- No dividend yield
Lam Research shows strong profitability and financial health but carries valuation and capital cost concerns. Lattice Semiconductor’s low leverage and interest coverage contrast with weaker profitability and valuation risks. Both require strategic focus on improving capital efficiency and market positioning.
The Moat Duel: Analyzing Competitive Defensibility
A structural moat is the only true shield protecting long-term profits from relentless competitive erosion. Let’s dissect the core moats of two semiconductor players:
Lam Research Corporation: Durable Innovation & Scale Advantage
Lam Research leverages Intangible Assets and scale, reflected in a very favorable 22% ROIC premium over WACC and margin stability near 30%. Its growing ROIC signals durable competitive advantage. Expansion into advanced wafer processing deepens this moat, especially in Asia’s semiconductor hubs in 2026.
Lattice Semiconductor Corporation: Niche IP and Market Focus
Lattice’s moat centers on specialized Intangible Assets and IP licensing, contrasting Lam’s broad scale. However, Lattice’s declining ROIC, now well below WACC, shows weakening profitability. The firm’s focus on low-power FPGAs offers growth opportunities but faces stiff competition that may further erode margins.
Verdict: Scale & Innovation vs. Niche Specialization
Lam Research commands a wider and deeper moat with robust value creation and durable profitability. Lattice’s fading ROIC warns of value destruction. Lam is better equipped to defend and expand its market share in 2026’s competitive semiconductor landscape.
Which stock offers better returns?
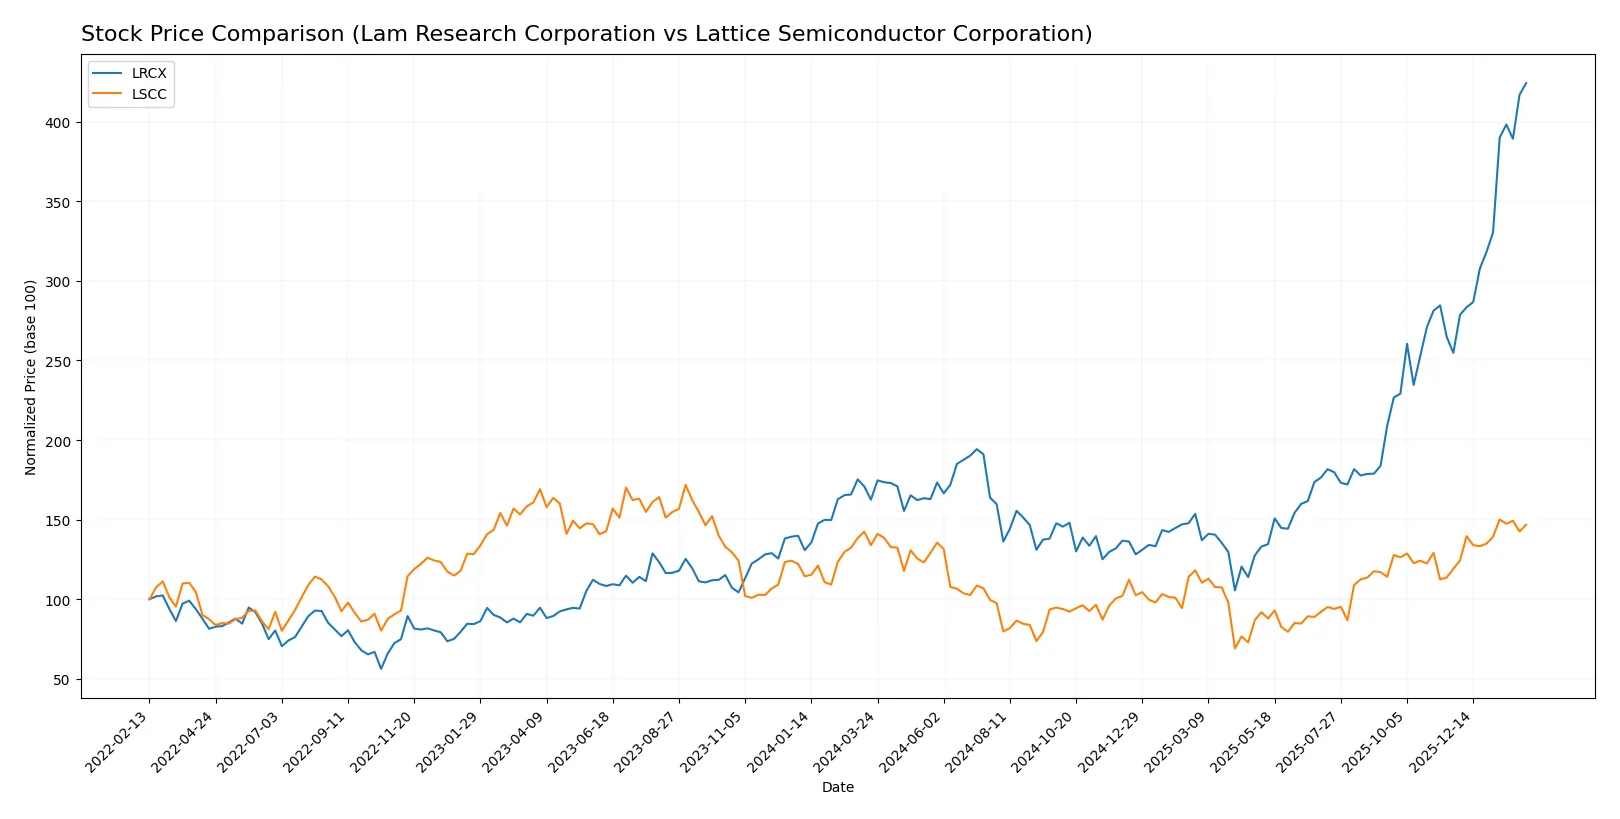
The past year reveals stark contrasts in price momentum and trading activity for Lam Research and Lattice Semiconductor, highlighting Lam’s pronounced upward acceleration versus Lattice’s moderate gains.
Trend Comparison
Lam Research’s stock surged 161% over the past year, marking a strong bullish trend with accelerating gains and significant volatility, peaking at 237.5 and bottoming at 59.09.
Lattice Semiconductor’s stock rose 9.6% over the same period, also bullish but with lower volatility and a smaller acceleration, hitting a high of 84.8 and a low of 39.03.
Lam Research outperformed Lattice Semiconductor substantially, delivering the highest market performance with a far steeper and more volatile upward trajectory.
Target Prices
Analysts present a broad yet constructive target consensus for Lam Research and Lattice Semiconductor.
| Company | Target Low | Target High | Consensus |
|---|---|---|---|
| Lam Research Corporation | 127 | 325 | 266.76 |
| Lattice Semiconductor Corporation | 65 | 105 | 84.67 |
Lam Research’s consensus target of 267 implies a 12% upside from the current 238 price, reflecting strong confidence amid semiconductor cycle strength. Lattice Semiconductor’s 85 target sits close to its 83 market price, indicating modest upside potential with balanced risk.

Don’t Let Luck Decide Your Entry Point
Optimize your entry points with our advanced ProRealTime indicators. You’ll get efficient buy signals with precise price targets for maximum performance. Start outperforming now!
How do institutions grade them?
Lam Research Corporation Grades
Here are the recent grades from notable financial institutions for Lam Research Corporation:
| Grading Company | Action | New Grade | Date |
|---|---|---|---|
| UBS | Maintain | Buy | 2026-01-29 |
| Wells Fargo | Maintain | Overweight | 2026-01-29 |
| JP Morgan | Maintain | Overweight | 2026-01-29 |
| RBC Capital | Maintain | Outperform | 2026-01-29 |
| Citigroup | Maintain | Buy | 2026-01-29 |
| Stifel | Maintain | Buy | 2026-01-29 |
| Morgan Stanley | Maintain | Equal Weight | 2026-01-29 |
| Needham | Maintain | Buy | 2026-01-29 |
| Susquehanna | Maintain | Positive | 2026-01-29 |
| Goldman Sachs | Maintain | Buy | 2026-01-29 |
Lattice Semiconductor Corporation Grades
Below are recent institutional grades for Lattice Semiconductor Corporation:
| Grading Company | Action | New Grade | Date |
|---|---|---|---|
| Susquehanna | Maintain | Positive | 2026-01-22 |
| Keybanc | Maintain | Overweight | 2026-01-13 |
| Baird | Maintain | Outperform | 2025-11-04 |
| Rosenblatt | Maintain | Buy | 2025-11-04 |
| Benchmark | Maintain | Buy | 2025-11-04 |
| Stifel | Maintain | Buy | 2025-11-04 |
| Needham | Maintain | Buy | 2025-11-04 |
| Susquehanna | Maintain | Positive | 2025-10-22 |
| Keybanc | Maintain | Overweight | 2025-09-30 |
| Needham | Maintain | Buy | 2025-09-22 |
Which company has the best grades?
Lam Research Corporation holds consistently strong grades across top-tier firms with multiple Buy and Outperform ratings. Lattice Semiconductor also receives solid grades but shows slightly older and fewer recent ratings. Investors may view Lam Research’s current, broad institutional support as a sign of stronger market confidence.
Risks specific to each company
The following categories identify the critical pressure points and systemic threats facing both firms in the 2026 market environment:
1. Market & Competition
Lam Research Corporation
- Operates in highly competitive semiconductor equipment market with strong global players.
Lattice Semiconductor Corporation
- Faces intense competition in FPGA and specialized semiconductor niches, limiting market share growth.
2. Capital Structure & Debt
Lam Research Corporation
- Moderate debt level (D/E 0.48), strong interest coverage (33.43), indicating manageable leverage.
Lattice Semiconductor Corporation
- Very low debt (D/E 0.02) and excellent interest coverage (228.11), signaling conservative leverage.
3. Stock Volatility
Lam Research Corporation
- Beta 1.78 shows higher-than-market volatility, reflecting sensitivity to tech cycles.
Lattice Semiconductor Corporation
- Beta 1.67 also above market average, but slightly less volatile than LRCX.
4. Regulatory & Legal
Lam Research Corporation
- Subject to global export controls and IP regulations impacting supply and sales, especially in China.
Lattice Semiconductor Corporation
- Faces IP licensing risks and regulatory scrutiny in international markets, particularly in Asia.
5. Supply Chain & Operations
Lam Research Corporation
- Relies on complex, global supply chains vulnerable to geopolitical tensions and component shortages.
Lattice Semiconductor Corporation
- Smaller scale but also exposed to semiconductor supply constraints and distributor dependencies.
6. ESG & Climate Transition
Lam Research Corporation
- Increasingly pressured to reduce carbon footprint and comply with environmental standards globally.
Lattice Semiconductor Corporation
- Emerging ESG initiatives but limited compared to larger peers; may face investor scrutiny.
7. Geopolitical Exposure
Lam Research Corporation
- Significant international operations with exposure to US-China tech tensions and export restrictions.
Lattice Semiconductor Corporation
- Also exposed to US-China relations, notably in Asia-Pacific customer base and supply chain.
Which company shows a better risk-adjusted profile?
Lam Research’s primary risk is geopolitical exposure, impacting supply and market access amid US-China tensions. Lattice Semiconductor’s biggest risk lies in stretched valuation metrics, notably a high P/E of 132.7 and weak profitability metrics. Despite Lam’s higher volatility, its robust capital structure and strong profitability yield a better risk-adjusted profile. Lattice’s limited scale and financial weaknesses heighten investment risk. The recent surge in Lattice’s stock price despite modest earnings growth justifies caution.
Final Verdict: Which stock to choose?
Lam Research Corporation’s superpower lies in its durable competitive advantage, demonstrated by a consistently high ROIC well above its WACC. This cash-generating engine excels in capital efficiency and profitability. A point of vigilance remains its premium valuation multiples, which could pressure returns. It fits well in aggressive growth portfolios seeking quality leadership in semiconductors.
Lattice Semiconductor Corporation’s strategic moat centers on its niche in programmable logic devices and strong R&D focus, providing innovation-driven upside. Relative to Lam, it offers a safer balance sheet with low leverage but faces challenges in profitability and declining ROIC trends. It suits GARP investors who can tolerate volatility for potential turnaround gains.
If you prioritize sustained value creation and robust profitability, Lam Research outshines with superior capital returns and growth momentum. However, if you seek exposure to innovation with a more conservative financial structure, Lattice Semiconductor offers better stability despite its current profitability headwinds. Each stock appeals to distinct investor profiles balancing growth and risk.
Disclaimer: Investment carries a risk of loss of initial capital. The past performance is not a reliable indicator of future results. Be sure to understand risks before making an investment decision.
Go Further
I encourage you to read the complete analyses of Lam Research Corporation and Lattice Semiconductor Corporation to enhance your investment decisions: