Home > Comparison > Technology > LRCX vs KLAC
The strategic rivalry between Lam Research Corporation and KLA Corporation defines the current trajectory of the semiconductor sector. Lam Research operates as a capital-intensive manufacturer of semiconductor processing equipment, while KLA focuses on high-margin process control and yield management solutions. This head-to-head reflects a battle between hardware-intensive production and software-driven precision. This analysis will identify which model offers a superior risk-adjusted return for a diversified technology portfolio.
Table of contents
Companies Overview
Lam Research Corporation and KLA Corporation stand as pivotal players in semiconductor equipment and process control.
Lam Research Corporation: Semiconductor Fabrication Equipment Leader
Lam Research dominates the semiconductor manufacturing equipment sector by designing and servicing wafer fabrication tools. Its revenue relies heavily on advanced equipment for deposition, etching, and cleaning processes. In 2026, Lam emphasizes innovation in atomic layer deposition and plasma-enhanced chemical vapor deposition to sustain its competitive edge in wafer processing technologies.
KLA Corporation: Process Control and Yield Management Specialist
KLA leads in semiconductor process control and yield management solutions, providing inspection, metrology, and defect analysis tools. Its core revenue stems from integrated circuit manufacturing support and specialty semiconductor services. In 2026, KLA focuses on expanding its software-driven process control capabilities and advanced inspection technologies to address growing complexity in semiconductor fabrication.
Strategic Collision: Similarities & Divergences
Lam and KLA both serve semiconductor makers but diverge in focus: Lam prioritizes physical wafer fabrication tools, while KLA excels in process control and yield optimization. Their primary battleground is the semiconductor production line efficiency and quality assurance. Investors should note Lam’s hardware-heavy profile contrasts with KLA’s software-integrated approach, reflecting distinct risk and growth dynamics in the technology sector.
Income Statement Comparison
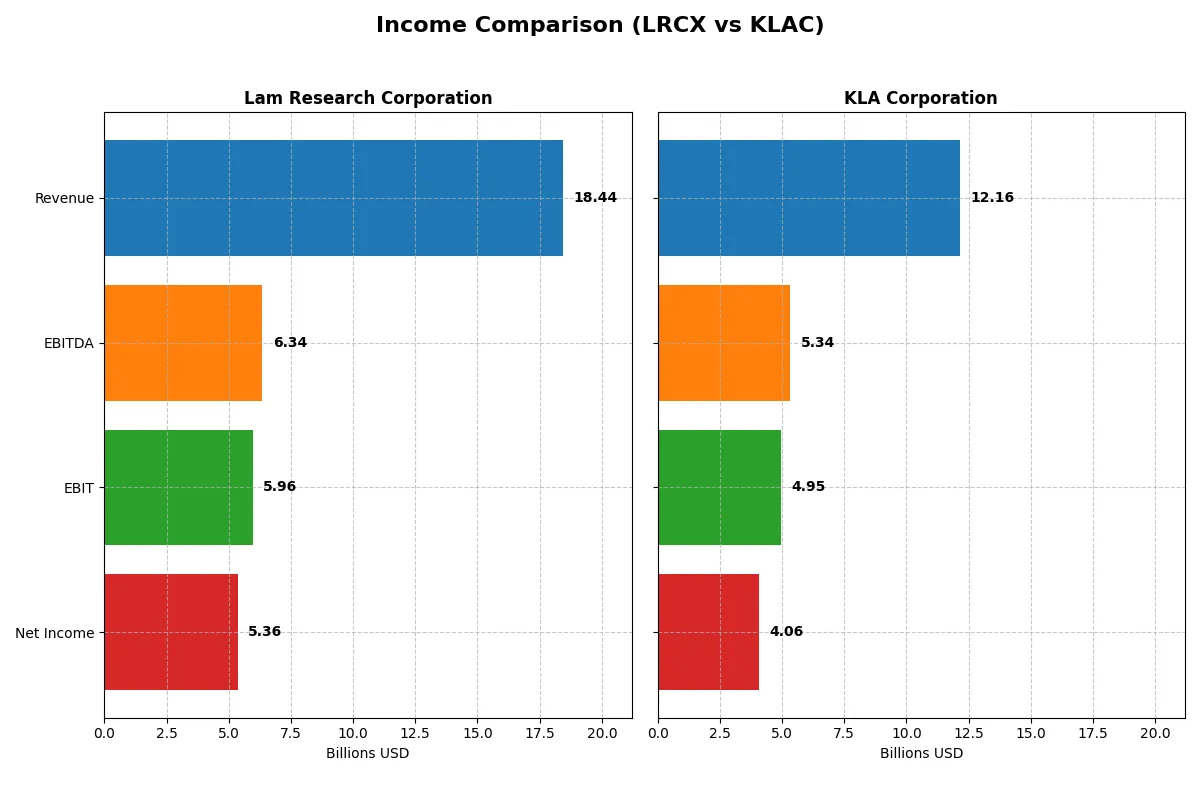
This data dissects the core profitability and scalability of both corporate engines to reveal who dominates the bottom line:
| Metric | Lam Research Corporation (LRCX) | KLA Corporation (KLAC) |
|---|---|---|
| Revenue | 18.4B | 12.2B |
| Cost of Revenue | 9.5B | 4.6B |
| Operating Expenses | 3.1B | 2.3B |
| Gross Profit | 9.0B | 7.6B |
| EBITDA | 6.3B | 5.3B |
| EBIT | 6.0B | 4.9B |
| Interest Expense | 178M | 302M |
| Net Income | 5.4B | 4.1B |
| EPS | 4.17 | 30.53 |
| Fiscal Year | 2025 | 2025 |
Income Statement Analysis: The Bottom-Line Duel
This income statement comparison reveals which company operates its financial engine with superior efficiency and growth momentum.
Lam Research Corporation Analysis
Lam Research’s revenue rose from $14.9B in 2024 to $18.4B in 2025, a 23.7% jump. Net income surged 40%, reaching $5.36B, signaling strong earnings power. Gross margin stands at a healthy 48.7%, while net margin improved to 29.1%. The 2025 figures highlight efficient cost management and expanding profitability.
KLA Corporation Analysis
KLA’s revenue climbed 23.9% to $12.2B in 2025, alongside a net income leap of 47% to $4.06B. Gross margin impresses at 62.3%, and net margin hits 33.4%, reflecting exceptional profitability. The company’s strong operational leverage and robust earnings growth underscore a powerful financial momentum.
Verdict: Margin Power vs. Revenue Scale
KLA outperforms Lam Research in margin strength, boasting superior gross and net margins. However, Lam Research leads in absolute revenue and net income scale. For investors valuing margin dominance and growth rate, KLA presents a compelling profile. Those favoring larger revenue streams and solid margin expansion may prefer Lam Research’s trajectory.
Financial Ratios Comparison
These vital ratios act as a diagnostic tool to expose the underlying fiscal health, valuation premiums, and capital efficiency of each company:
| Ratios | Lam Research Corporation (LRCX) | KLA Corporation (KLAC) |
|---|---|---|
| ROE | 54.33% | 86.56% |
| ROIC | 34.00% | 37.97% |
| P/E | 23.36 | 29.34 |
| P/B | 12.69 | 25.39 |
| Current Ratio | 2.21 | 2.62 |
| Quick Ratio | 1.55 | 1.83 |
| D/E (Debt-to-Equity) | 0.48 | 1.30 |
| Debt-to-Assets | 22.28% | 37.89% |
| Interest Coverage | 33.11 | 17.34 |
| Asset Turnover | 0.86 | 0.76 |
| Fixed Asset Turnover | 7.59 | 9.70 |
| Payout Ratio | 21.45% | 22.27% |
| Dividend Yield | 0.92% | 0.76% |
| Fiscal Year | 2025 | 2025 |
Efficiency & Valuation Duel: The Vital Signs
Financial ratios serve as a company’s DNA, exposing hidden risks and operational strengths crucial for investment decisions.
Lam Research Corporation
Lam Research shows strong profitability with a 54.3% ROE and 29.1% net margin, reflecting robust operational efficiency. Its P/E of 23.4 signals a fairly valued stock amid a favorable ROIC of 34%. Shareholder returns lean on modest dividends (0.92%), with significant reinvestment in R&D supporting growth and innovation.
KLA Corporation
KLA demonstrates superior profitability with an 86.6% ROE and 33.4% net margin, but trades at a stretched P/E of 29.3, indicating a premium valuation. Its ROIC of 38% remains attractive, though higher debt levels raise caution. Dividend yield is lower at 0.76%, with reinvestment focusing on R&D to sustain its competitive edge.
Premium Valuation vs. Operational Safety
KLA commands higher profitability but at a premium price and elevated leverage, increasing risk. Lam Research offers a better balance with strong returns, healthier leverage, and a more reasonable valuation. Investors favoring stability and value may prefer Lam, while those seeking growth at a premium might consider KLA.
Which one offers the Superior Shareholder Reward?
I see Lam Research (LRCX) delivers a 0.92% dividend yield with a moderate 21% payout, well-covered by free cash flow (FCF/OCF ~88%). Its buybacks are consistent but less aggressive. KLA (KLAC) yields 0.76% with a 22% payout, also FCF-covered (~92%), but it runs a far larger buyback program. KLAC’s higher margins (net 33% vs. LRCX’s 29%) and strong buyback intensity suggest a more aggressive capital return strategy. However, KLAC carries heavier leverage (debt/equity 1.3 vs. 0.48) which raises risk. I judge KLAC’s total shareholder return potential as superior in 2026, assuming stable market conditions, due to its robust buybacks and margin profile. LRCX’s steadier balance sheet offers a safer but slower growth in shareholder rewards.
Comparative Score Analysis: The Strategic Profile
The radar chart reveals the fundamental DNA and trade-offs of Lam Research Corporation and KLA Corporation, illuminating their core financial strengths and weaknesses:
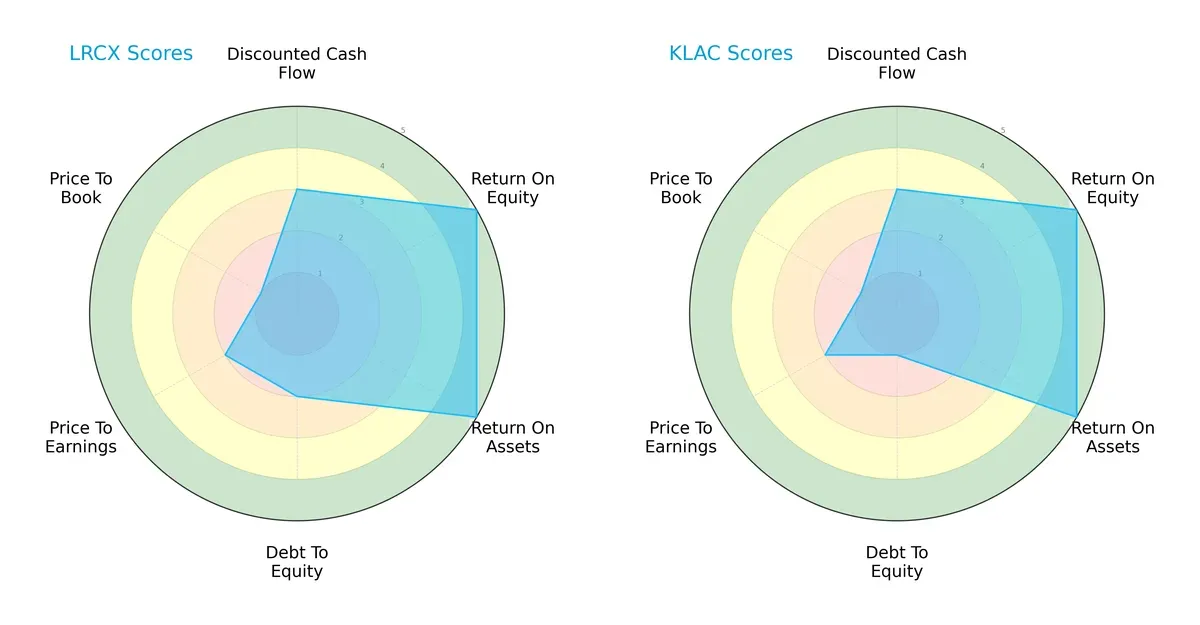
Both firms excel in return on equity (ROE) and return on assets (ROA), scoring very favorably at 5 each. Lam Research holds a moderate advantage in debt-to-equity with a score of 2 versus KLA’s 1, indicating a slightly better balance sheet leverage. Valuation metrics (PE/PB) remain weak for both, with Lam Research marginally better priced on PE but equally unfavorable on price-to-book. Overall, Lam Research presents a more balanced financial profile, while KLA depends heavily on its asset efficiency edge.
Bankruptcy Risk: Solvency Showdown
Lam Research’s Altman Z-Score of 21.18 significantly outpaces KLA’s 12.62, both safely above the distress threshold, confirming strong solvency in this cycle:
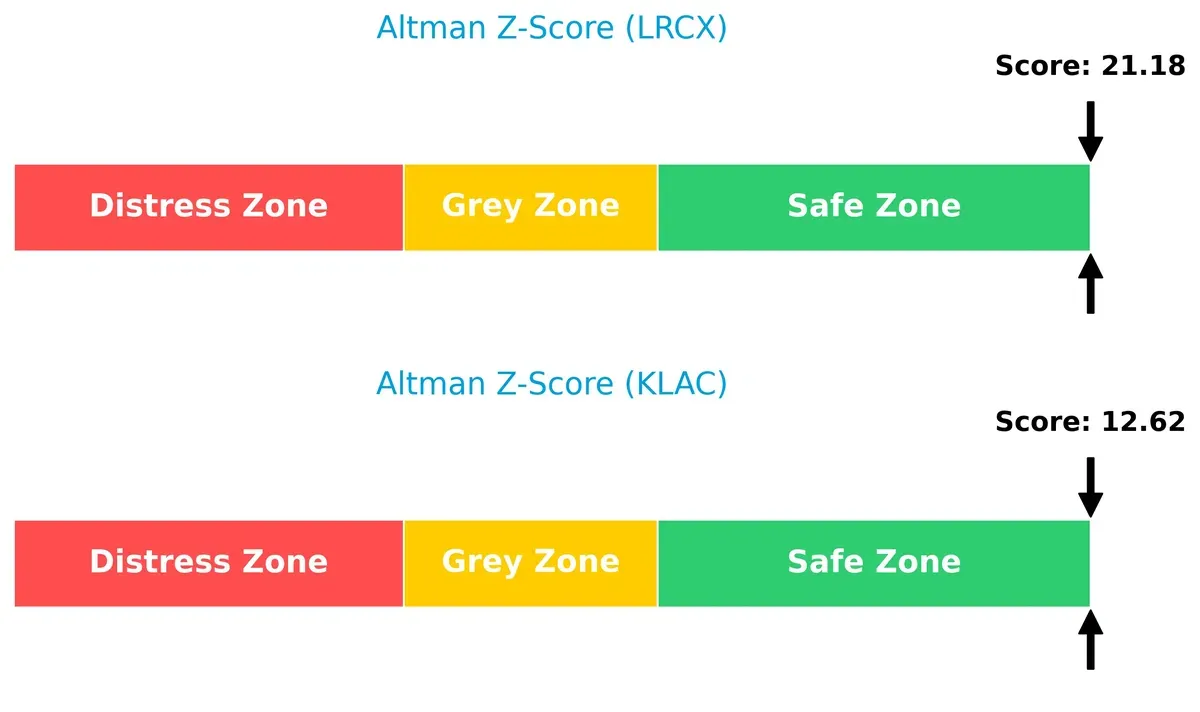
This large delta underscores Lam’s superior buffer against financial distress, signaling its capacity to withstand economic shocks better than KLA.
Financial Health: Quality of Operations
Both companies score 8 on the Piotroski F-Score, indicating very strong financial health and operational quality:
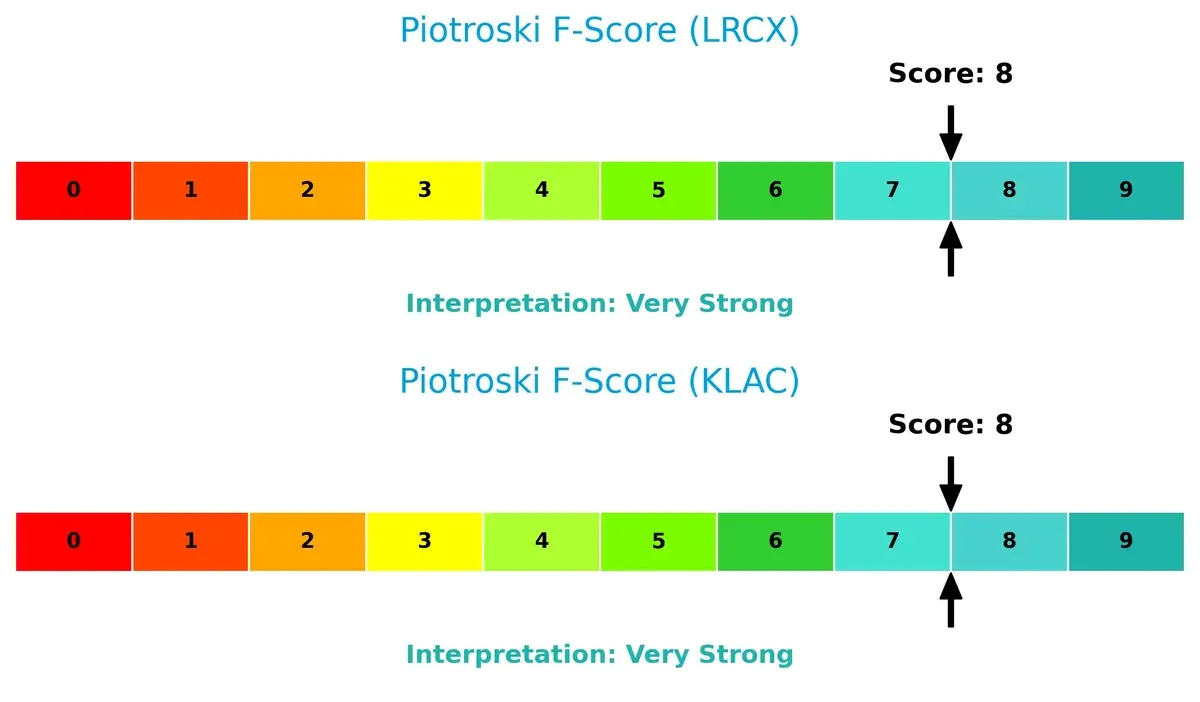
Their high scores reflect robust profitability, efficient asset use, and prudent leverage management. Neither firm shows red flags internally, reinforcing their positions as financially sound investments.
How are the two companies positioned?
This section dissects LRCX and KLAC’s operational DNA by comparing their revenue distribution and internal strengths and weaknesses. The goal is to confront their economic moats and identify the more resilient, sustainable competitive advantage today.
Revenue Segmentation: The Strategic Mix
This visual comparison dissects how Lam Research Corporation and KLA Corporation diversify their income streams and where their primary sector bets lie:
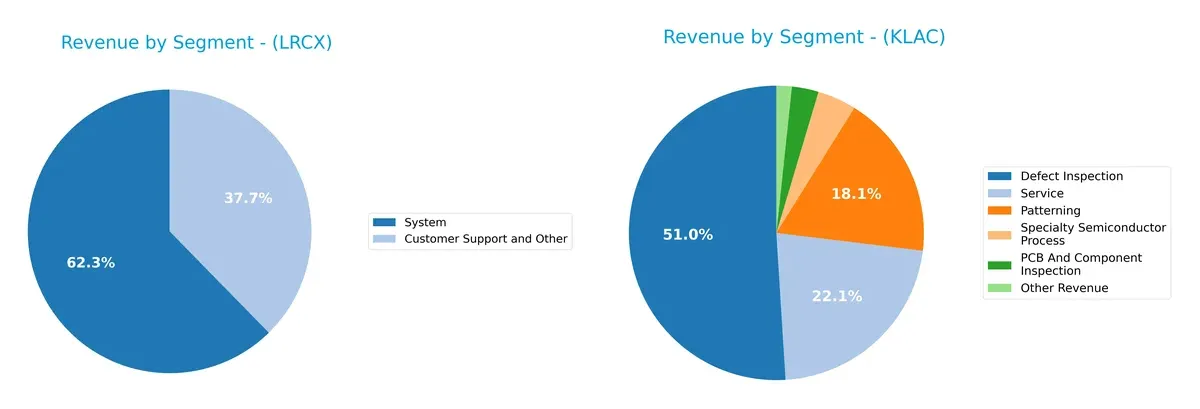
Lam Research anchors its revenue in two segments: Systems at $11.5B and Customer Support and Other at $6.9B, showing moderate diversification. KLA, however, dwarfs Lam with a more fragmented mix, led by Defect Inspection at $6.2B, Service at $2.7B, and Patterning at $2.2B. KLA’s diverse segmentation mitigates concentration risk, while Lam’s reliance on Systems signals a strategic bet on infrastructure dominance but exposes it to sector-specific cycles.
Strengths and Weaknesses Comparison
This table compares the strengths and weaknesses of Lam Research Corporation and KLA Corporation:
Lam Research Corporation Strengths
- Favorable net margin at 29.06%
- Strong ROE of 54.33% indicates efficient capital use
- Solid global presence across Asia-Pacific and US
- Diversified revenue streams in Systems and Customer Support
- High current and quick ratios reflect strong liquidity
- Low debt-to-assets ratio supports financial stability
KLA Corporation Strengths
- Higher net margin of 33.41% shows superior profitability
- Very strong ROE at 86.56% highlights excellent capital efficiency
- Broad product diversification including defect inspection and patterning
- Robust global footprint with significant revenues in Taiwan and China
- Favorable fixed asset turnover signals efficient use of assets
- Adequate liquidity with favorable current and quick ratios
Lam Research Corporation Weaknesses
- WACC of 12.05% exceeds cost of capital, a risk to value creation
- Unfavorable high price-to-book ratio at 12.69 may indicate overvaluation
- Dividend yield low at 0.92% may deter income investors
- Neutral asset turnover suggests moderate operational efficiency
- Limited product segmentation compared to KLAC
- Slightly lower market share in key regions like Taiwan
KLA Corporation Weaknesses
- Unfavorable high PE at 29.34 may suggest pricey valuation
- Debt-to-equity ratio of 1.3 signals higher leverage risk
- Debt-to-assets ratio at 37.89% less conservative than LRCX
- Dividend yield at 0.76% is low for income-focused investors
- Neutral asset turnover points to moderate asset utilization
- Higher proportion of revenue concentrated in defect inspection
Both companies exhibit strong profitability and liquidity profiles, with KLAC showing superior ROE and product diversification. Lam Research maintains a more conservative capital structure but faces valuation concerns. The differences imply distinct strategic approaches to growth and risk management within the semiconductor equipment sector.
The Moat Duel: Analyzing Competitive Defensibility
A structural moat alone shields long-term profits from relentless competitive erosion in capital-intensive tech sectors like semiconductors:
Lam Research Corporation: Precision Engineering and Process Innovation Moat
Lam’s moat stems from advanced process technology and specialized equipment, reflected in a strong 21.9% ROIC premium over WACC. Consistent margin expansion and product pipeline depth support durable value creation in 2026.
KLA Corporation: Yield Management and Inspection Dominance
KLA leverages sophisticated yield management systems, outperforming Lam with a 27.5% ROIC premium over WACC. Its expanding software and inspection technologies reinforce a widening moat and growth avenues in chip manufacturing controls.
Verdict: Process Innovation vs. Yield Control — Who Commands the Wider Moat?
KLA’s superior ROIC growth and higher capital efficiency signal a deeper moat than Lam’s. KLA stands better positioned to defend and expand market share amid intensifying semiconductor fabrication complexity.
Which stock offers better returns?
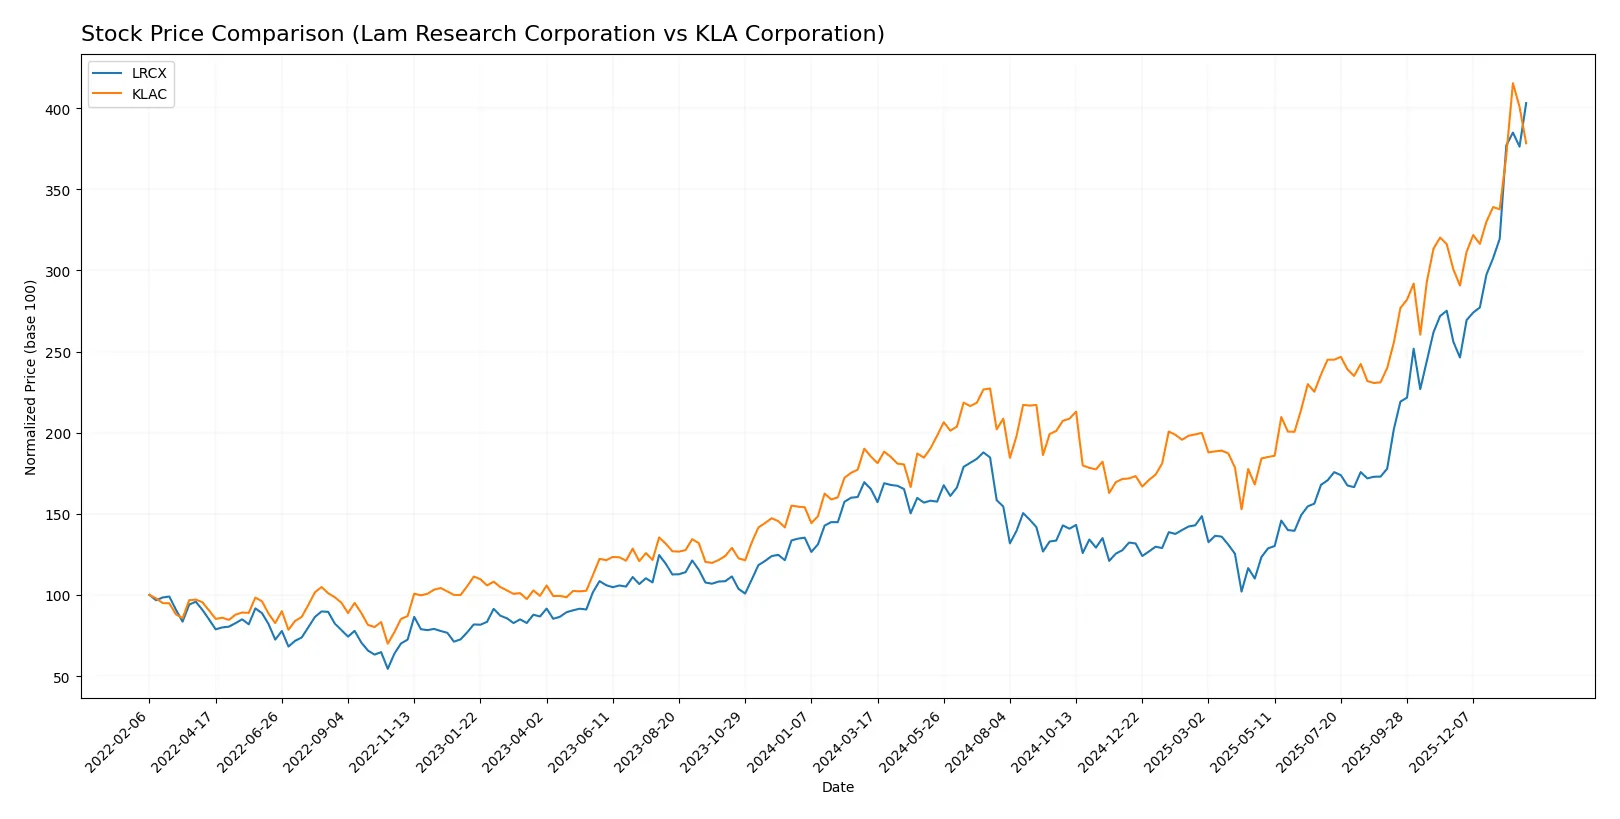
Over the past year, Lam Research Corporation and KLA Corporation both showed strong price appreciation, with Lam Research exhibiting higher growth and accelerating momentum.
Trend Comparison
Lam Research’s stock rose 144.03% over the past 12 months, demonstrating a bullish trend with acceleration and a notable high of 233.46. Volatility is moderate with a 36.82 standard deviation.
KLA’s stock gained 104.22% over the same period, also bullish with acceleration, hitting a high of 1567.82. Volatility is significantly higher, shown by a 213.25 standard deviation.
Lam Research outperformed KLA in total price appreciation, delivering the highest market performance over the analyzed year.
Target Prices
Analysts project strong upside potential for Lam Research and KLA Corporation. The consensus target prices indicate optimistic growth expectations.
| Company | Target Low | Target High | Consensus |
|---|---|---|---|
| Lam Research Corporation | 127 | 325 | 266.76 |
| KLA Corporation | 1400 | 1900 | 1672.25 |
The consensus targets for Lam Research and KLA stand well above their current prices, signaling analyst confidence despite recent volatility.

Don’t Let Luck Decide Your Entry Point
Optimize your entry points with our advanced ProRealTime indicators. You’ll get efficient buy signals with precise price targets for maximum performance. Start outperforming now!
How do institutions grade them?
Lam Research Corporation Grades
Here are the latest grades from reputable financial institutions for Lam Research Corporation:
| Grading Company | Action | New Grade | Date |
|---|---|---|---|
| UBS | Maintain | Buy | 2026-01-29 |
| Wells Fargo | Maintain | Overweight | 2026-01-29 |
| JP Morgan | Maintain | Overweight | 2026-01-29 |
| RBC Capital | Maintain | Outperform | 2026-01-29 |
| Citigroup | Maintain | Buy | 2026-01-29 |
| Stifel | Maintain | Buy | 2026-01-29 |
| Morgan Stanley | Maintain | Equal Weight | 2026-01-29 |
| Needham | Maintain | Buy | 2026-01-29 |
| Susquehanna | Maintain | Positive | 2026-01-29 |
| Goldman Sachs | Maintain | Buy | 2026-01-29 |
KLA Corporation Grades
Below are the current grades from major rating firms for KLA Corporation:
| Grading Company | Action | New Grade | Date |
|---|---|---|---|
| Oppenheimer | Maintain | Outperform | 2026-01-30 |
| Barclays | Maintain | Overweight | 2026-01-30 |
| Cantor Fitzgerald | Maintain | Overweight | 2026-01-30 |
| Jefferies | Maintain | Buy | 2026-01-30 |
| Stifel | Maintain | Buy | 2026-01-30 |
| Wells Fargo | Maintain | Overweight | 2026-01-30 |
| Needham | Maintain | Buy | 2026-01-30 |
| RBC Capital | Maintain | Sector Perform | 2026-01-30 |
| Deutsche Bank | Maintain | Hold | 2026-01-21 |
| Needham | Maintain | Buy | 2026-01-20 |
Which company has the best grades?
Lam Research Corporation holds a broader consensus of “Buy” and “Outperform” ratings compared to KLA Corporation, which features more mixed grades including “Hold” and “Sector Perform.” This suggests stronger institutional confidence in Lam Research, potentially influencing investor sentiment more positively.
Risks specific to each company
The following categories identify the critical pressure points and systemic threats facing both firms in the 2026 market environment:
1. Market & Competition
Lam Research Corporation (LRCX)
- Faces high competition in semiconductor equipment with strong innovation demands and cyclical demand swings.
KLA Corporation (KLAC)
- Competes in process control and yield management with growing pressure to differentiate in a niche market.
2. Capital Structure & Debt
Lam Research Corporation (LRCX)
- Maintains a moderate debt-to-equity ratio of 0.48, indicating conservative leverage and strong interest coverage.
KLA Corporation (KLAC)
- Carries higher leverage with a debt-to-equity ratio of 1.3, increasing financial risk despite adequate interest coverage.
3. Stock Volatility
Lam Research Corporation (LRCX)
- Exhibits higher beta at 1.78, implying greater sensitivity to market swings and elevated stock volatility.
KLA Corporation (KLAC)
- Lower beta of 1.44 suggests relatively less stock price volatility compared to Lam Research.
4. Regulatory & Legal
Lam Research Corporation (LRCX)
- Subject to stringent US and international export controls affecting semiconductor equipment sales.
KLA Corporation (KLAC)
- Faces regulatory scrutiny on process control technologies and intellectual property in global markets.
5. Supply Chain & Operations
Lam Research Corporation (LRCX)
- Global supply chain exposure to component shortages and geopolitical disruptions remains a key operational risk.
KLA Corporation (KLAC)
- Relies on complex supply chains for inspection and metrology equipment, vulnerable to component and logistics bottlenecks.
6. ESG & Climate Transition
Lam Research Corporation (LRCX)
- Increasing pressure to reduce energy intensity and emissions in manufacturing equipment design.
KLA Corporation (KLAC)
- ESG initiatives advancing but face challenges integrating sustainability into legacy product lines.
7. Geopolitical Exposure
Lam Research Corporation (LRCX)
- Significant exposure to US-China tensions impacting sales in Chinese semiconductor sector.
KLA Corporation (KLAC)
- Also exposed to geopolitical risks in Asia, with reliance on cross-border supply and customer relationships.
Which company shows a better risk-adjusted profile?
Lam Research faces its most impactful risk from market volatility amplified by a higher beta and geopolitical tensions affecting demand. KLA’s greatest concern lies in its elevated leverage ratio, which raises financial risk amid market uncertainties. Overall, Lam Research presents a stronger risk-adjusted profile due to its conservative capital structure and superior liquidity, despite greater stock volatility. The recent sharp stock price drop of 5.9% for Lam Research contrasts with KLA’s 15.2% decline, underscoring volatility risk but also highlighting KLA’s heavier financial leverage as a red flag.
Final Verdict: Which stock to choose?
Lam Research’s superpower lies in its consistent value creation and efficient capital use. Its steadily growing ROIC well above WACC signals a durable competitive edge. A point of vigilance is its relatively high price-to-book ratio, which may temper appeal for value-focused investors. It suits portfolios seeking aggressive growth with a solid innovation backbone.
KLA’s strategic moat is its commanding profitability and superior return on equity, reflecting strong operational leverage and market position. Compared to Lam, KLA carries more debt, introducing higher financial risk. However, its robust margins and rapid earnings growth make it a fit for investors favoring Growth at a Reasonable Price (GARP) profiles who accept moderate risk for steady upside.
If you prioritize capital efficiency and sustainable innovation, Lam Research outshines with a more balanced risk-return profile. However, if you seek superior margin expansion and can tolerate higher leverage, KLA offers better growth momentum but demands careful risk management. Each represents a distinct analytical scenario aligned with different investor appetites.
Disclaimer: Investment carries a risk of loss of initial capital. The past performance is not a reliable indicator of future results. Be sure to understand risks before making an investment decision.
Go Further
I encourage you to read the complete analyses of Lam Research Corporation and KLA Corporation to enhance your investment decisions: