Home > Comparison > Industrials > TDG vs LHX
The strategic rivalry between TransDigm Group Incorporated and L3Harris Technologies defines the current trajectory of the aerospace & defense sector. TransDigm operates as a specialized aircraft components manufacturer with a capital-intensive model. In contrast, L3Harris delivers integrated mission systems and advanced defense technology, leveraging a broader, technology-driven approach. This analysis evaluates which corporate strategy offers superior risk-adjusted returns for diversified portfolios amid evolving industry dynamics.
Table of contents
Companies Overview
TransDigm Group and L3Harris Technologies lead the aerospace and defense sector with distinct market footprints and advanced technologies.
TransDigm Group Incorporated: Specialist in Aircraft Components
TransDigm commands a strong market position in aerospace components, generating revenue primarily through the design and supply of mechanical, electromechanical, and specialized aircraft parts. In 2026, it sharpened its focus on expanding its Power & Control and Airframe segments, catering to airlines, military agencies, and maintenance suppliers worldwide. Its niche product portfolio underpins robust pricing power and aftermarket revenue streams.
L3Harris Technologies, Inc.: Integrated Defense Solutions Provider
L3Harris dominates with mission-critical aerospace and defense technologies, earning revenue from ISR systems, communication, avionics, and space payloads. The company’s strategic emphasis in 2026 targeted advanced electronic warfare, tactical communications, and autonomous maritime platforms for government and commercial clients. This broad-based technology integration sustains its competitive edge across multiple defense domains.
Strategic Collision: Similarities & Divergences
Both companies excel in aerospace and defense but diverge sharply in business philosophy. TransDigm relies on a focused product specialization and aftermarket dominance, whereas L3Harris pursues an open infrastructure approach with diversified mission systems. Their primary battleground lies in government and military contracts, especially in avionics and electronics. Investment profiles differ: TransDigm offers concentrated exposure to durable components; L3Harris provides diversified technology-driven defense solutions.
Income Statement Comparison
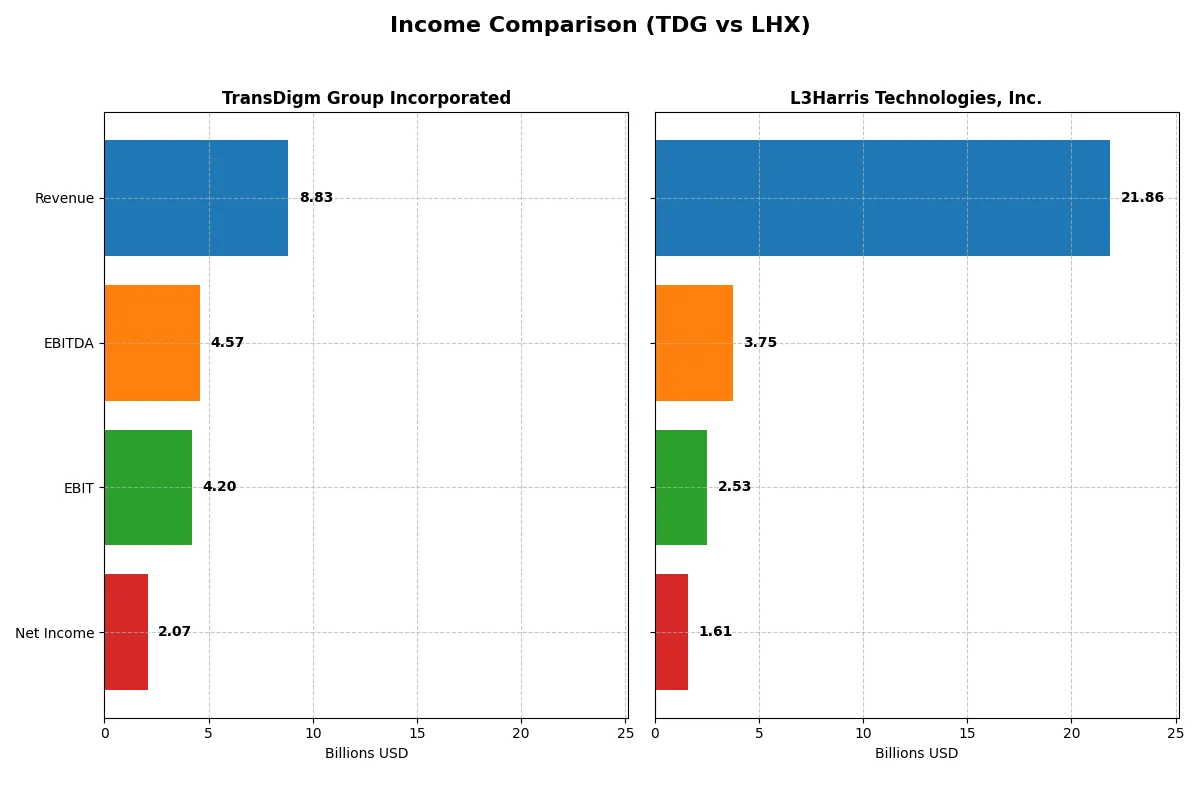
This data dissects the core profitability and scalability of both corporate engines to reveal who dominates the bottom line:
| Metric | TransDigm Group Incorporated (TDG) | L3Harris Technologies, Inc. (LHX) |
|---|---|---|
| Revenue | 8.83B | 21.87B |
| Cost of Revenue | 3.52B | 16.24B |
| Operating Expenses | 1.15B | 3.43B |
| Gross Profit | 5.31B | 5.63B |
| EBITDA | 4.57B | 3.75B |
| EBIT | 4.20B | 2.53B |
| Interest Expense | 1.57B | 597M |
| Net Income | 2.07B | 1.61B |
| EPS | 32.08 | 8.57 |
| Fiscal Year | 2025 | 2025 |
Income Statement Analysis: The Bottom-Line Duel
This income statement comparison exposes which corporate engine delivers superior efficiency and profitability through revenue and margin dynamics.
TransDigm Group Incorporated Analysis
TransDigm’s revenue climbed sharply from 4.8B in 2021 to 8.8B in 2025, with net income surging over 2B in 2025. The company sustains robust gross margins above 60% and net margins near 23.5%, reflecting exceptional cost control despite elevated interest expenses. Its 2025 performance highlights accelerating profitability and operational leverage.
L3Harris Technologies, Inc. Analysis
L3Harris’s revenue grew moderately from 17.8B in 2021 to 21.9B in 2025, but net income declined to 1.6B in 2025. Gross margins hold around 25.7%, and net margins remain tight near 7.4%, pressured by sizable operating expenses. While EBIT improved in 2025, the company’s overall margin erosion signals challenges in converting scale into bottom-line gains.
Margin Dominance vs. Scale Advantage
TransDigm decisively outperforms L3Harris on margin strength and profit growth despite smaller scale. Its 23.5% net margin dwarfs L3Harris’s 7.4%, with consistent double-digit revenue and earnings expansion. Investors valuing margin resilience and earnings momentum will find TransDigm’s profile considerably more attractive than L3Harris’s slower growth and margin pressures.
Financial Ratios Comparison
These vital ratios act as a diagnostic tool to expose the underlying fiscal health, valuation premiums, and capital efficiency of the companies compared below:
| Ratios | TransDigm Group Incorporated (TDG) | L3Harris Technologies, Inc. (LHX) |
|---|---|---|
| ROE | -21.4% | 8.2% |
| ROIC | 15.2% | 5.4% |
| P/E | 37.0 | 34.3 |
| P/B | -7.9 | 2.8 |
| Current Ratio | 3.21 | 1.19 |
| Quick Ratio | 2.25 | 1.02 |
| D/E (Debt-to-Equity) | -3.10 | 0.53 |
| Debt-to-Assets | 131.1% | 25.4% |
| Interest Coverage | 2.65 | 3.68 |
| Asset Turnover | 0.39 | 0.53 |
| Fixed Asset Turnover | 5.59 | 8.20 |
| Payout Ratio | 4.64% | 56.2% |
| Dividend Yield | 0.13% | 1.64% |
| Fiscal Year | 2025 | 2025 |
Efficiency & Valuation Duel: The Vital Signs
Financial ratios serve as a company’s DNA, uncovering hidden risks and operational excellence critical for sound investment decisions.
TransDigm Group Incorporated
TransDigm’s profitability shines with a strong 23.5% net margin and a robust 15.2% ROIC, outpacing its 7.0% WACC, signaling value creation. However, a high P/E of 37 suggests the stock is expensive. Despite a negative ROE and elevated debt ratios, a 12.6% dividend yield offers shareholders steady returns amid reinvestment challenges.
L3Harris Technologies, Inc.
L3Harris reports a modest 7.4% net margin and 5.4% ROIC, both neutral, with a WACC of 6.6%, indicating balanced capital efficiency. The P/E of 34 reflects a stretched valuation but less so than TransDigm. Lower debt and a 1.6% dividend yield point to more conservative financial leverage and moderate shareholder payouts.
Premium Valuation vs. Operational Safety
TransDigm commands a premium valuation driven by strong margins and cash returns but carries higher financial risk. L3Harris trades at a lower valuation with steadier leverage and returns. Investors prioritizing operational efficiency may lean toward TransDigm; those valuing financial stability may prefer L3Harris.
Which one offers the Superior Shareholder Reward?
I observe that TransDigm Group Incorporated (TDG) delivers a compelling shareholder reward through a high dividend yield of 12.55% in 2025, backed by a low payout ratio of 4.64%, indicating strong free cash flow coverage. TDG also executes intense buybacks, amplifying total returns. L3Harris Technologies, Inc. (LHX) offers a modest 1.64% dividend yield with a 56.2% payout ratio, signaling less free cash flow flexibility. Its buyback program is more restrained. Historically in aerospace, TDG’s distribution strategy—combining generous dividends with robust buybacks—is more sustainable and aligns with capital allocation excellence. I conclude TDG offers the more attractive total return profile for 2026 investors.
Comparative Score Analysis: The Strategic Profile
The radar chart reveals the fundamental DNA and trade-offs of TransDigm Group and L3Harris Technologies, Inc., highlighting their financial strengths and vulnerabilities:
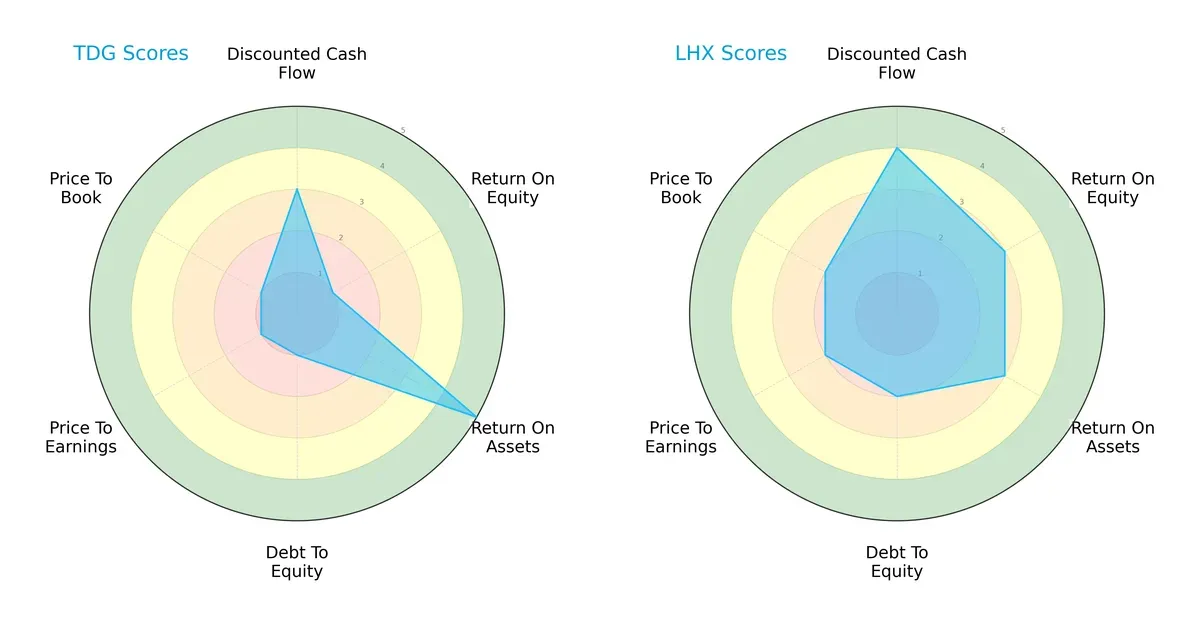
L3Harris holds a more balanced profile, scoring moderately to favorably across DCF (4), ROE (3), ROA (3), Debt/Equity (2), and valuation multiples (PE/PB at 2). TransDigm shows extremes: strong asset efficiency (ROA 5) but weak equity returns (ROE 1) and high leverage risk (Debt/Equity 1). Its valuation scores (PE/PB 1) suggest overvaluation concerns. L3Harris’s steadier scores indicate diversified strengths, while TransDigm relies heavily on asset utilization amid financial leverage risks.
Bankruptcy Risk: Solvency Showdown
The Altman Z-Scores place both firms in the grey zone, signaling moderate bankruptcy risk for long-term survival in today’s cycle:
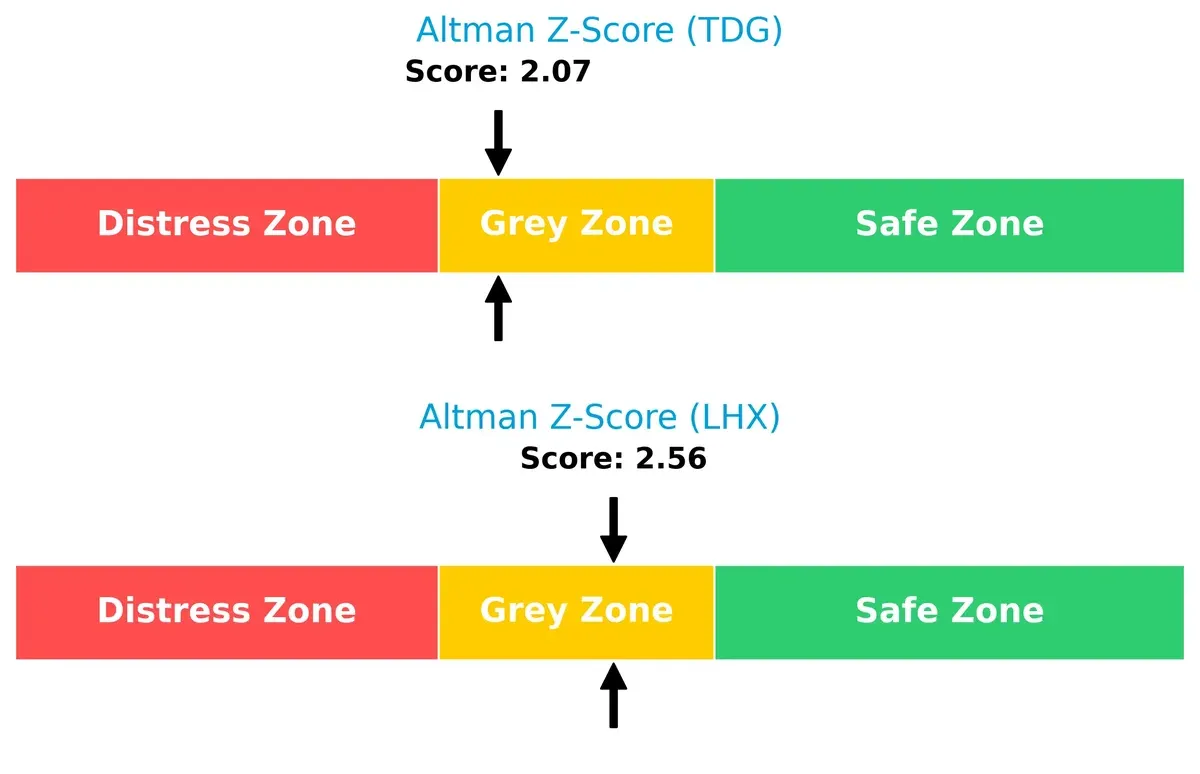
L3Harris’s Z-Score of 2.56 edges out TransDigm’s 2.07, indicating a marginally stronger solvency position. Neither company is in the safe zone, so I advise caution, especially given sector volatility and capital intensity.
Financial Health: Quality of Operations
L3Harris’s Piotroski F-Score of 9 signals peak financial health, while TransDigm’s 6 suggests average operational quality with some red flags:
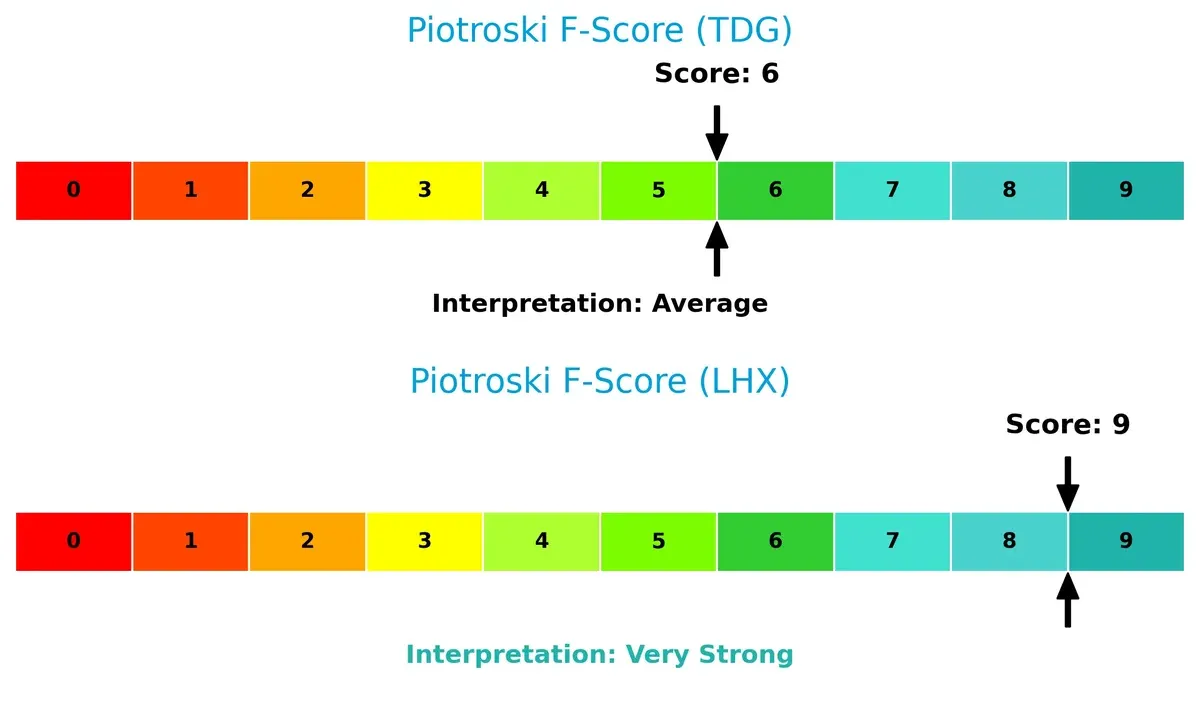
L3Harris demonstrates superior internal metrics across profitability, leverage, and liquidity. TransDigm’s lower score highlights potential weaknesses in operational efficiency or financial stability, which investors should monitor closely.
How are the two companies positioned?
This section dissects TDG and LHX’s operational DNA by comparing revenue distribution and internal dynamics—strengths and weaknesses. The goal is to confront their economic moats to identify which model offers the most resilient, sustainable competitive advantage today.
Revenue Segmentation: The Strategic Mix
The following visual comparison dissects how TransDigm Group and L3Harris Technologies diversify their income streams and highlights their primary sector bets:
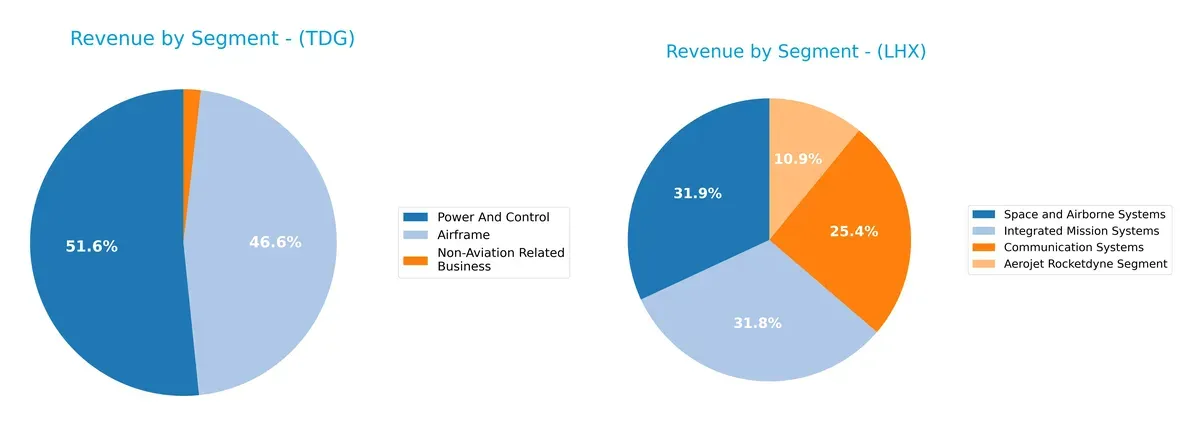
TransDigm anchors revenue in two main segments: Power And Control at $4.56B and Airframe at $4.11B, showing moderate diversification with a small non-aviation business at $160M. In contrast, L3Harris pivots around three large segments—Space and Airborne Systems ($6.87B), Integrated Mission Systems ($6.84B), and Communication Systems ($5.46B)—demonstrating a broader diversification that reduces concentration risk and supports ecosystem lock-in across advanced defense technologies.
Strengths and Weaknesses Comparison
This table compares the Strengths and Weaknesses of TransDigm Group Incorporated (TDG) and L3Harris Technologies, Inc. (LHX):
TDG Strengths
- High net margin of 23.49%
- ROIC of 15.22% exceeds WACC of 7.04%
- Strong quick ratio at 2.25
- High fixed asset turnover at 5.59
- Diverse revenue streams across Airframe and Power & Control
- Significant US and Non-US sales with 5.54B and 3.30B respectively
LHX Strengths
- Favorable WACC at 6.6%
- Favorable fixed asset turnover of 8.2
- Favorable quick ratio at 1.02
- Moderate debt-to-assets ratio at 25.35%
- Balanced revenue segmentation across Communication and Integrated Mission Systems
- Global presence implied through diversified business units
TDG Weaknesses
- Negative ROE at -21.41% signals shareholder returns concern
- High debt-to-assets at 131.08% is a financial risk
- Unfavorable current ratio at 3.21 hints at liquidity issues
- Unfavorable P/E of 36.99 could imply overvaluation
- Low asset turnover at 0.39 may signal inefficient asset use
LHX Weaknesses
- Neutral to low profitability with 7.35% net margin
- ROE at 8.18% below ideal levels
- Neutral asset turnover at 0.53 suggests moderate efficiency
- Unfavorable P/E of 34.26
- Neutral current ratio of 1.19 indicates tight liquidity
Overall, TDG demonstrates strong profitability and asset utilization but carries significant leverage and shareholder return risks. LHX shows moderate financial health with balanced operational efficiency but faces challenges in profitability and valuation metrics. Both companies exhibit slightly favorable financial profiles, implying cautious strategic navigation in their respective markets.
The Moat Duel: Analyzing Competitive Defensibility
A structural moat is the only true defense against competition eroding long-term profits and shareholder value. Consider these two aerospace giants:
TransDigm Group Incorporated: Intangible Assets Powerhouse
I see TransDigm’s moat in its proprietary aircraft components and specialized products. This drives a high ROIC of 8.18% above WACC and margin stability near 47.6% EBIT. New product innovations and expanding international sales should deepen this moat in 2026.
L3Harris Technologies, Inc.: Diversified Technology with Margin Pressure
L3Harris relies on mission-critical technology and government contracts, but its ROIC trails WACC by -1.23%, signaling value erosion. Compared to TransDigm, L3Harris faces margin compression and declining profitability. Future growth hinges on integrating new ISR and cyber defense solutions to reverse this trend.
Margin Resilience vs. Technology Diversification: Moat Strength Showdown
TransDigm holds a deeper, more durable moat, evidenced by strong ROIC growth and robust margins. L3Harris’s declining returns and weaker capital efficiency leave it vulnerable. TransDigm is clearly better positioned to defend and expand its market share through 2026.
Which stock offers better returns?
The past 12 months reveal distinct bullish trends for both stocks, with L3Harris Technologies surging strongly and TransDigm Group showing steady acceleration in price gains.
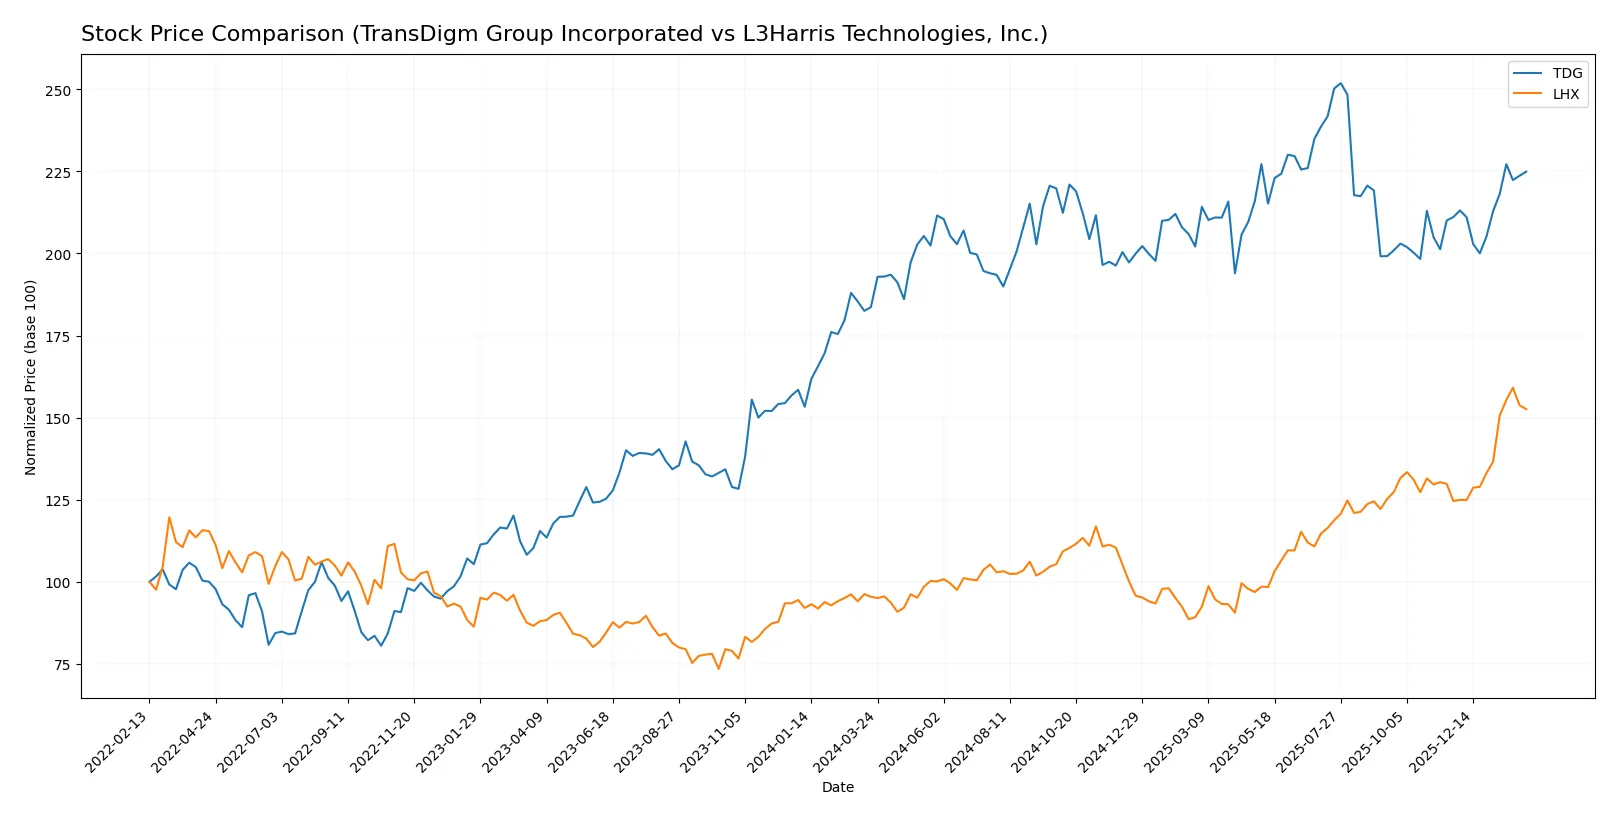
Trend Comparison
TransDigm Group’s stock rose 22.46% over the past year, marking an accelerating bullish trend from a low of 1172.2 to a high near 1607.4. Volatility is high with an 86.11 standard deviation.
L3Harris Technologies posted a 59.84% gain over the same period. The bullish trend accelerates with less volatility at a 36.17 standard deviation, climbing from 197.6 to 354.7.
L3Harris outperformed TransDigm by a wide margin, delivering the highest market returns and a steadier upward momentum in the last year.
Target Prices
Analysts present a solid consensus on target prices for TransDigm Group and L3Harris Technologies, reflecting optimistic outlooks.
| Company | Target Low | Target High | Consensus |
|---|---|---|---|
| TransDigm Group Incorporated | 1,370 | 1,871 | 1,601.5 |
| L3Harris Technologies, Inc. | 323 | 367 | 352.25 |
The target consensus for TransDigm exceeds its current price by about 12%, signaling growth expectations. L3Harris’s target consensus also suggests upside potential, approximately 3.5% above its current trading level.

Don’t Let Luck Decide Your Entry Point
Optimize your entry points with our advanced ProRealTime indicators. You’ll get efficient buy signals with precise price targets for maximum performance. Start outperforming now!
How do institutions grade them?
TransDigm Group Incorporated Grades
Here are the recent grades issued by major institutions for TransDigm Group Incorporated:
| Grading Company | Action | New Grade | Date |
|---|---|---|---|
| UBS | Maintain | Buy | 2026-01-15 |
| JP Morgan | Maintain | Neutral | 2025-11-14 |
| Morgan Stanley | Maintain | Overweight | 2025-11-14 |
| BMO Capital | Maintain | Outperform | 2025-11-13 |
| UBS | Maintain | Buy | 2025-11-13 |
| RBC Capital | Maintain | Sector Perform | 2025-11-13 |
| Stifel | Maintain | Buy | 2025-11-13 |
| Morgan Stanley | Maintain | Overweight | 2025-10-15 |
| Truist Securities | Maintain | Buy | 2025-10-15 |
| Susquehanna | Maintain | Neutral | 2025-10-09 |
L3Harris Technologies, Inc. Grades
Below are the latest institutional grades for L3Harris Technologies, Inc.:
| Grading Company | Action | New Grade | Date |
|---|---|---|---|
| Morgan Stanley | Maintain | Overweight | 2026-02-02 |
| RBC Capital | Maintain | Sector Perform | 2026-01-30 |
| UBS | Maintain | Neutral | 2026-01-15 |
| RBC Capital | Maintain | Sector Perform | 2026-01-14 |
| Citigroup | Maintain | Buy | 2026-01-13 |
| Morgan Stanley | Upgrade | Overweight | 2025-12-16 |
| JP Morgan | Maintain | Overweight | 2025-11-04 |
| UBS | Maintain | Neutral | 2025-10-31 |
| Truist Securities | Maintain | Buy | 2025-10-15 |
| Morgan Stanley | Maintain | Equal Weight | 2025-10-15 |
Which company has the best grades?
TransDigm Group holds a stronger consensus of Buy and Outperform ratings, indicating a more favorable institutional outlook. L3Harris shows mixed grades, with more Neutral and Sector Perform ratings. This divergence may influence investor sentiment and portfolio positioning.
Risks specific to each company
The following categories identify critical pressure points and systemic threats facing both firms in the 2026 aerospace and defense market environment:
1. Market & Competition
TransDigm Group Incorporated (TDG)
- Faces pressure from high P/E ratio and asset turnover inefficiency, indicating valuation concerns and operational challenges.
L3Harris Technologies, Inc. (LHX)
- Operates with moderate net margin and asset turnover, but lower beta suggests less market risk exposure.
2. Capital Structure & Debt
TransDigm Group Incorporated (TDG)
- Exhibits unfavorable high debt-to-assets ratio (131%), signaling elevated financial leverage risk.
L3Harris Technologies, Inc. (LHX)
- Maintains a conservative debt profile with 25% debt-to-assets, reflecting prudent capital structure management.
3. Stock Volatility
TransDigm Group Incorporated (TDG)
- Beta of 0.895 implies moderate volatility, slightly below market average, offering some stability.
L3Harris Technologies, Inc. (LHX)
- Lower beta at 0.64 indicates reduced stock price volatility, appealing to risk-sensitive investors.
4. Regulatory & Legal
TransDigm Group Incorporated (TDG)
- Operates in a highly regulated aerospace components segment; exposure to government contract compliance risks.
L3Harris Technologies, Inc. (LHX)
- Faces complex regulatory environments due to classified defense contracts and cyber defense solutions.
5. Supply Chain & Operations
TransDigm Group Incorporated (TDG)
- Supply chain complexity with mechanical and electro-mechanical parts could expose it to disruptions.
L3Harris Technologies, Inc. (LHX)
- Diverse product lines including ISR and communication systems may benefit from operational synergies but add complexity.
6. ESG & Climate Transition
TransDigm Group Incorporated (TDG)
- Limited public ESG data heightens risks amid increasing investor and regulatory climate scrutiny.
L3Harris Technologies, Inc. (LHX)
- Greater focus on advanced technologies may align better with climate transition but faces scrutiny on defense sector impacts.
7. Geopolitical Exposure
TransDigm Group Incorporated (TDG)
- International sales expose TDG to trade tensions and export control risks.
L3Harris Technologies, Inc. (LHX)
- Extensive government contracts and global defense ties increase geopolitical risk but offer stable revenue streams.
Which company shows a better risk-adjusted profile?
L3Harris Technologies presents a better risk-adjusted profile. TDG’s excessive leverage and valuation concerns constitute its most impactful risks. In contrast, LHX’s moderate leverage, stronger Piotroski score (9 vs. 6), and lower stock volatility provide a more balanced risk-return tradeoff. Notably, TDG’s 131% debt-to-assets ratio flags significant financial risk, demanding cautious investor scrutiny.
Final Verdict: Which stock to choose?
TransDigm Group Incorporated’s superpower lies in its durable competitive advantage, demonstrated by a robust and growing ROIC well above its cost of capital. It operates as a highly efficient cash generator with impressive margins. However, its elevated debt levels remain a point of vigilance. TDG suits investors targeting aggressive growth with tolerance for leverage risks.
L3Harris Technologies, Inc. benefits from a stable strategic moat rooted in diversified defense contracts and recurring revenue streams. It offers a safer balance sheet and stronger financial health metrics than TDG, appealing to those valuing resilience. LHX fits portfolios focused on growth at a reasonable price and capital preservation.
If you prioritize return on invested capital and long-term value creation, TransDigm outshines with its operational efficiency and margin expansion. However, if you seek better financial stability and a defensive growth profile, L3Harris offers superior risk management and steadier income streams. Both present viable analytical scenarios depending on your risk appetite and investment horizon.
Disclaimer: Investment carries a risk of loss of initial capital. The past performance is not a reliable indicator of future results. Be sure to understand risks before making an investment decision.
Go Further
I encourage you to read the complete analyses of TransDigm Group Incorporated and L3Harris Technologies, Inc. to enhance your investment decisions: