Home > Comparison > Industrials > BA vs LHX
The strategic rivalry between The Boeing Company and L3Harris Technologies defines the current trajectory of the aerospace and defense sector. Boeing operates as a capital-intensive industrial giant with diversified segments in commercial airplanes and defense systems. In contrast, L3Harris excels as a technology-driven mission-critical solutions provider focused on advanced electronics and communications. This analysis will assess which corporate model offers the superior risk-adjusted return for a diversified portfolio in this complex industry.

Table of contents
Companies Overview
The Boeing Company and L3Harris Technologies, Inc. shape the aerospace and defense landscape with distinct scale and specialties.
The Boeing Company: Aerospace Giant with Diverse Segments
The Boeing Company dominates as a leading aerospace and defense manufacturer. It generates revenue from commercial jetliners, military aircraft, satellites, and space exploration. In 2026, Boeing emphasizes integrated services, including fleet support and digital analytics, to strengthen its extensive global footprint and capitalize on after-sales revenue streams.
L3Harris Technologies, Inc.: Mission-Critical Defense Innovator
L3Harris Technologies focuses on advanced aerospace and defense technology solutions. It earns primarily from integrated mission systems, space and airborne systems, and tactical communications. The company prioritizes innovation in intelligence, surveillance, reconnaissance (ISR), and secure communications to enhance battlefield connectivity and cyber defense capabilities.
Strategic Collision: Similarities & Divergences
Both companies compete in aerospace and defense but differ philosophically. Boeing pursues a broad product and service ecosystem, while L3Harris targets specialized, high-tech mission solutions. Their battle centers on defense contracts and technology leadership. Boeing’s scale contrasts with L3Harris’s focused innovation, creating distinct investment profiles driven by size versus niche expertise.
Income Statement Comparison
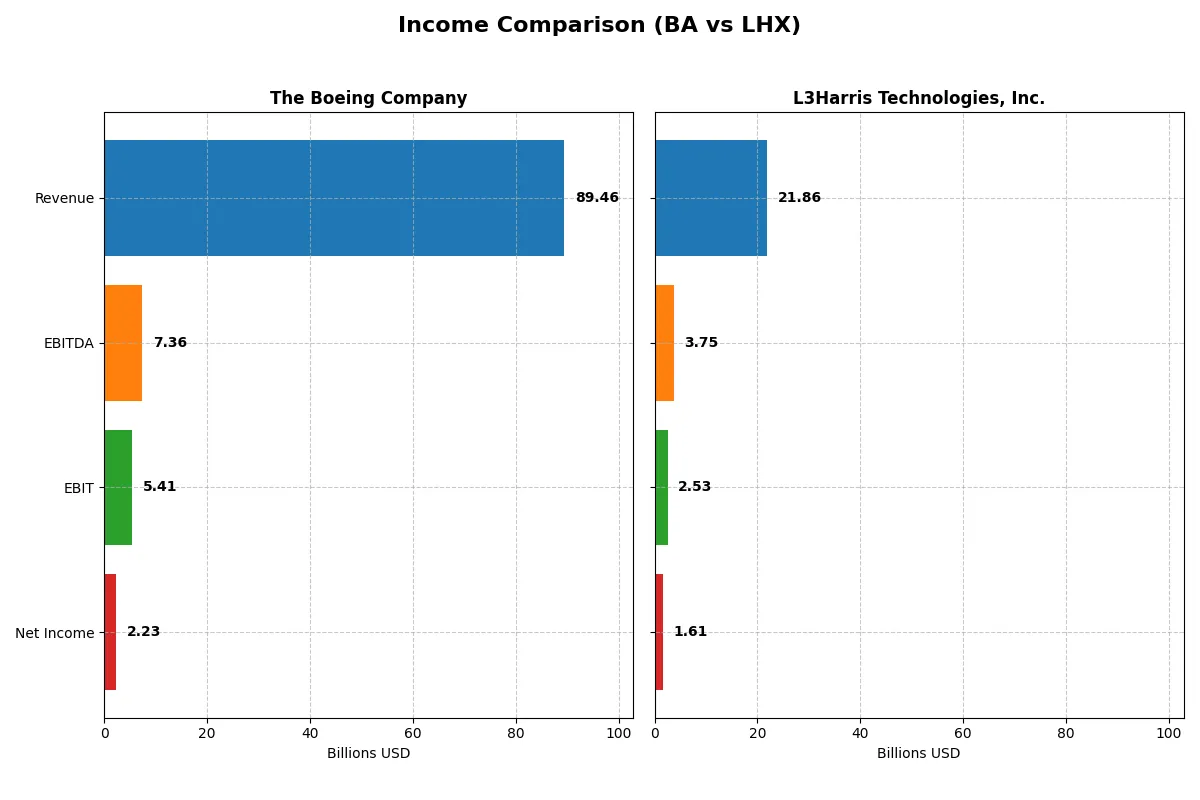
The following data dissects the core profitability and scalability of both corporate engines to reveal who dominates the bottom line:
| Metric | The Boeing Company (BA) | L3Harris Technologies, Inc. (LHX) |
|---|---|---|
| Revenue | 89.5B | 21.9B |
| Cost of Revenue | 85.2B | 16.2B |
| Operating Expenses | 9.7B | 3.4B |
| Gross Profit | 4.3B | 5.6B |
| EBITDA | 7.4B | 3.8B |
| EBIT | 5.4B | 2.5B |
| Interest Expense | 2.8B | 0.6B |
| Net Income | 2.2B | 1.6B |
| EPS | 2.49 | 8.57 |
| Fiscal Year | 2025 | 2025 |
Income Statement Analysis: The Bottom-Line Duel
This income statement comparison reveals which company runs a more efficient and profitable business engine based on recent financial performance.
The Boeing Company Analysis
Boeing’s revenue surged sharply to $89.5B in 2025, rebounding from prior years of losses. Net income turned positive at $2.2B, reflecting a strong recovery. Margins improved significantly, with a gross margin of 4.8% and net margin of 2.5%, signaling operational momentum and enhanced cost control in the latest fiscal year.
L3Harris Technologies, Inc. Analysis
L3Harris sustained steady revenue growth, reaching $21.9B in 2025, although growth slowed to 2.5% year-over-year. The company maintains robust margins, with a gross margin of 25.7% and net margin of 7.4%, demonstrating consistent profitability and operational efficiency. Net income hit $1.6B, supported by disciplined expense management.
Margin Power vs. Recovery Momentum
Boeing exhibits a remarkable turnaround in revenue and net income after years of losses, driven by margin expansion and improving operational metrics. L3Harris offers superior margin strength and steady profits but slower revenue growth. For investors, Boeing’s recovery profile offers high upside potential, while L3Harris embodies stable, margin-rich earnings.
Financial Ratios Comparison
These vital ratios act as a diagnostic tool to expose the underlying fiscal health, valuation premiums, and capital efficiency of the companies analyzed:
| Ratios | The Boeing Company (BA) | L3Harris Technologies, Inc. (LHX) |
|---|---|---|
| ROE | 41.0% | 8.2% |
| ROIC | -6.7% | 5.4% |
| P/E | 74.1 | 34.3 |
| P/B | 30.3 | 2.80 |
| Current Ratio | 1.27 | 1.19 |
| Quick Ratio | 0.49 | 1.02 |
| D/E (Debt-to-Equity) | 9.92 | 0.53 |
| Debt-to-Assets | 32.2% | 25.4% |
| Interest Coverage | -1.95 | 3.68 |
| Asset Turnover | 0.53 | 0.53 |
| Fixed Asset Turnover | 5.73 | 8.20 |
| Payout ratio | 14.8% | 56.2% |
| Dividend yield | 0.20% | 1.64% |
| Fiscal Year | 2025 | 2025 |
Efficiency & Valuation Duel: The Vital Signs
Financial ratios serve as a company’s DNA, exposing hidden risks and signaling operational efficiency to investors.
The Boeing Company
Boeing’s ROE soars at 41%, signaling strong equity profitability, yet its net margin of 2.5% and negative ROIC reveal operational challenges. The stock trades expensive at a P/E of 74 and a P/B of 30, reflecting stretched valuation. Boeing offers a modest 0.2% dividend yield, indicating limited shareholder returns amid reinvestment efforts.
L3Harris Technologies, Inc.
L3Harris posts a moderate 8.2% ROE with a healthier 7.35% net margin, underscoring stable profitability. Its P/E ratio of 34 appears elevated but less stretched than Boeing’s. The company maintains a balanced capital structure with a 1.64% dividend yield and reinvests efficiently, supported by a favorable WACC and sound liquidity ratios.
Valuation Stretch vs. Operational Stability
Boeing’s high ROE contrasts with weak operational returns and a richly stretched valuation, raising risk concerns. L3Harris delivers steadier margins and a more reasonable valuation, offering a better risk-reward balance. Investors prioritizing stability may find L3Harris’s profile more fitting, while those chasing high equity returns face greater uncertainty with Boeing.
Which one offers the Superior Shareholder Reward?
I see L3Harris Technologies, Inc. (LHX) delivers a superior shareholder reward compared to The Boeing Company (BA). LHX pays a healthy 1.64% dividend yield with a sustainable 56% payout ratio, backed by strong free cash flow of 14.3/share in 2025. It also maintains robust buybacks, enhancing total returns. Conversely, BA offers a meager 0.2% yield with a low payout ratio of 15%, but suffers from negative free cash flow (-2.5/share) and heavy leverage, which threatens dividend sustainability. BA’s buyback programs appear limited by cash constraints. Historically, in aerospace, consistent free cash flow and balanced capital allocation drive lasting shareholder value. I conclude LHX’s dividend and buyback strategy offers a more attractive and sustainable total return profile for 2026 investors.
Comparative Score Analysis: The Strategic Profile
The radar chart reveals the fundamental DNA and trade-offs of The Boeing Company and L3Harris Technologies, Inc., highlighting their core financial strengths and weaknesses:
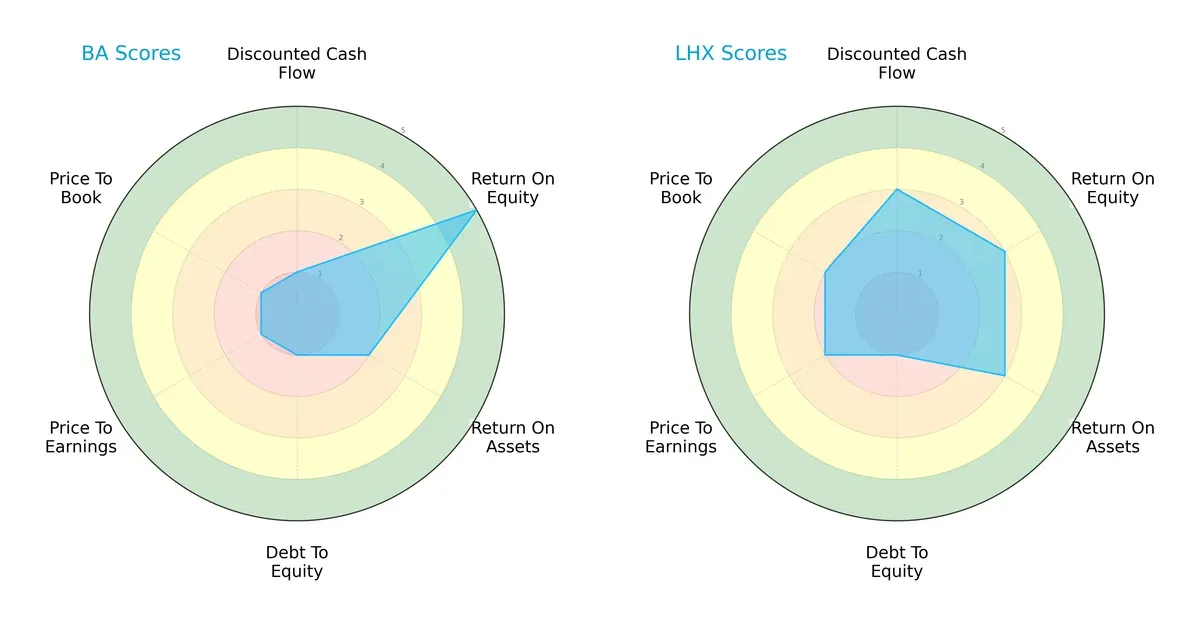
Boeing shows a high return on equity (5) but suffers from very weak discounted cash flow (1) and valuation scores (PE and PB at 1). L3Harris displays a more balanced profile with moderate scores across DCF (3), ROE (3), and valuation metrics (PE 2, PB 2). Both struggle with debt management (score 1), but L3Harris’s diversified strengths suggest a steadier overall financial footing.
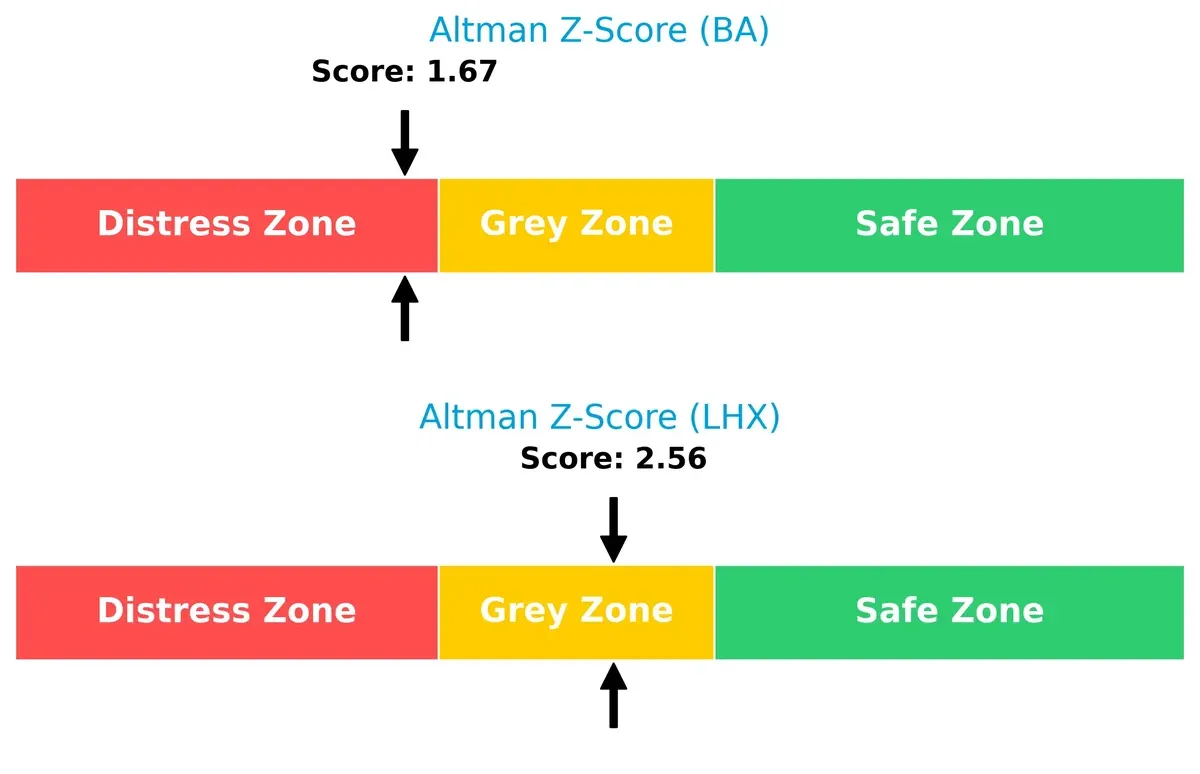
Bankruptcy Risk: Solvency Showdown
The Altman Z-Score gap indicates L3Harris sits in the grey zone (2.56), signaling moderate bankruptcy risk, while Boeing’s distress zone score (1.67) warns of significant financial vulnerability in this cycle:
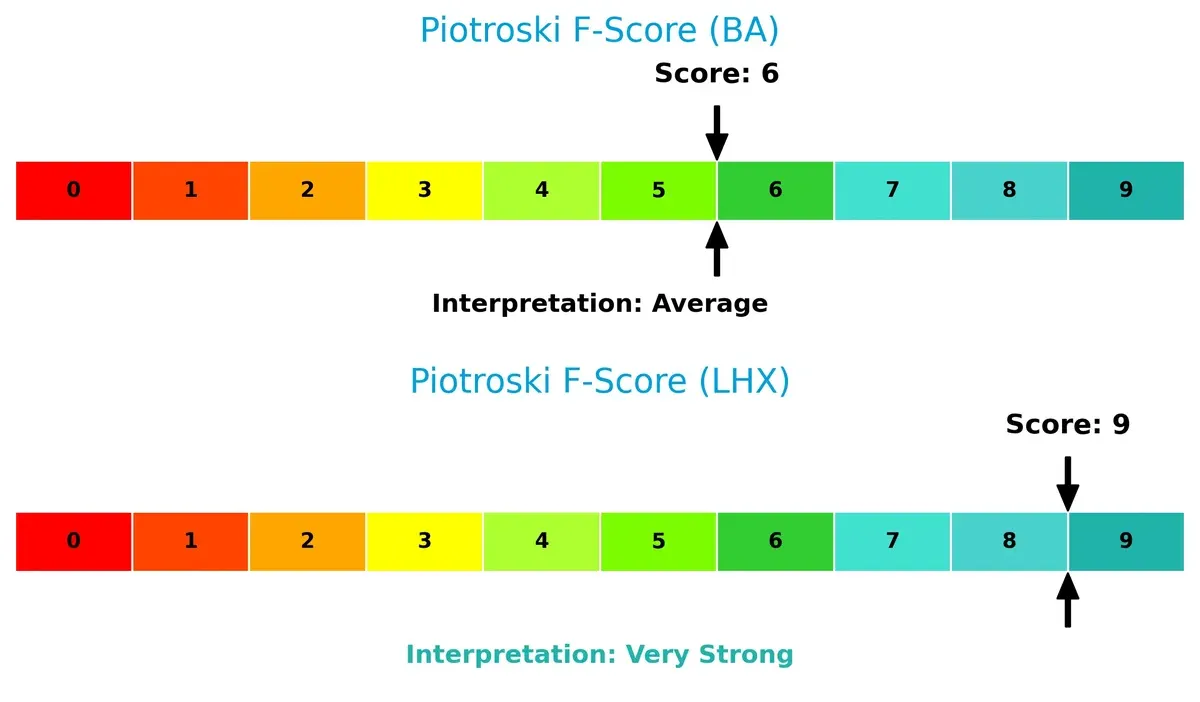
Financial Health: Quality of Operations
L3Harris scores a robust 9 on the Piotroski F-Score, signaling very strong operational health. Boeing’s 6 indicates average financial quality with potential internal weaknesses:
How are the two companies positioned?
This section dissects the operational DNA of Boeing and L3Harris by comparing their revenue distribution and internal strengths and weaknesses. The goal is to confront their economic moats to reveal which business model sustains the most resilient competitive advantage today.
Revenue Segmentation: The Strategic Mix
The following visual comparison dissects how The Boeing Company and L3Harris Technologies diversify their income streams and where their primary sector bets lie:
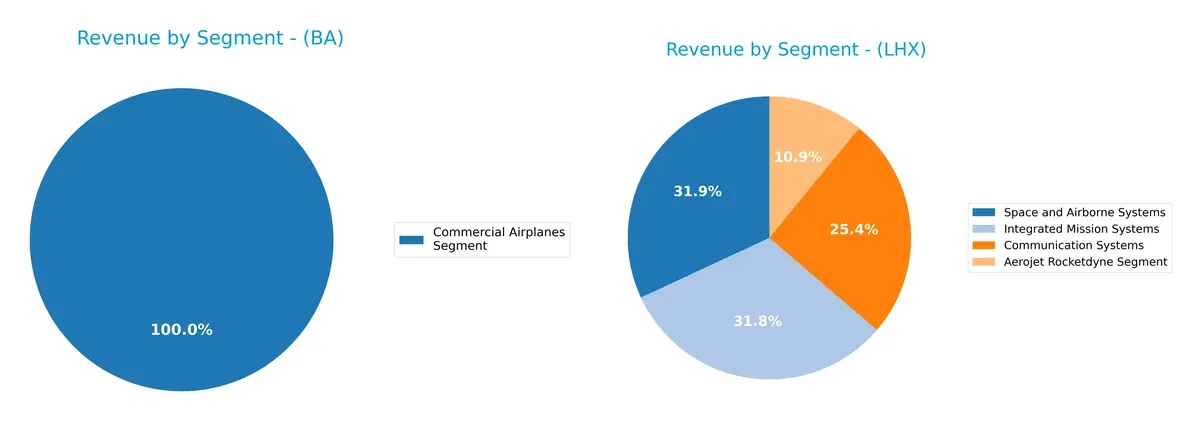
Boeing anchors its revenue on three major segments: Commercial Airplanes ($41.5B in 2025), Defense Space Security, and Global Services, showing moderate diversification. L3Harris relies on a more balanced mix across Communication Systems ($5.46B), Integrated Mission Systems ($6.84B), Space and Airborne Systems ($6.87B), and Aerojet Rocketdyne ($2.35B). Boeing’s concentration in aerospace manufacturing poses higher sector risk, while L3Harris’s diversified defense portfolio reduces dependency on any single market.
Strengths and Weaknesses Comparison
This table compares the Strengths and Weaknesses of Boeing and L3Harris Technologies, Inc.:
BA Strengths
- Diverse revenue streams including Commercial Airplanes, Defense, and Global Services
- Strong ROE at 40.98%
- Favorable fixed asset turnover of 5.73
- Significant US and international market presence with robust geographic diversification
LHX Strengths
- Balanced segment diversification across Communication Systems, Integrated Mission Systems, and Space and Airborne Systems
- Favorable WACC at 6.65% indicating efficient capital cost management
- Strong fixed asset turnover at 8.2
- Favorable debt to assets ratio at 25.35% and quick ratio at 1.02
BA Weaknesses
- Low net margin at 2.5% with unfavorable ROIC of -6.71%
- High PE at 74.05 and PB at 30.35 indicate overvaluation concerns
- Weak liquidity with quick ratio at 0.49 and interest coverage at 1.95
- High debt-to-equity ratio of 9.92 imposes financial risk
LHX Weaknesses
- Unfavorable ROE at 8.18% despite neutral net margin of 7.35%
- PE ratio remains elevated at 34.26
- Neutral interest coverage at 4.24 suggests moderate ability to service debt
Overall, Boeing shows strong profitability metrics like ROE but suffers from weak operational efficiency and financial leverage concerns. L3Harris presents more balanced capital structure and operational metrics, though its profitability and valuation metrics remain modest. These factors shape each company’s strategic priorities in managing growth and risk.
The Moat Duel: Analyzing Competitive Defensibility
A structural moat protects long-term profits from competitive erosion. Without it, market gains quickly vanish:
The Boeing Company: Scale and Diversification Moat
Boeing’s moat stems from its vast aerospace scale and diversified product lines. Despite weak ROIC vs. WACC, its global reach and backlog support margin stability. New space and defense ventures in 2026 could deepen this advantage.
L3Harris Technologies, Inc.: Technology and Integration Moat
L3Harris relies on advanced defense tech and integrated mission systems. Its stronger margins than Boeing show disciplined capital use. However, declining ROIC signals risk. Expansion into cyber and autonomous platforms could disrupt markets.
Scale and Diversification vs. Tech Integration: Who Holds the Moat Edge?
Both firms struggle to sustain ROIC above WACC, signaling value destruction. Boeing’s broader scale and multi-segment exposure provide a wider moat. It appears better positioned to defend market share amid evolving aerospace and defense demands.
Which stock offers better returns?
The chart highlights key price movements and bullish acceleration trends for both companies over the past year, reflecting distinct momentum dynamics and market interest.
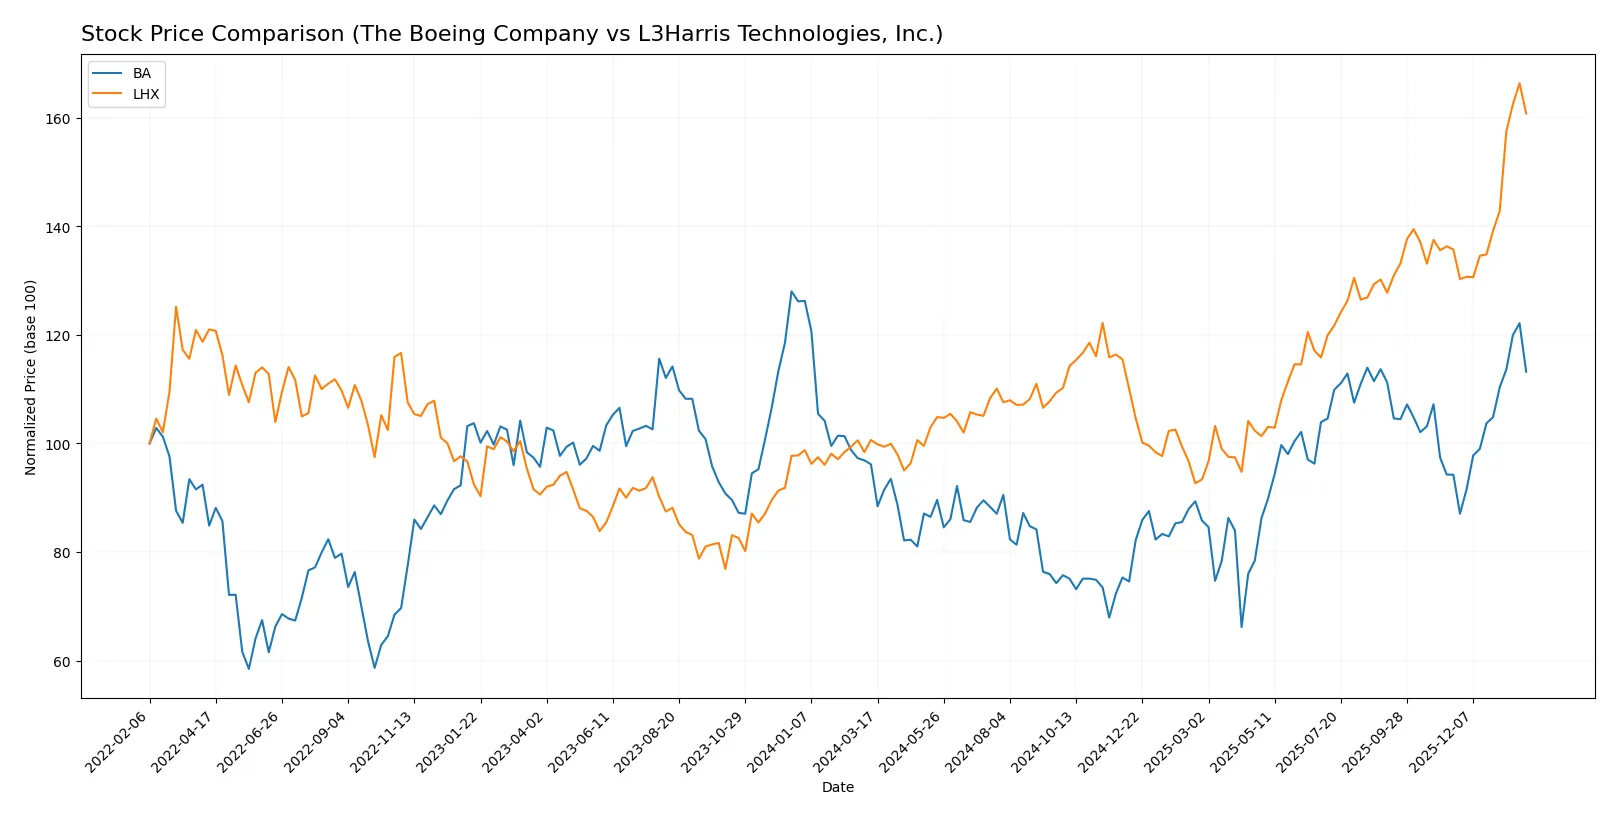
Trend Comparison
The Boeing Company’s stock gained 17.75% over the past 12 months, showing a bullish trend with accelerating price increases and a volatility standard deviation of 26.41. It reached a high of 252.15 and a low of 136.59.
L3Harris Technologies, Inc. rose 59.76% over the same period, also bullish with accelerating momentum and higher volatility at 35.05 standard deviation. Its price ranged from 197.61 to 354.73.
L3Harris clearly outperformed Boeing, delivering the highest market performance with a near 60% gain compared to Boeing’s 18%.
Target Prices
Analysts present a bullish consensus for The Boeing Company and L3Harris Technologies, reflecting confidence in aerospace and defense growth.
| Company | Target Low | Target High | Consensus |
|---|---|---|---|
| The Boeing Company | 150 | 298 | 256.73 |
| L3Harris Technologies, Inc. | 323 | 367 | 352.25 |
Boeing’s consensus target of 257 exceeds its current price of 234, suggesting upside potential. L3Harris’ 352 consensus also sits above the 343 current price, indicating moderate analyst optimism.

Don’t Let Luck Decide Your Entry Point
Optimize your entry points with our advanced ProRealTime indicators. You’ll get efficient buy signals with precise price targets for maximum performance. Start outperforming now!
How do institutions grade them?
The following tables summarize recent institutional grades for The Boeing Company and L3Harris Technologies, Inc.:
The Boeing Company Grades
The table below shows institutional grades for Boeing from notable firms in early 2026.
| Grading Company | Action | New Grade | Date |
|---|---|---|---|
| Citigroup | Maintain | Buy | 2026-01-28 |
| UBS | Maintain | Buy | 2026-01-28 |
| RBC Capital | Maintain | Outperform | 2026-01-28 |
| JP Morgan | Maintain | Overweight | 2026-01-28 |
| Bernstein | Maintain | Outperform | 2026-01-15 |
| Citigroup | Maintain | Buy | 2026-01-13 |
| JP Morgan | Maintain | Overweight | 2025-12-19 |
| Susquehanna | Maintain | Positive | 2025-11-12 |
| Freedom Capital Markets | Upgrade | Buy | 2025-11-03 |
| JP Morgan | Maintain | Overweight | 2025-10-30 |
L3Harris Technologies, Inc. Grades
Below is a summary of recent institutional grades for L3Harris Technologies, Inc.
| Grading Company | Action | New Grade | Date |
|---|---|---|---|
| RBC Capital | Maintain | Sector Perform | 2026-01-30 |
| UBS | Maintain | Neutral | 2026-01-15 |
| RBC Capital | Maintain | Sector Perform | 2026-01-14 |
| Citigroup | Maintain | Buy | 2026-01-13 |
| Morgan Stanley | Upgrade | Overweight | 2025-12-16 |
| JP Morgan | Maintain | Overweight | 2025-11-04 |
| UBS | Maintain | Neutral | 2025-10-31 |
| Truist Securities | Maintain | Buy | 2025-10-15 |
| Morgan Stanley | Maintain | Equal Weight | 2025-10-15 |
| Barclays | Maintain | Overweight | 2025-07-29 |
Which company has the best grades?
Boeing consistently receives stronger positive ratings such as Buy and Outperform from multiple firms. L3Harris shows more mixed grades, with several Neutral and Sector Perform marks. Boeing’s higher grades could signal greater institutional confidence, potentially influencing investor sentiment and valuation.
Risks specific to each company
The following categories identify the critical pressure points and systemic threats facing both firms in the 2026 market environment:
1. Market & Competition
The Boeing Company
- Faces intense competition in commercial jets and defense; high PE and PB ratios suggest valuation risk.
L3Harris Technologies, Inc.
- Competes in niche defense tech markets; lower PE and PB ratios indicate more reasonable valuation.
2. Capital Structure & Debt
The Boeing Company
- High debt-to-equity (9.92) and weak interest coverage (1.95) signal financial strain and risk.
L3Harris Technologies, Inc.
- Much lower debt-to-equity (0.53) and better interest coverage (4.24) reflect stronger financial health.
3. Stock Volatility
The Boeing Company
- Beta 1.16 indicates above-market volatility, increasing risk during downturns.
L3Harris Technologies, Inc.
- Beta 0.66 shows below-market volatility; stock likely more stable in turbulent markets.
4. Regulatory & Legal
The Boeing Company
- Subject to heavy scrutiny from safety and export regulators, especially after past product issues.
L3Harris Technologies, Inc.
- Faces regulatory risks typical for defense contractors but lacks Boeing’s recent safety controversies.
5. Supply Chain & Operations
The Boeing Company
- Large, complex supply chain vulnerable to delays and cost overruns, impacting margins.
L3Harris Technologies, Inc.
- More focused operations with less exposure to global supply chain disruptions.
6. ESG & Climate Transition
The Boeing Company
- Pressure to decarbonize aviation and improve sustainability amid rising stakeholder demands.
L3Harris Technologies, Inc.
- ESG risks moderate; defense tech focus means less direct emissions but increasing scrutiny on ethical practices.
7. Geopolitical Exposure
The Boeing Company
- Global operations expose it to geopolitical tensions affecting commercial and defense sales.
L3Harris Technologies, Inc.
- Defense contracts mostly US-focused, reducing exposure but reliant on government budgets and policies.
Which company shows a better risk-adjusted profile?
Boeing’s largest risk is its stretched capital structure, with high debt and weak liquidity threatening financial flexibility. L3Harris risks lie in moderate valuation and dependence on government contracts but boasts a healthier balance sheet. L3Harris’s lower volatility and stronger financial scores underpin a superior risk-adjusted profile. Boeing’s Altman Z-score in the distress zone versus L3Harris’s grey zone confirms this divergence. Recent data showing Boeing’s weak interest coverage and high leverage justifies caution for investors.
Final Verdict: Which stock to choose?
The Boeing Company’s superpower lies in its remarkable revenue and earnings growth, signaling strong operational momentum. However, its deteriorating capital efficiency and high leverage remain points of vigilance. Boeing might suit aggressive growth portfolios willing to tolerate cyclical and financial risks for potential rebound upside.
L3Harris Technologies boasts a strategic moat through consistent cash flow generation and a solid balance sheet. Its lower leverage and stronger liquidity offer relative safety compared to Boeing. L3Harris aligns well with GARP portfolios seeking steady growth coupled with reasonable financial discipline.
If you prioritize rapid growth fueled by market recovery, Boeing’s impressive top-line surge outshines despite capital allocation concerns. However, if you seek better stability with moderate growth and financial prudence, L3Harris offers a more balanced risk-reward profile. Both require close monitoring of profitability trends and leverage management amid sector headwinds.
Disclaimer: Investment carries a risk of loss of initial capital. The past performance is not a reliable indicator of future results. Be sure to understand risks before making an investment decision.
Go Further
I encourage you to read the complete analyses of The Boeing Company and L3Harris Technologies, Inc. to enhance your investment decisions: