Home > Comparison > Industrials > LHX vs TXT
The strategic rivalry between L3Harris Technologies, Inc. and Textron Inc. defines the current trajectory of the Aerospace & Defense sector. L3Harris operates as a technology-driven mission systems integrator, while Textron combines aerospace manufacturing with diversified industrial and finance operations. This head-to-head contrasts specialization against diversification. This analysis will determine which corporate model offers superior risk-adjusted returns for a diversified portfolio in the evolving industrial landscape.
Table of contents
Companies Overview
L3Harris Technologies and Textron Inc. stand as pivotal players in the aerospace and defense landscape.
L3Harris Technologies, Inc.: Aerospace & Defense Innovator
L3Harris dominates with mission-critical aerospace and defense solutions for government and commercial clients. Its revenue stems from integrated ISR systems, tactical communications, and avionics. In 2026, it strategically emphasizes advanced sensor technology and secure battlefield communication, reinforcing its leadership in multi-domain defense platforms.
Textron Inc.: Diversified Aerospace & Industrial Powerhouse
Textron operates across multiple sectors, including aircraft manufacturing, defense systems, and industrial products. Its core revenue originates from business jets, military helicopters, unmanned systems, and specialty vehicles. In 2026, Textron focuses on expanding unmanned aircraft capabilities and enhancing its industrial vehicle portfolio to balance aerospace innovation with diversified industrial growth.
Strategic Collision: Similarities & Divergences
Both companies serve the aerospace and defense market but differ markedly in business philosophy. L3Harris pursues a technology-driven, integrated systems approach, while Textron adopts a diversified portfolio combining aerospace with industrial products. Their primary battleground lies in defense aviation and unmanned systems. L3Harris offers a focused, high-tech investment profile, contrasting with Textron’s broader, multi-segment exposure.
Income Statement Comparison
This data dissects the core profitability and scalability of L3Harris Technologies and Textron to reveal who dominates the bottom line:
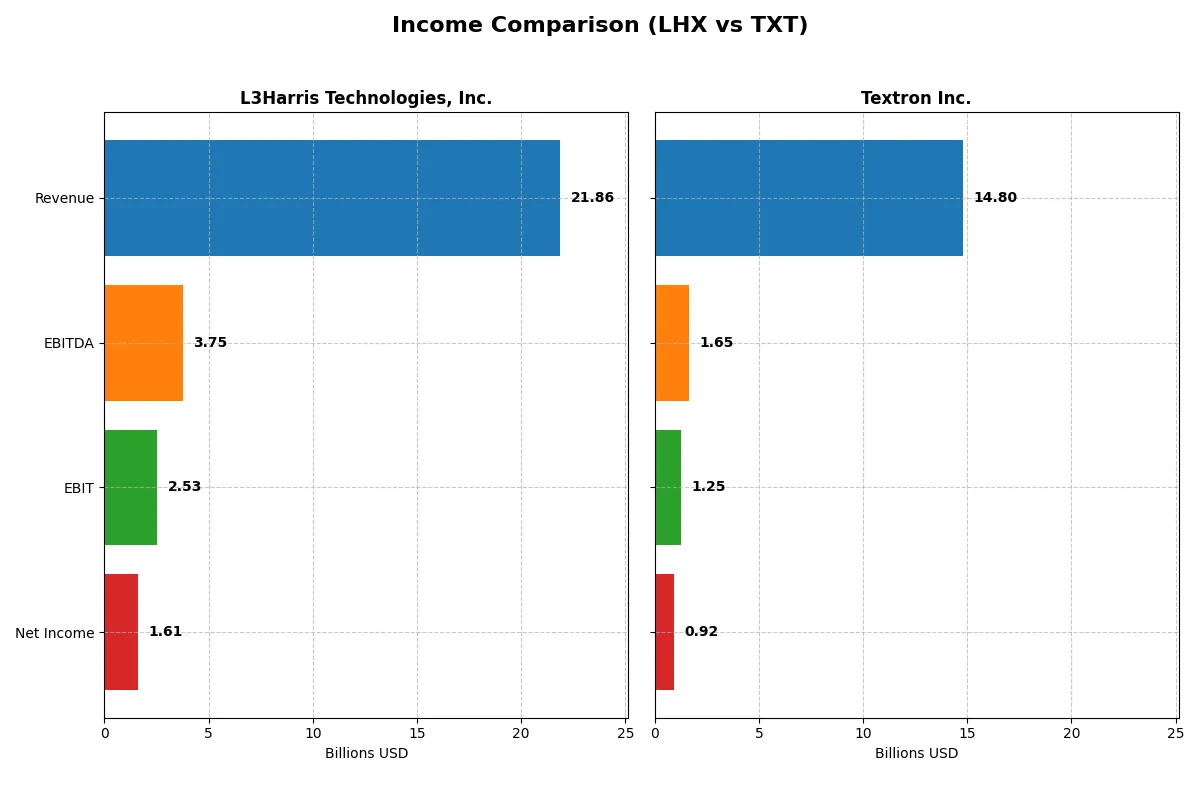
| Metric | L3Harris Technologies, Inc. (LHX) | Textron Inc. (TXT) |
|---|---|---|
| Revenue | 21.9B | 14.8B |
| Cost of Revenue | 16.2B | 12.3B |
| Operating Expenses | 3.43B | 1.25B |
| Gross Profit | 5.63B | 2.50B |
| EBITDA | 3.75B | 1.65B |
| EBIT | 2.53B | 1.25B |
| Interest Expense | 597M | 97M |
| Net Income | 1.61B | 921M |
| EPS | 8.57 | 5.11 |
| Fiscal Year | 2025 | 2025 |
Income Statement Analysis: The Bottom-Line Duel
This income statement comparison uncovers which company runs a more efficient and profitable business engine in 2025.
L3Harris Technologies, Inc. Analysis
L3Harris grows revenue steadily to $21.9B in 2025 but sees mixed net income trends, with $1.61B reported last year. Its gross margin improves to 25.7%, signaling solid production efficiency, while net margin holds at a respectable 7.4%. Recent years show healthy EBIT growth, though net income growth lags overall, reflecting margin pressure and higher operating costs.
Textron Inc. Analysis
Textron boosts revenue by 8% to $14.8B in 2025, with net income rising 12% to $921M. Its gross margin remains moderate at 16.9%, but net margin strengthens to 6.2%. The company outpaces L3Harris in net income and EPS growth over five years, indicating effective cost control and capital allocation despite lower scale.
Margin Strength vs. Growth Momentum
L3Harris leads in scale and gross margin efficiency, but Textron delivers superior net income and EPS growth, reflecting sharper operational momentum. Textron’s faster profit expansion makes it appealing for growth-focused investors, whereas L3Harris’s larger revenue base and stable margins suit those prioritizing scale and margin resilience.
Financial Ratios Comparison
These vital ratios act as a diagnostic tool to expose the underlying fiscal health, valuation premiums, and capital efficiency of the companies compared below:
| Ratios | L3Harris Technologies, Inc. (LHX) | Textron Inc. (TXT) |
|---|---|---|
| ROE | 8.18% | 11.70% |
| ROIC | 5.37% | 9.41% |
| P/E | 35.53 | 17.04 |
| P/B | 2.91 | 1.99 |
| Current Ratio | 1.19 | 5.94 |
| Quick Ratio | 1.02 | 2.33 |
| D/E | 0.53 | 0.45 |
| Debt-to-Assets | 25.35% | 19.49% |
| Interest Coverage | 3.68 | 12.88 |
| Asset Turnover | 0.53 | 0.82 |
| Fixed Asset Turnover | 8.20 | 5.71 |
| Payout ratio | 56.23% | 2.06% |
| Dividend yield | 1.58% | 0.12% |
| Fiscal Year | 2025 | 2025 |
Efficiency & Valuation Duel: The Vital Signs
Financial ratios serve as a company’s DNA, exposing hidden risks and operational strengths that shape investor decisions.
L3Harris Technologies, Inc.
L3Harris shows moderate profitability with an 8.18% ROE, slightly below ideal benchmarks. Its P/E ratio of 35.53 suggests a stretched valuation, pricing in high growth expectations. The company returns value via a 1.58% dividend yield, balancing moderate shareholder distributions with reinvestment in operational efficiency.
Textron Inc.
Textron delivers stronger core profitability with an 11.7% ROE at a more reasonable P/E of 17.04, indicating a fair valuation. It maintains a solid capital structure with favorable debt ratios and high interest coverage. Despite a low 0.12% dividend yield, it prioritizes growth investments, reflecting in efficient asset turnover of 0.82.
Premium Valuation vs. Operational Safety
L3Harris trades at a premium with modest returns, posing valuation risk, while Textron offers a better profitability-to-price balance and stronger financial health. Risk-tolerant investors might favor L3Harris’s growth profile; conservative investors may prefer Textron’s operational resilience.
Which one offers the Superior Shareholder Reward?
I compare L3Harris Technologies (LHX) and Textron Inc. (TXT) by their dividend yields, payout ratios, and buyback intensity to assess total shareholder return sustainability in 2026. LHX yields 1.58% with a 56% payout ratio and strong FCF coverage, reflecting a balanced dividend and buyback mix. TXT’s yield is minimal at 0.12%, with a 2% payout ratio, signaling a reinvestment-heavy approach despite modest buybacks. LHX’s higher dividend and consistent buybacks, supported by solid free cash flow, offer a more sustainable and attractive total return profile. I conclude LHX outperforms TXT in rewarding shareholders over the long term.
Comparative Score Analysis: The Strategic Profile
The radar chart reveals the fundamental DNA and trade-offs of L3Harris Technologies, Inc. and Textron Inc., highlighting their financial strengths and valuation nuances:
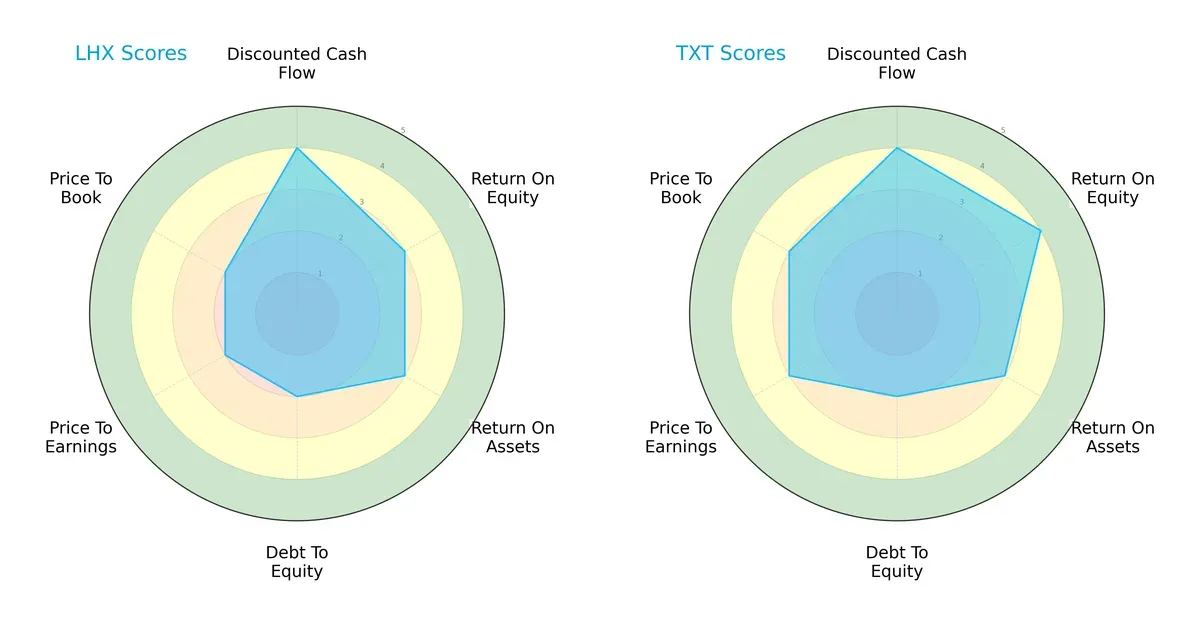
Textron edges out with a stronger return on equity (4 vs. 3) and better valuation scores (P/E 3 vs. 2, P/B 3 vs. 2). Both firms share equal discounted cash flow strength (4) and asset efficiency (ROA 3). However, both struggle with debt management (Debt/Equity 2). Textron’s profile is more balanced across profitability and valuation, while L3Harris leans on DCF strength but shows valuation pressure.
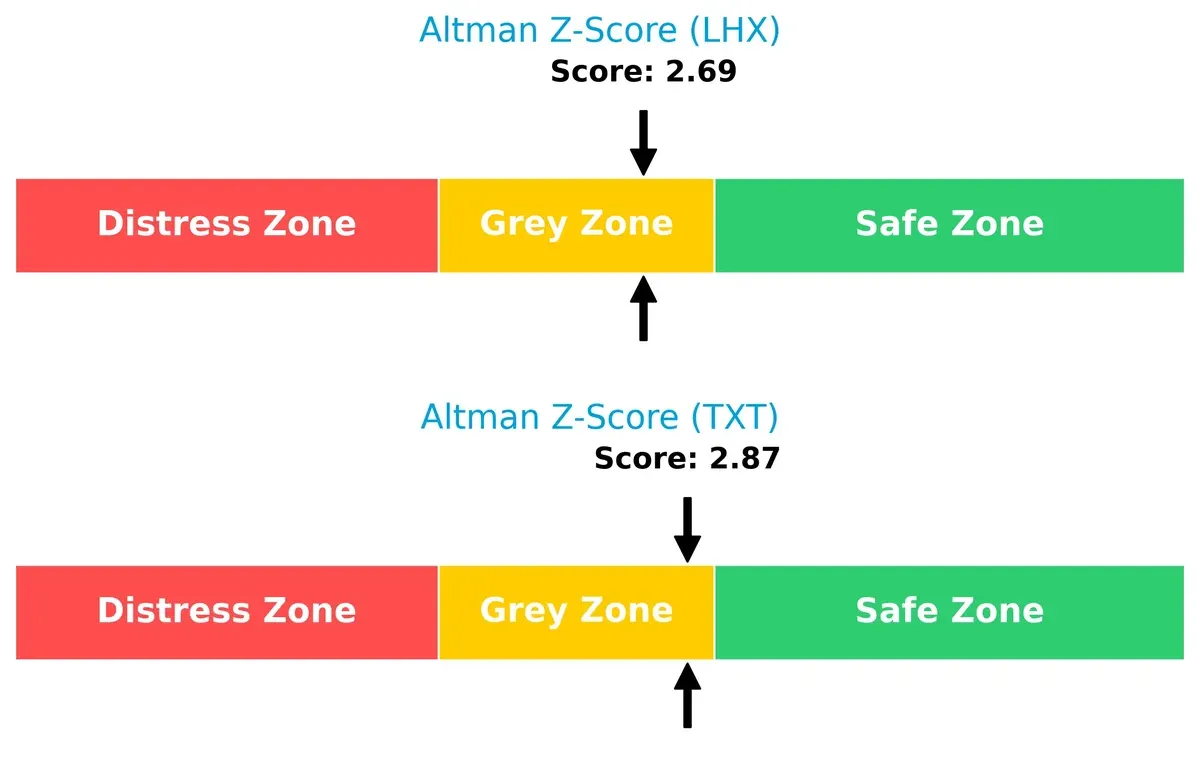
Bankruptcy Risk: Solvency Showdown
L3Harris and Textron both fall in the Altman Z-Score grey zone (2.69 vs. 2.87), signaling moderate bankruptcy risk. These scores imply cautious optimism for survival, but neither is immune to financial stress in a downturn:
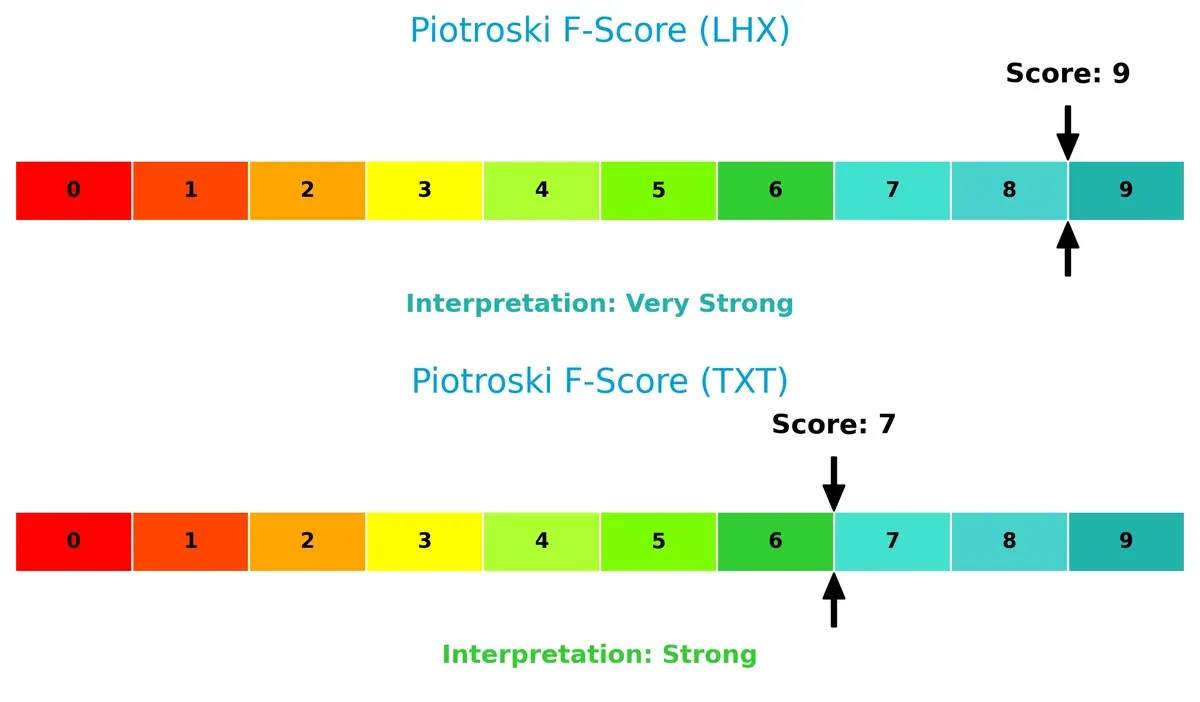
Financial Health: Quality of Operations
L3Harris scores a perfect 9 on the Piotroski F-Score, indicating very strong financial health and operational quality. Textron’s 7 is strong but suggests some internal metrics warrant attention:
How are the two companies positioned?
This section dissects the operational DNA of LHX and TXT by comparing revenue distribution and internal dynamics. The goal is to confront their economic moats and identify the more resilient, sustainable competitive advantage.
Revenue Segmentation: The Strategic Mix
This comparison dissects how L3Harris Technologies and Textron Inc. diversify their income streams and highlights where their primary sector bets lie:
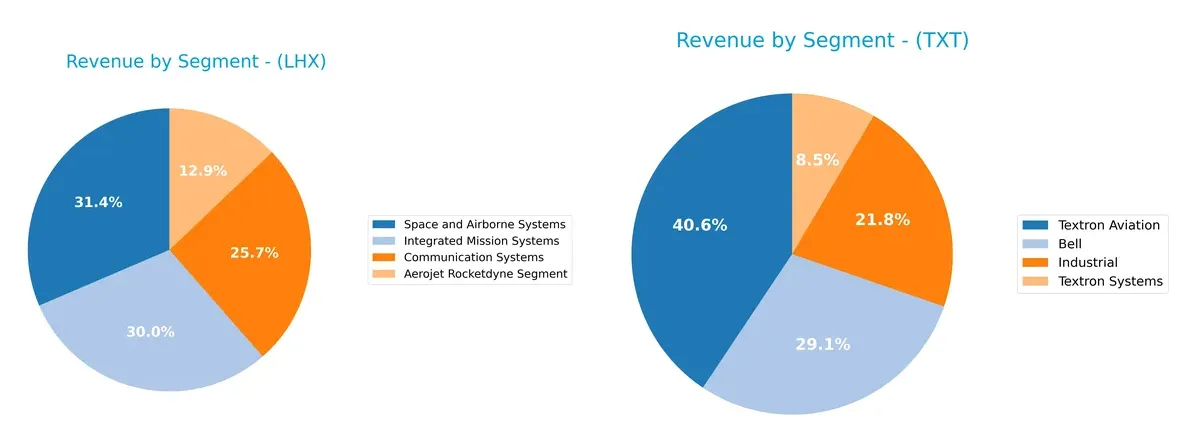
L3Harris balances revenue across four segments, with Space and Airborne Systems anchoring at $6.95B, while Textron leans heavily on Textron Aviation, which dwarfs its $5.98B peers. L3Harris’s diversified portfolio reduces concentration risk and supports ecosystem lock-in. Textron’s reliance on aviation exposes it to cyclical industry swings but leverages infrastructure dominance in aerospace. The contrast shows L3Harris prioritizes stability; Textron bets on focused sector strength.
Strengths and Weaknesses Comparison
This table compares the strengths and weaknesses of L3Harris Technologies, Inc. and Textron Inc.:
LHX Strengths
- Diversified revenue streams across Aerojet Rocketdyne, Communication, Integrated Mission, and Space Systems
- Favorable WACC and debt-to-assets ratio highlight strong capital structure
- Quick ratio and fixed asset turnover indicate efficient liquidity and asset use
TXT Strengths
- Broad segment diversification including Bell, Industrial, Aviation, and Systems
- Favorable debt-to-equity and interest coverage ratios demonstrate solid financial health
- Higher ROIC and asset turnover reflect operational efficiency
LHX Weaknesses
- Unfavorable ROE and high P/E ratio suggest limited profitability and expensive valuation
- Neutral current ratio signals moderate short-term liquidity risk
- Net margin and other profitability metrics are only neutral
TXT Weaknesses
- Unfavorable current ratio points to liquidity concerns despite strong quick ratio
- Low dividend yield may deter income-focused investors
- Net margin is neutral, and P/E ratio is moderate but less attractive than peers
Both companies show slightly favorable financial profiles with distinct operational strengths. LHX excels in capital structure and segment diversification, while Textron leads in operational efficiency but faces liquidity challenges. These contrasts highlight differing strategic priorities within similar aerospace and defense sectors.
The Moat Duel: Analyzing Competitive Defensibility
A structural moat protects long-term profits from competition’s relentless erosion by sustaining economic advantages that rivals struggle to replicate:
L3Harris Technologies, Inc.: Integrated Systems and Innovation Moat
L3Harris leans on advanced mission-critical ISR and communication systems, reflected in stable 25.7% gross margins. Yet, declining ROIC signals weakening capital efficiency, risking moat erosion despite new tech investments in 2026.
Textron Inc.: Diversified Industrial and Aerospace Moat
Textron’s broad portfolio including aviation and defense drives a steadily growing ROIC above WACC, signaling value creation. Its expanding market reach and innovation in unmanned systems bolster competitive positioning versus L3Harris’s concentrated focus.
Value Creation vs. Capital Efficiency: Textron’s Rising MOAT Challenges L3Harris’s Decline
Textron shows a wider, growing economic moat with a 61.7% ROIC trend and value-creating returns. L3Harris’s shrinking ROIC warns of value destruction. Textron stands better equipped to defend and expand market share.
Which stock offers better returns?
Over the past year, L3Harris Technologies and Textron both show upward price momentum, with LHX exhibiting stronger gains and higher volatility compared to TXT’s modest rise and steadier trading range.
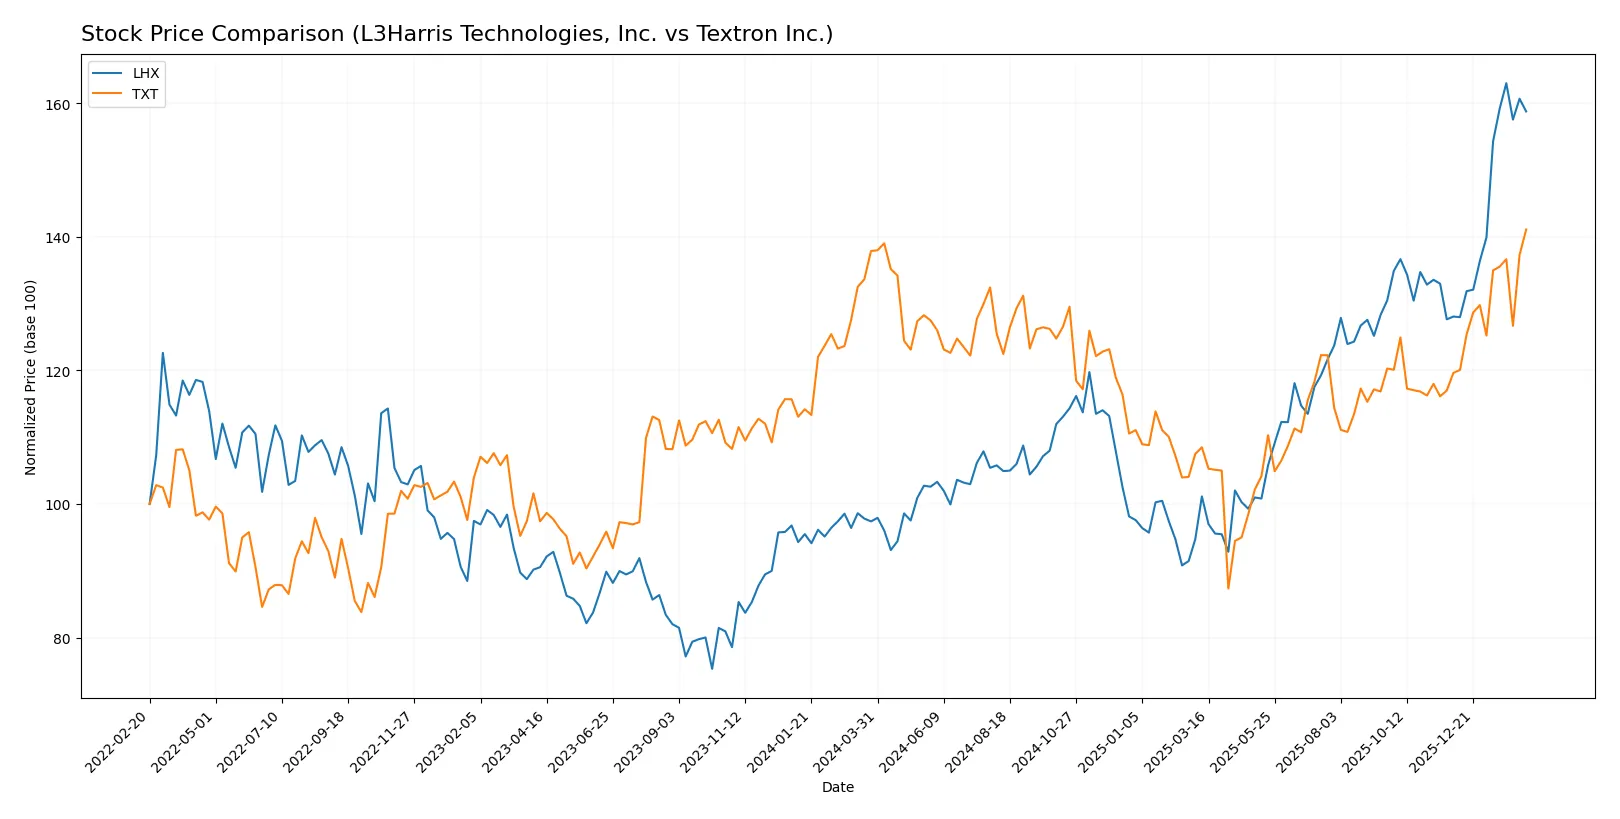
Trend Comparison
L3Harris Technologies (LHX) shows a bullish trend with a 63.02% price increase over 12 months, marked by acceleration and a high volatility level (std. dev. 37.57). The stock ranged between 197.61 and 354.73.
Textron (TXT) also displays a bullish trend with a 2.34% gain over the same period, accompanied by acceleration but significantly lower volatility (std. dev. 7.38). Prices moved between 60.72 and 98.09.
LHX’s 63.02% gain far exceeds TXT’s 2.34%, making LHX the stronger performer over the past year despite higher risk reflected in its volatility.
Target Prices
Analysts show a positive outlook for L3Harris Technologies, Inc. and Textron Inc., with target prices above current levels.
| Company | Target Low | Target High | Consensus |
|---|---|---|---|
| L3Harris Technologies, Inc. | 323 | 367 | 352.25 |
| Textron Inc. | 92 | 110 | 101 |
L3Harris targets suggest a 2% upside from the current price of 345.5, while Textron’s consensus implies a 3% potential gain from its 98.09 share price.

Don’t Let Luck Decide Your Entry Point
Optimize your entry points with our advanced ProRealTime indicators. You’ll get efficient buy signals with precise price targets for maximum performance. Start outperforming now!
How do institutions grade them?
L3Harris Technologies, Inc. Grades
The following table summarizes recent grades issued by prominent financial institutions for L3Harris Technologies, Inc.:
| Grading Company | Action | New Grade | Date |
|---|---|---|---|
| Citigroup | Maintain | Buy | 2026-02-05 |
| JP Morgan | Maintain | Overweight | 2026-02-05 |
| Morgan Stanley | Maintain | Overweight | 2026-02-02 |
| RBC Capital | Maintain | Sector Perform | 2026-01-30 |
| UBS | Maintain | Neutral | 2026-01-15 |
| RBC Capital | Maintain | Sector Perform | 2026-01-14 |
| Citigroup | Maintain | Buy | 2026-01-13 |
| Morgan Stanley | Upgrade | Overweight | 2025-12-16 |
| JP Morgan | Maintain | Overweight | 2025-11-04 |
| UBS | Maintain | Neutral | 2025-10-31 |
Textron Inc. Grades
Below is a summary of recent grades for Textron Inc. issued by leading grading companies:
| Grading Company | Action | New Grade | Date |
|---|---|---|---|
| Jefferies | Maintain | Buy | 2026-02-02 |
| Citigroup | Maintain | Neutral | 2026-01-29 |
| JP Morgan | Maintain | Neutral | 2026-01-29 |
| UBS | Maintain | Neutral | 2026-01-15 |
| Citigroup | Maintain | Neutral | 2026-01-13 |
| JP Morgan | Maintain | Neutral | 2025-10-27 |
| UBS | Maintain | Neutral | 2025-10-24 |
| TD Cowen | Maintain | Hold | 2025-10-24 |
| Barclays | Maintain | Overweight | 2025-07-29 |
| UBS | Upgrade | Neutral | 2025-07-28 |
Which company has the best grades?
L3Harris Technologies commands consistently stronger grades, with multiple Buy and Overweight ratings. Textron’s grades mostly cluster around Neutral, with fewer Buy recommendations. Investors may view L3Harris as having greater analyst conviction, potentially influencing portfolio allocation decisions.
Risks specific to each company
The following categories identify critical pressure points and systemic threats facing both firms in the 2026 market environment:
1. Market & Competition
L3Harris Technologies, Inc. (LHX)
- Operates in a high-tech aerospace defense niche with strong government contracts but faces intense rivalry from larger defense primes.
Textron Inc. (TXT)
- Diversified aerospace and industrial portfolio balances defense exposure but competes with specialized manufacturers and commercial aviation firms.
2. Capital Structure & Debt
LHX
- Moderate leverage with debt-to-assets at 25.35%, interest coverage of 4.24x signals manageable debt but warrants caution.
TXT
- Lower leverage at 19.49% debt-to-assets and strong interest coverage of 12.84x indicates a healthier balance sheet and financial flexibility.
3. Stock Volatility
LHX
- Beta of 0.64 suggests lower market volatility, appealing for risk-averse investors in cyclical defense industry.
TXT
- Beta near 0.98 implies market-level volatility, reflecting sensitivity to broader economic swings and industrial cycles.
4. Regulatory & Legal
LHX
- Exposure to stringent US defense contracting regulations and export controls could constrain growth and increase compliance costs.
TXT
- Similar regulatory environment with added complexity from industrial and finance segments, increasing legal and compliance risks.
5. Supply Chain & Operations
LHX
- Relies on specialized components for ISR and communication systems; supply disruptions could delay critical programs.
TXT
- Complex supply chain spanning aerospace, industrial vehicles, and finance services increases operational risk amid global supply challenges.
6. ESG & Climate Transition
LHX
- Moderate ESG risk; defense sector faces scrutiny on sustainability but benefits from advancing secure tech solutions.
TXT
- Industrial operations and vehicle manufacturing face greater emissions and sustainability pressures, requiring costly adaptations.
7. Geopolitical Exposure
LHX
- Global defense contracts expose LHX to geopolitical shifts and potential export restrictions affecting revenues.
TXT
- International aerospace and defense sales subject to geopolitical tensions; diversified geography mitigates localized risks.
Which company shows a better risk-adjusted profile?
LHX’s primary risk lies in regulatory and geopolitical pressures impacting its specialized defense contracts. TXT faces higher operational complexity and supply chain risks due to its diversified segments. TXT’s stronger balance sheet and higher interest coverage improve its risk buffer. Recent data shows TXT’s debt-to-assets ratio at a healthier 19.49%, compared to LHX’s 25.35%, indicating better financial resilience. Overall, TXT offers a more balanced risk-adjusted profile amid 2026 uncertainties.
Final Verdict: Which stock to choose?
L3Harris Technologies, Inc. (LHX) wields a superpower in operational efficiency and solid free cash flow generation, positioning it as a cash machine in the aerospace sector. Its declining ROIC and value destruction signal a point of vigilance. LHX fits an aggressive growth portfolio willing to tolerate cyclical pressures.
Textron Inc. (TXT) boasts a strategic moat through its improving ROIC and strong balance sheet, reflecting a sustainable competitive advantage. Its lower valuation multiples and higher financial stability offer a safer profile than LHX. TXT suits a GARP investor seeking steady growth with reasonable risk.
If you prioritize high operational efficiency and are comfortable with value volatility, LHX presents a compelling scenario due to its cash flow strength. However, if you seek growing profitability and better financial stability, TXT outshines as the choice for risk-conscious growth investors. Both stocks warrant careful monitoring of their respective risks.
Disclaimer: Investment carries a risk of loss of initial capital. The past performance is not a reliable indicator of future results. Be sure to understand risks before making an investment decision.
Go Further
I encourage you to read the complete analyses of L3Harris Technologies, Inc. and Textron Inc. to enhance your investment decisions: