Home > Comparison > Industrials > RTX vs LHX
The strategic rivalry between RTX Corporation and L3Harris Technologies defines the aerospace and defense sector’s competitive landscape. RTX operates as a diversified industrial powerhouse with broad commercial and military aerospace segments. L3Harris focuses on high-tech mission-critical systems and electronic warfare solutions. This head-to-head contrasts scale and diversification against specialized innovation. This analysis seeks to identify which company offers superior risk-adjusted returns for a well-balanced portfolio in 2026.
Table of contents
Companies Overview
RTX Corporation and L3Harris Technologies, Inc. are pivotal players shaping the aerospace and defense landscape in 2026.
RTX Corporation: Aerospace & Defense Powerhouse
RTX Corporation dominates with a diversified aerospace and defense portfolio spanning commercial, military, and government sectors. Its revenue is driven by three core segments: Collins Aerospace, Pratt & Whitney, and Raytheon, focusing on aircraft systems, engines, and advanced defense solutions. In 2026, RTX emphasizes integrating cutting-edge technologies to enhance both aircraft efficiency and battlefield capabilities.
L3Harris Technologies, Inc.: Mission-Critical Innovator
L3Harris Technologies, Inc. excels as a specialist in aerospace and defense technology, providing mission-critical ISR and communication systems globally. Its Integrated Mission Systems and Space and Airborne Systems segments form the backbone of its revenue, delivering advanced sensors, cyber defense, and tactical communications. The firm’s 2026 strategy centers on expanding autonomous solutions and secured mobile network capabilities for defense and public safety.
Strategic Collision: Similarities & Divergences
Both companies focus on aerospace and defense but differ strategically: RTX pursues a broad, vertically integrated model, while L3Harris prioritizes specialized, high-tech mission solutions. They compete fiercely in defense electronics and communication systems. RTX’s scale contrasts with L3Harris’s innovation agility, creating distinct investment profiles—one grounded in scale and diversification, the other in niche technological leadership.
Income Statement Comparison
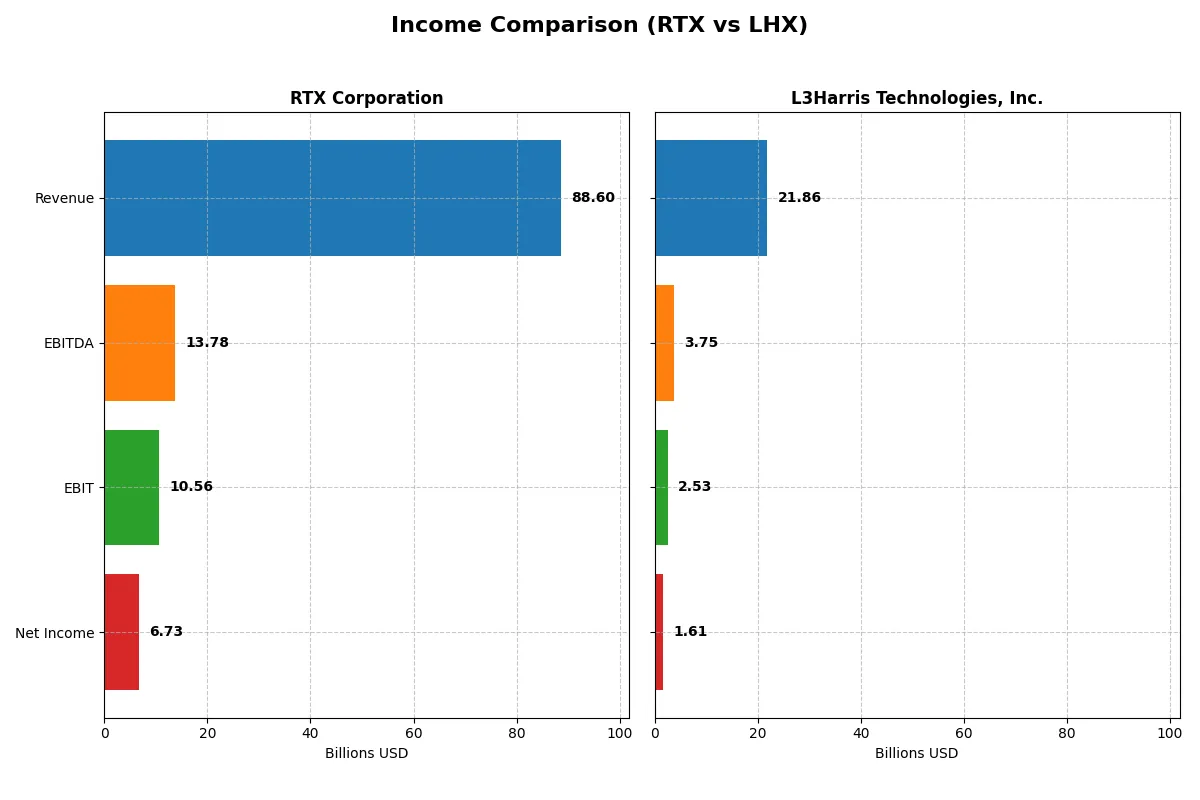
This data dissects the core profitability and scalability of both corporate engines to reveal who dominates the bottom line:
| Metric | RTX Corporation (RTX) | L3Harris Technologies, Inc. (LHX) |
|---|---|---|
| Revenue | 88.6B | 21.9B |
| Cost of Revenue | 70.8B | 16.2B |
| Operating Expenses | 8.9B | 3.4B |
| Gross Profit | 17.8B | 5.6B |
| EBITDA | 13.8B | 3.8B |
| EBIT | 10.6B | 2.5B |
| Interest Expense | 1.8B | 0.6B |
| Net Income | 6.7B | 1.6B |
| EPS | 5.03 | 8.57 |
| Fiscal Year | 2025 | 2025 |
Income Statement Analysis: The Bottom-Line Duel
This income statement comparison reveals which company operates its business more efficiently and generates stronger profitability.
RTX Corporation Analysis
RTX steadily grows revenue from $64B in 2021 to $88.6B in 2025, with net income surging from $3.9B to $6.7B. Its gross margin holds firm around 20%, while net margin expands to 7.6%, signaling improving cost control. The 2025 results highlight strong momentum, with EBIT rising nearly 30% year-over-year.
L3Harris Technologies, Inc. Analysis
L3Harris shows modest revenue growth to $21.9B in 2025 from $17B in 2022 but trails RTX in scale. Gross margin is healthier at 25.7%, while net margin slightly contracts to 7.35%. The latest year reflects slower revenue growth (2.5%) and a mixed net margin trend, dampening overall income momentum.
Verdict: Scale Dominance vs. Margin Strength
RTX dominates in revenue growth (+37.7% over five years) and net income (+74%), outperforming LHX’s slower revenue climb (+22.7%) and declining net income (-13%). RTX’s expanding margins and robust EPS growth make it the fundamental winner. Investors seeking strong growth and margin improvement will find RTX’s profile more compelling.
Financial Ratios Comparison
These vital ratios act as a diagnostic tool to expose the underlying fiscal health, valuation premiums, and capital efficiency of the companies analyzed:
| Ratios | RTX Corporation (RTX) | L3Harris Technologies, Inc. (LHX) |
|---|---|---|
| ROE | 10.3% | 8.2% |
| ROIC | 6.2% | 5.4% |
| P/E | 36.6 | 35.5 |
| P/B | 3.78 | 2.91 |
| Current Ratio | 1.03 | 1.19 |
| Quick Ratio | 0.80 | 1.02 |
| D/E | 0.63 | 0.53 |
| Debt-to-Assets | 24.0% | 25.4% |
| Interest Coverage | 4.86 | 3.68 |
| Asset Turnover | 0.52 | 0.53 |
| Fixed Asset Turnover | 4.72 | 8.20 |
| Payout Ratio | 53.1% | 56.2% |
| Dividend Yield | 1.45% | 1.58% |
| Fiscal Year | 2025 | 2025 |
Efficiency & Valuation Duel: The Vital Signs
Financial ratios serve as a company’s DNA, uncovering hidden risks and revealing operational strength beneath surface metrics.
RTX Corporation
RTX shows moderate profitability with a 10.3% ROE and a neutral 7.6% net margin. The valuation appears stretched, marked by a high 36.6 P/E and a 3.78 P/B ratio. Shareholders receive a modest 1.45% dividend yield, reflecting a balanced capital allocation between returns and reinvestment in R&D (3.2% of revenue).
L3Harris Technologies, Inc.
L3Harris delivers a slightly lower 8.2% ROE and a neutral 7.35% net margin, paired with a slightly more attractive 35.5 P/E and 2.91 P/B. The company maintains a solid dividend yield of 1.58%. Its strategy emphasizes operational efficiency with a favorable quick ratio and significant fixed asset turnover at 8.2x.
Valuation Stretch vs. Operational Efficiency
Both firms present slightly favorable overall ratios, yet RTX’s higher ROE contrasts with its stretched valuation. L3Harris offers a better liquidity profile and asset efficiency but slightly weaker profitability. Investors prioritizing operational safety may lean toward L3Harris, while those seeking return potential might consider RTX’s profile.
Which one offers the Superior Shareholder Reward?
I compare RTX Corporation and L3Harris Technologies, Inc. on their distribution strategies. RTX yields 1.45% with a 53% payout ratio, while LHX yields 1.58% with a 56% payout ratio. RTX’s free cash flow per share stands at 5.9, supporting a sustainable dividend and moderate buybacks. LHX generates a stronger 14.3 FCF per share, enabling higher dividends and more aggressive buybacks. Historically, LHX’s balance of yield and capital return fosters superior long-term value. I conclude L3Harris offers the more attractive total shareholder return profile in 2026.
Comparative Score Analysis: The Strategic Profile
The radar chart reveals the fundamental DNA and trade-offs of RTX Corporation and L3Harris Technologies, Inc., highlighting their financial strengths and vulnerabilities:
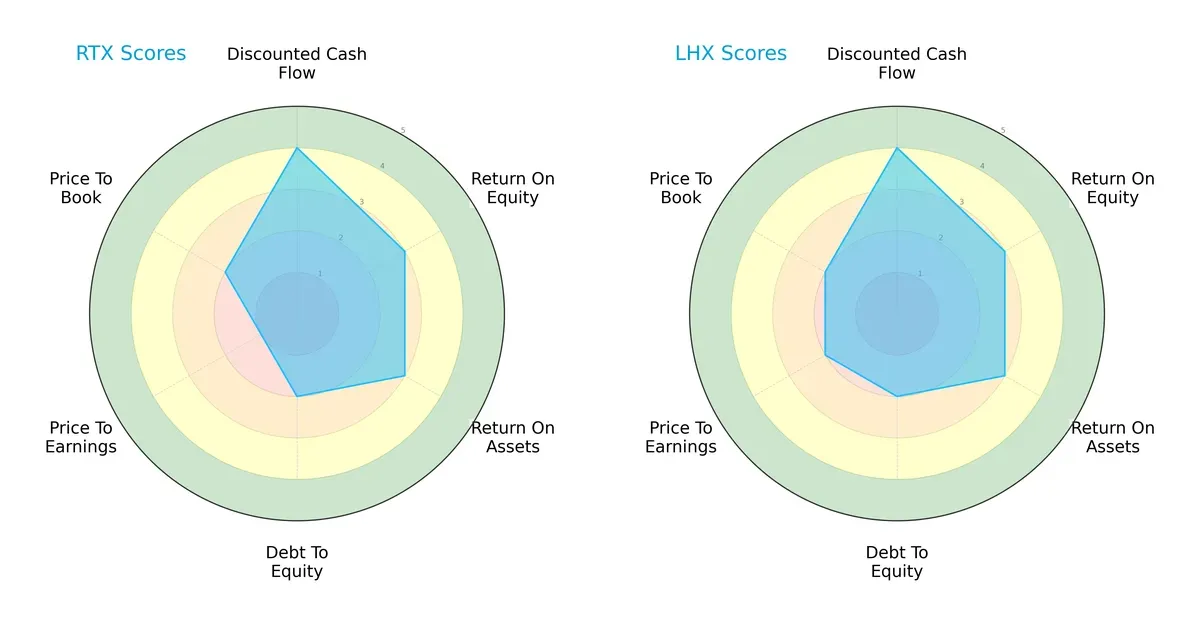
RTX and LHX share similar strengths in discounted cash flow and return metrics, both scoring moderately on ROE and ROA. However, LHX edges out RTX with a slightly better valuation profile, scoring higher on P/E and P/B ratios. Both exhibit weak debt-to-equity scores, indicating elevated leverage risks. LHX presents a more balanced profile, while RTX relies heavily on its DCF strength but suffers from valuation challenges.
Bankruptcy Risk: Solvency Showdown
The Altman Z-Scores place both RTX and LHX in the grey zone, signaling moderate bankruptcy risk in this economic cycle:
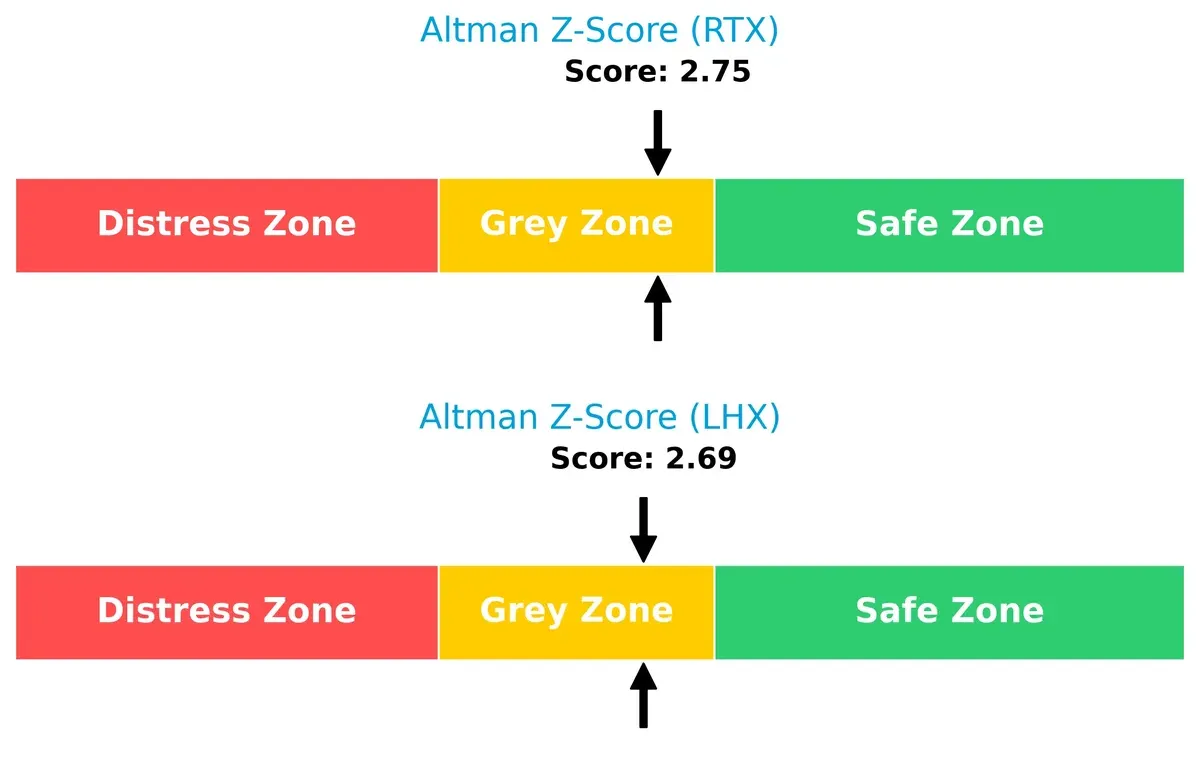
RTX’s score of 2.75 slightly surpasses LHX’s 2.69, but both firms hover below the safe threshold of 3. This suggests cautious optimism; neither shows immediate distress, but financial resilience is not guaranteed under adverse conditions.
Financial Health: Quality of Operations
LHX leads with a Piotroski F-Score of 9, indicating very strong financial health, while RTX’s score of 7, though strong, signals comparatively weaker internal fundamentals:
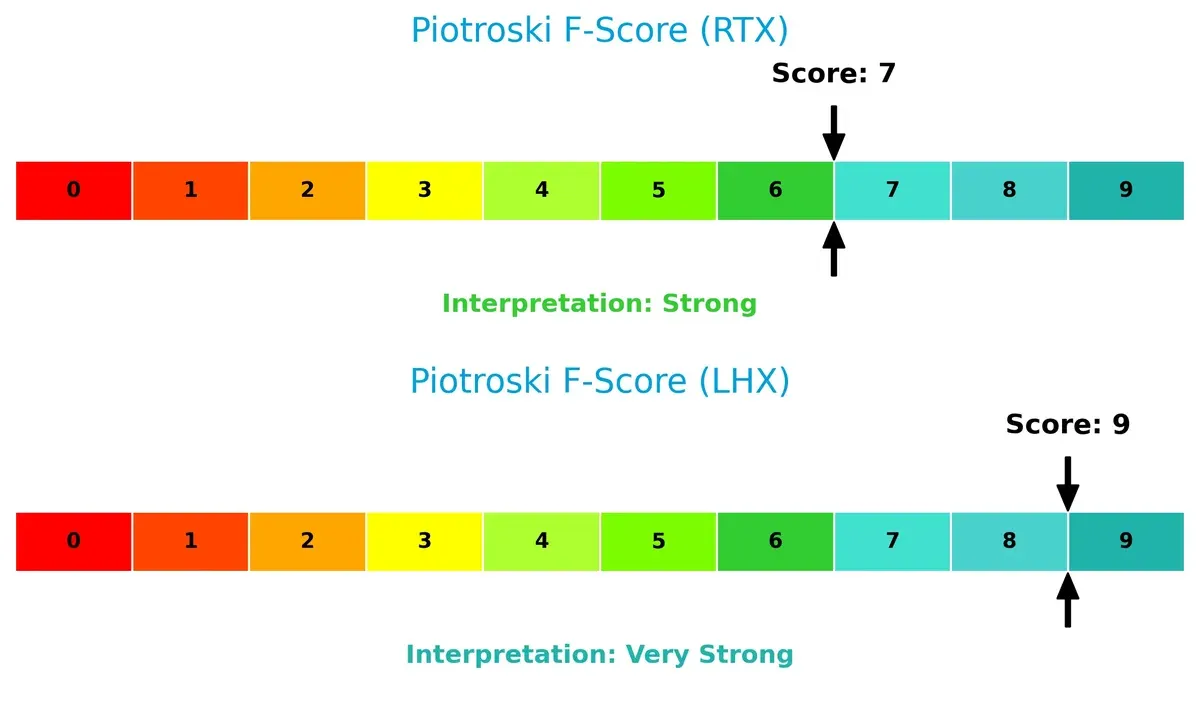
LHX demonstrates superior operational quality and efficiency, reflecting robust profitability and balance sheet management. RTX’s score, while respectable, suggests some internal red flags that warrant closer monitoring.
How are the two companies positioned?
This section dissects the operational DNA of RTX and LHX by comparing their revenue distribution and internal dynamics. The goal is to confront their economic moats and identify the most resilient competitive advantage today.
Revenue Segmentation: The Strategic Mix
This visual comparison dissects how RTX Corporation and L3Harris Technologies diversify their income streams and reveals where their primary sector bets lie:
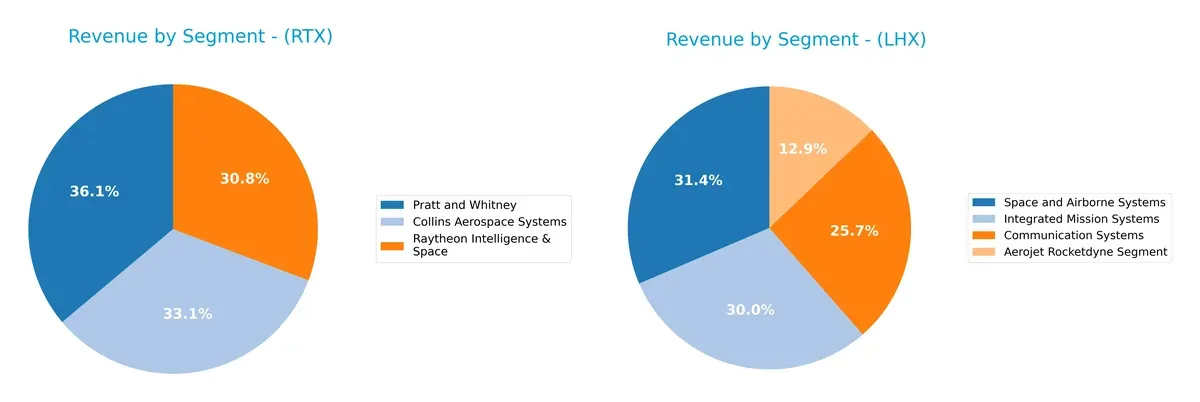
RTX anchors its revenue in three massive segments: Pratt and Whitney at $33B, Collins Aerospace at $30B, and Raytheon Intelligence & Space at $28B. This reflects a well-balanced aerospace and defense ecosystem, spreading risk across propulsion, avionics, and intelligence. L3Harris, by contrast, pivots on a more even four-segment mix, with Space and Airborne Systems leading at $6.9B. L3Harris’s diversification within communication and mission systems mitigates concentration risk but lacks RTX’s scale dominance.
Strengths and Weaknesses Comparison
This table compares the Strengths and Weaknesses of RTX Corporation and L3Harris Technologies, Inc.:
RTX Strengths
- Diversified revenue across Collins Aerospace, Raytheon Intelligence & Space, and Pratt and Whitney
- Favorable WACC and debt-to-assets ratio
- Strong fixed asset turnover
- Slightly favorable overall ratios
LHX Strengths
- Diversified segments including Communication Systems and Space and Airborne Systems
- Favorable quick ratio and fixed asset turnover
- Slightly favorable overall financial ratios
RTX Weaknesses
- Unfavorable PE and PB ratios suggest valuation concerns
- Quick ratio below 1 signals liquidity risk
- Neutral profitability metrics with no strong margin leadership
LHX Weaknesses
- Lower ROE than RTX signals less efficient equity use
- Unfavorable PE ratio
- Interest coverage ratio is neutral, showing moderate debt service capacity
RTX shows broad diversification with solid operational efficiency but faces valuation and liquidity concerns. LHX maintains segment diversity with better liquidity but lags on return metrics. Both companies carry slightly favorable financial profiles, implying stable but cautious strategic positioning.
The Moat Duel: Analyzing Competitive Defensibility
A structural moat is the only thing protecting long-term profits from the erosion of competition. Let’s examine how RTX and LHX defend their turf:
RTX Corporation: Diverse Aerospace Integration Moat
RTX leverages a broad aerospace portfolio combining engines, avionics, and defense systems. This manifests in stable margins and a growing ROIC trend. Expansion in global markets and advanced defense tech could deepen its moat in 2026.
L3Harris Technologies, Inc.: Specialized Mission Systems Moat
LHX focuses on mission-critical ISR and communication systems, a narrower moat than RTX’s diversified base. Its ROIC declines, signaling value destruction. Growth in space and cyber defense segments offers some upside, but competitive pressure looms.
Verdict: Diversification Moat vs. Niche Specialization Moat
RTX’s wider, integrated aerospace moat supports margin stability and increasing profitability. LHX’s specialization faces margin and ROIC headwinds. RTX is better equipped to defend market share amid evolving defense demands.
Which stock offers better returns?
The past year saw RTX Corporation and L3Harris Technologies, Inc. post strong gains with accelerating bullish trends and notable price appreciation.
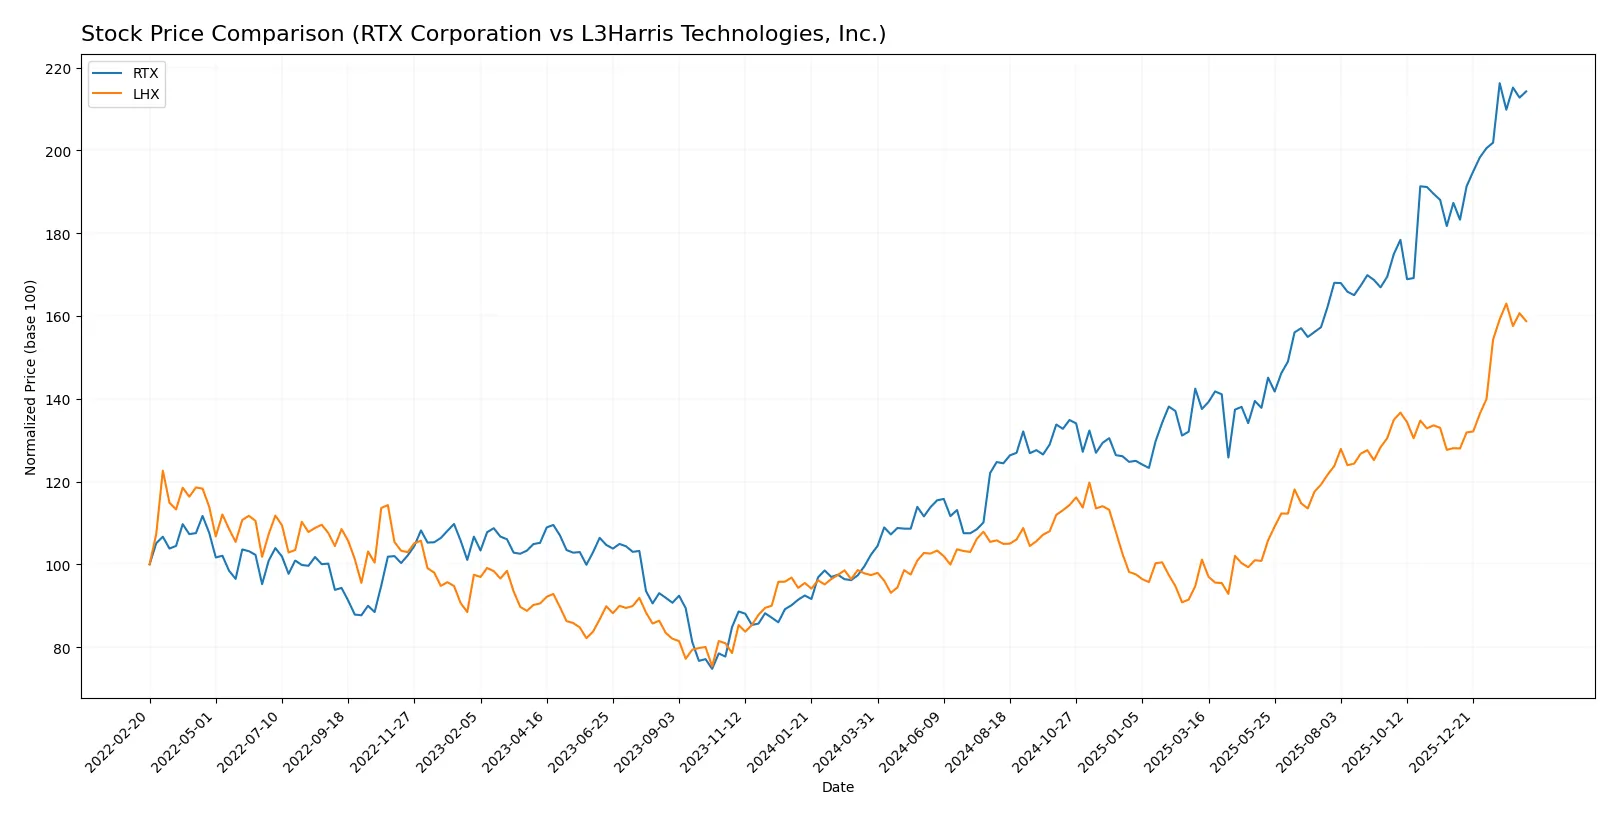
Trend Comparison
RTX Corporation’s stock rose 109.4% over the past 12 months, showing acceleration and a bullish trend from a low of 95.54 to a high near 202. Volatility measured by 28.09 std deviation.
L3Harris Technologies, Inc. gained 63.02% in the same period, also accelerating bullishly, reaching a high of 354.73 from a low of 197.61. It experienced higher volatility at 37.57 std deviation.
RTX outperformed LHX with a 109.4% return versus 63.02%, delivering the stronger overall market performance during this 12-month span.
Target Prices
Analysts project strong upside potential for both RTX Corporation and L3Harris Technologies, reflecting confidence in their aerospace and defense market positions.
| Company | Target Low | Target High | Consensus |
|---|---|---|---|
| RTX Corporation | 168 | 235 | 214.7 |
| L3Harris Technologies, Inc. | 323 | 367 | 352.25 |
The consensus targets for RTX and LHX stand notably above current prices, indicating bullish analyst sentiment. RTX trades near $200, well below its $214.7 consensus target, while LHX’s $345.5 price lags behind its $352.25 consensus, signaling potential gains.

Don’t Let Luck Decide Your Entry Point
Optimize your entry points with our advanced ProRealTime indicators. You’ll get efficient buy signals with precise price targets for maximum performance. Start outperforming now!
How do institutions grade them?
The following tables summarize the recent grades assigned to RTX Corporation and L3Harris Technologies, Inc. by reputable investment firms:
RTX Corporation Grades
This table shows the latest ratings from recognized financial institutions for RTX Corporation.
| Grading Company | Action | New Grade | Date |
|---|---|---|---|
| Citigroup | Maintain | Buy | 2026-02-05 |
| UBS | Maintain | Neutral | 2026-01-28 |
| RBC Capital | Maintain | Outperform | 2026-01-28 |
| JP Morgan | Maintain | Overweight | 2026-01-28 |
| Citigroup | Maintain | Buy | 2026-01-13 |
| UBS | Downgrade | Neutral | 2026-01-05 |
| JP Morgan | Maintain | Overweight | 2025-12-19 |
| B of A Securities | Maintain | Buy | 2025-10-27 |
| UBS | Maintain | Buy | 2025-10-22 |
| Susquehanna | Maintain | Positive | 2025-10-22 |
L3Harris Technologies, Inc. Grades
This table displays the recent evaluations from established grading firms for L3Harris Technologies, Inc.
| Grading Company | Action | New Grade | Date |
|---|---|---|---|
| Citigroup | Maintain | Buy | 2026-02-05 |
| JP Morgan | Maintain | Overweight | 2026-02-05 |
| Morgan Stanley | Maintain | Overweight | 2026-02-02 |
| RBC Capital | Maintain | Sector Perform | 2026-01-30 |
| UBS | Maintain | Neutral | 2026-01-15 |
| RBC Capital | Maintain | Sector Perform | 2026-01-14 |
| Citigroup | Maintain | Buy | 2026-01-13 |
| Morgan Stanley | Upgrade | Overweight | 2025-12-16 |
| JP Morgan | Maintain | Overweight | 2025-11-04 |
| UBS | Maintain | Neutral | 2025-10-31 |
Which company has the best grades?
RTX Corporation receives a broader range of positive grades including multiple “Buy” and “Outperform” ratings, while L3Harris mostly earns “Overweight” and “Neutral” grades. RTX’s stronger consensus may offer investors a more optimistic outlook but also demands scrutiny of underlying fundamentals.
Risks specific to each company
The following categories identify the critical pressure points and systemic threats facing both firms in the 2026 market environment:
1. Market & Competition
RTX Corporation
- Faces intense competition from diversified aerospace and defense giants, with pressure on innovation and military contracts.
L3Harris Technologies, Inc.
- Operates in niche aerospace tech markets, facing competitive pressure in ISR and communication systems but with specialized product lines.
2. Capital Structure & Debt
RTX Corporation
- Maintains moderate leverage (D/E 0.63) with favorable interest coverage (5.77x); manageable debt-to-assets ratio at 24%.
L3Harris Technologies, Inc.
- Slightly lower leverage (D/E 0.53) with neutral interest coverage (4.24x); debt-to-assets at 25.35%, reflecting balanced capital structure.
3. Stock Volatility
RTX Corporation
- Exhibits low beta (0.42), indicating lower market volatility and defensive characteristics.
L3Harris Technologies, Inc.
- Displays moderate beta (0.64), suggesting higher sensitivity to market swings and risk.
4. Regulatory & Legal
RTX Corporation
- Subject to stringent aerospace and defense regulations; risks from government contract renewals and export controls.
L3Harris Technologies, Inc.
- Faces similar regulatory scrutiny, especially on classified intel and cyber defense systems, with potential export and compliance risks.
5. Supply Chain & Operations
RTX Corporation
- Complex global supply chains vulnerable to geopolitical disruptions, raw material price spikes, and labor challenges.
L3Harris Technologies, Inc.
- Relies on specialized component suppliers; supply chain risks include tech sourcing and potential bottlenecks in ISR hardware production.
6. ESG & Climate Transition
RTX Corporation
- Increasing pressure to reduce carbon footprint in aerospace manufacturing; ESG initiatives critical for contract eligibility.
L3Harris Technologies, Inc.
- ESG focus growing, especially around sustainable tech and electronic waste; climate transition could impact operational costs.
7. Geopolitical Exposure
RTX Corporation
- Significant exposure to U.S. and allied military budgets; vulnerable to shifts in defense spending and international tensions.
L3Harris Technologies, Inc.
- Global operations sensitive to geopolitical risks, particularly in ISR markets and defense communications amid rising global conflicts.
Which company shows a better risk-adjusted profile?
RTX’s most impactful risk lies in its broad market competition and complex supply chain, potentially straining margins. L3Harris faces higher stock volatility and niche regulatory risks but benefits from a stronger Piotroski score and slightly better liquidity. L3Harris’s higher quick ratio (1.02 vs. 0.8) supports greater short-term resilience. Overall, L3Harris displays a marginally better risk-adjusted profile, bolstered by stronger financial health metrics despite its niche vulnerabilities.
Final Verdict: Which stock to choose?
RTX Corporation’s superpower lies in its accelerating profitability and robust income growth, signaling improving operational efficiency. Its point of vigilance is the slightly stretched valuation multiples, which could temper near-term upside. RTX suits investors seeking aggressive growth with an appetite for cyclical aerospace expansion.
L3Harris Technologies commands a strategic moat through its higher-quality assets and stronger free cash flow yield, offering more stable financial footing. Its steady operational metrics and better liquidity profile suggest a safer harbor compared to RTX. LHX fits well in a GARP portfolio focused on quality growth balanced with risk control.
If you prioritize dynamic earnings growth and rising profitability, RTX is the compelling choice due to its accelerating income momentum and expanding returns. However, if you seek better stability and stronger cash flow fundamentals, LHX offers superior financial resilience and a more conservative risk profile. Both present slightly favorable scenarios, but your investor profile should guide the preference.
Disclaimer: Investment carries a risk of loss of initial capital. The past performance is not a reliable indicator of future results. Be sure to understand risks before making an investment decision.
Go Further
I encourage you to read the complete analyses of RTX Corporation and L3Harris Technologies, Inc. to enhance your investment decisions: