Home > Comparison > Industrials > NOC vs LHX
The strategic rivalry between Northrop Grumman Corporation and L3Harris Technologies defines the aerospace & defense sector’s evolution. Northrop Grumman operates as a diversified industrial giant with broad capabilities in aerospace systems, defense weapons, and space technologies. L3Harris focuses on high-tech mission-critical communication and surveillance systems. This analysis examines which company’s operational model offers superior risk-adjusted returns, guiding investors seeking durable sector leadership and innovation resilience.
Table of contents
Companies Overview
Northrop Grumman and L3Harris Technologies both hold critical roles in the aerospace and defense industry, shaping global security dynamics.
Northrop Grumman Corporation: Aerospace & Defense Powerhouse
Northrop Grumman dominates the aerospace and defense sector with a broad portfolio spanning Aeronautics, Defense Systems, Mission Systems, and Space Systems. Its core revenue stems from designing and manufacturing advanced aircraft, missile defense, cyber solutions, and space payloads. In 2026, the company focuses on integrating hypersonic propulsion and enhancing ISR (intelligence, surveillance, reconnaissance) capabilities to maintain strategic superiority.
L3Harris Technologies, Inc.: Integrated Mission Innovator
L3Harris Technologies specializes in mission-critical aerospace and defense technology with strong emphasis on Integrated Mission Systems, Space and Airborne Systems, Communication Systems, and Aviation Systems. Its revenue engine revolves around sophisticated ISR platforms, tactical communication networks, and electronic warfare solutions. The 2026 strategy prioritizes expanding secure mobile communications and autonomous maritime systems to strengthen multi-domain operational readiness.
Strategic Collision: Similarities & Divergences
Both firms operate within aerospace and defense, but Northrop Grumman pursues a broad, integrated platform approach, while L3Harris favors specialized, network-centric solutions. They compete intensely in ISR and electronic warfare markets, a key battleground for government contracts. Northrop Grumman’s scale and diverse product lines contrast with L3Harris’s focused innovation-driven profile, shaping distinct risk and growth dynamics for investors.
Income Statement Comparison
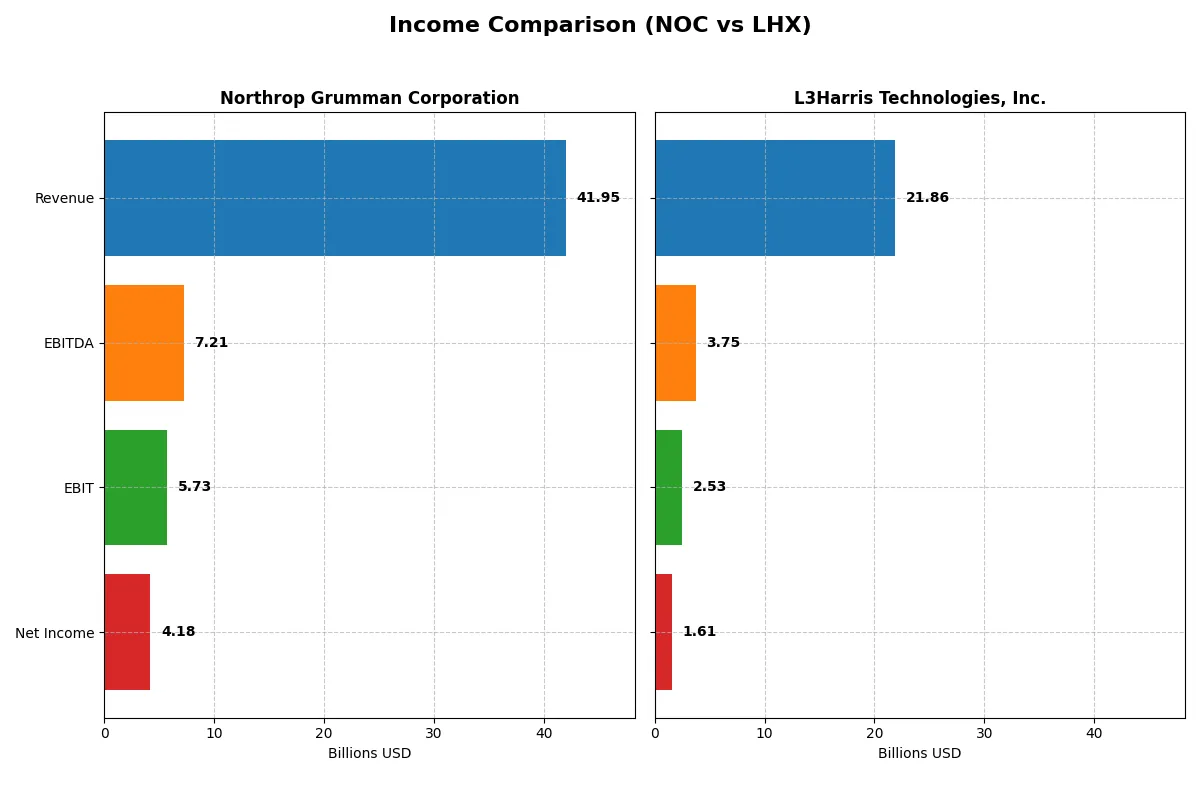
This data dissects the core profitability and scalability of both corporate engines to reveal who dominates the bottom line:
| Metric | Northrop Grumman Corporation (NOC) | L3Harris Technologies, Inc. (LHX) |
|---|---|---|
| Revenue | 41.95B | 21.87B |
| Cost of Revenue | 33.64B | 16.24B |
| Operating Expenses | 4.03B | 3.43B |
| Gross Profit | 8.31B | 5.63B |
| EBITDA | 7.21B | 3.75B |
| EBIT | 5.73B | 2.53B |
| Interest Expense | 665M | 597M |
| Net Income | 4.18B | 0 |
| EPS | 29.14 | 8.57 |
| Fiscal Year | 2025 | 2025 |
Income Statement Analysis: The Bottom-Line Duel
This income statement comparison exposes which company operates its corporate engine with superior efficiency and margin discipline through recent fiscal years.
Northrop Grumman Corporation Analysis
Northrop Grumman’s revenue climbed steadily from $35.7B in 2021 to $41.95B in 2025, marking a 17.6% growth overall. Net income, however, fell sharply from $7B to $4.18B over the same period, dragging net margin down to 9.97%. Despite a slight revenue dip in gross profit (-0.6%), EBIT margin remains favorable at 13.7%, showing operational resilience in 2025.
L3Harris Technologies, Inc. Analysis
L3Harris increased revenue from $17.8B in 2021 to $21.86B in 2025, a 22.7% boost. Gross margin outperforms Northrop at 25.7%, supporting a solid EBIT margin of 11.6%. Net income declined less severely, to $1.61B in 2025, with a net margin of 7.35%. The firm’s 18.6% gross profit jump in the last year signals improving top-line efficiency and momentum.
Margin Strength vs. Earnings Scale
Northrop Grumman leads in absolute earnings and EBIT margin, reflecting robust operational scale and cost control. L3Harris boasts superior gross margin percentages and faster recent profit growth, indicating a leaner cost structure. For investors prioritizing scale and stable EBIT returns, Northrop holds appeal. Those favoring margin expansion and improving profitability trends may find L3Harris more compelling.
Financial Ratios Comparison
These vital ratios act as a diagnostic tool to expose the underlying fiscal health, valuation premiums, and capital efficiency of the companies compared:
| Ratios | Northrop Grumman Corporation (NOC) | L3Harris Technologies, Inc. (LHX) |
|---|---|---|
| ROE | 25.1% | 8.2% |
| ROIC | 9.9% | 5.4% |
| P/E | 19.6 | 34.3 |
| P/B | 4.91 | 2.80 |
| Current Ratio | 1.10 | 1.19 |
| Quick Ratio | 1.10 | 1.02 |
| D/E (Debt-to-Equity) | 0.11 | 0.53 |
| Debt-to-Assets | 3.6% | 25.4% |
| Interest Coverage | -6.78 | 3.68 |
| Asset Turnover | 0.82 | 0.53 |
| Fixed Asset Turnover | 3.27 | 8.20 |
| Payout Ratio | 30.9% | 56.2% |
| Dividend Yield | 1.58% | 1.64% |
| Fiscal Year | 2025 | 2025 |
Efficiency & Valuation Duel: The Vital Signs
Financial ratios serve as a company’s DNA, uncovering hidden risks and revealing operational efficiency and valuation clarity.
Northrop Grumman Corporation
Northrop Grumman displays strong profitability with a favorable 25.08% ROE and a neutral 9.97% net margin. Its P/E ratio of 19.57 suggests a fairly valued stock, while a high P/B of 4.91 signals some premium pricing. The company balances shareholder returns with a 1.58% dividend yield and reinvests in operational efficiency, as evidenced by solid fixed asset turnover.
L3Harris Technologies, Inc.
L3Harris posts a modest 8.18% ROE and a neutral 7.35% net margin, reflecting less robust profitability. The stock appears expensive with a high P/E of 34.26, despite a moderate P/B of 2.8. Dividend yield of 1.64% offers some income appeal, but reinvestment focus is less clear. Efficiency metrics like fixed asset turnover stand out, though risk metrics are mixed.
Balanced Profitability Meets Valuation Discipline
Northrop Grumman offers a better risk-reward balance with higher profitability and reasonable valuation versus L3Harris’s stretched P/E and weaker returns. Investors prioritizing operational strength may lean toward Northrop, while those seeking growth with higher risk might consider L3Harris’s profile.
Which one offers the Superior Shareholder Reward?
I compare Northrop Grumman (NOC) and L3Harris (LHX) on dividends and buybacks for 2025. NOC yields 1.58% with a 31% payout, sustaining dividends via 70% FCF coverage and moderate buybacks. LHX offers a 1.64% yield but pays 56% of earnings, supported by 86% FCF coverage and robust buybacks. Historically, LHX’s higher payout and buybacks boost total return but risk sustainability if cash flow dips. NOC’s conservative payout and solid buybacks provide steadier long-term value. I favor NOC for more sustainable shareholder rewards in 2026.
Comparative Score Analysis: The Strategic Profile
The radar chart reveals the fundamental DNA and trade-offs of both firms, highlighting their financial strengths and weaknesses across key metrics:
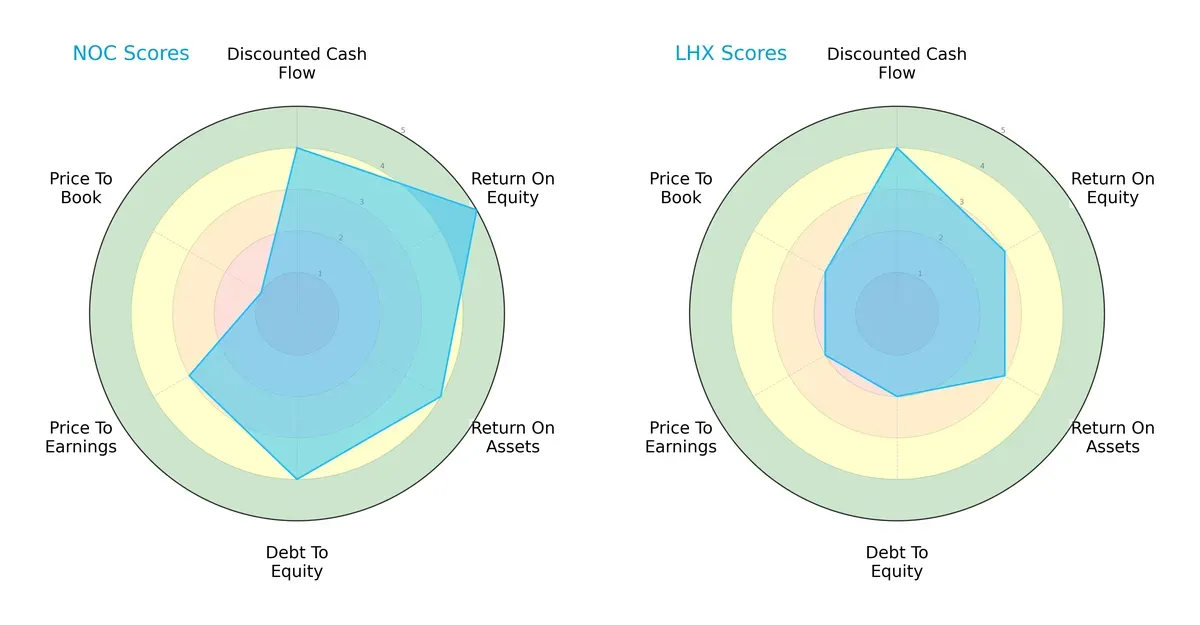
Northrop Grumman (NOC) demonstrates a more balanced profile with strong returns on equity (5) and assets (4), and solid debt management (4). L3Harris (LHX) relies more on discounted cash flow (4) but lags in profitability (ROE 3, ROA 3) and carries higher financial risk (Debt/Equity 2). NOC’s very low price-to-book score (1) signals valuation concerns, while LHX maintains moderate valuation scores.
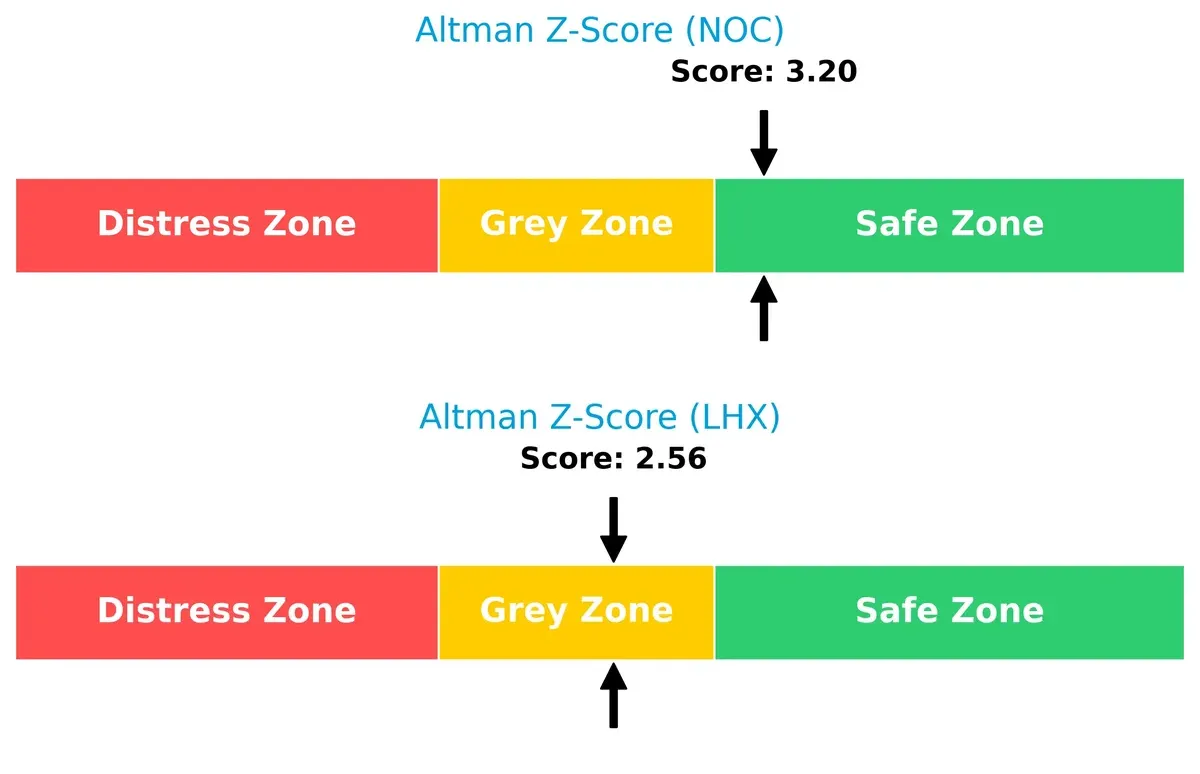
Bankruptcy Risk: Solvency Showdown
NOC’s Altman Z-Score at 3.2 places it comfortably in the safe zone, while LHX scores 2.56, landing in the grey zone. This delta suggests NOC has a stronger buffer against financial distress in today’s cycle:
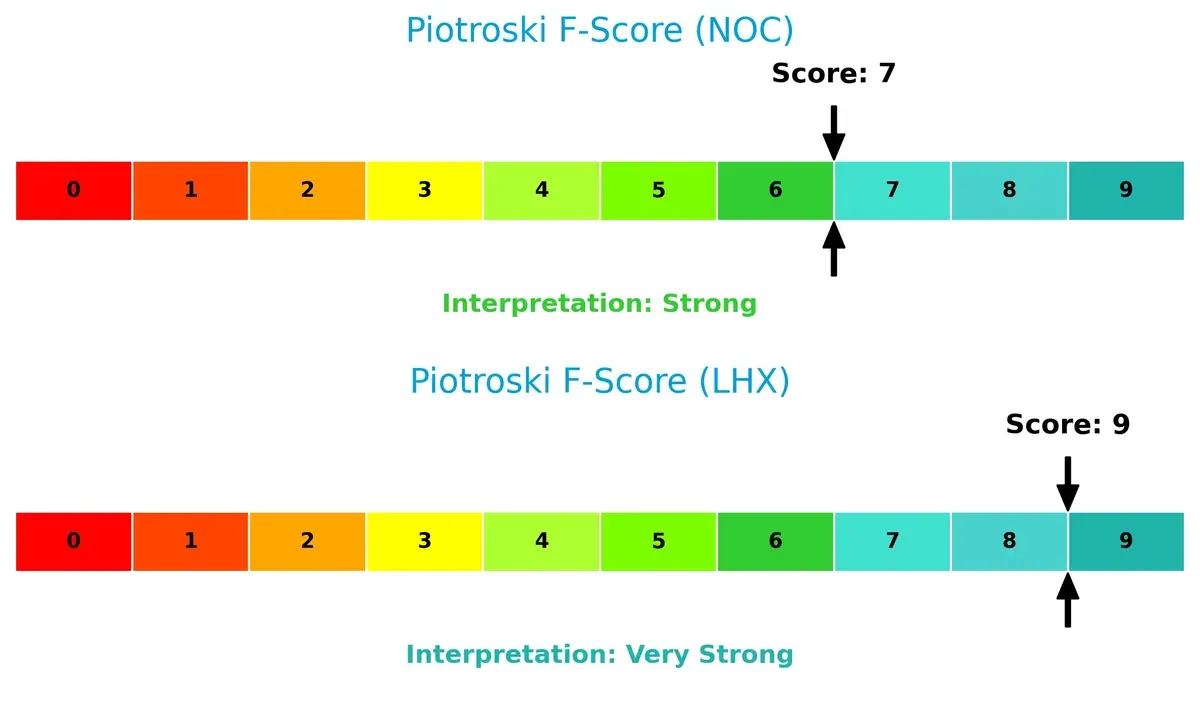
Financial Health: Quality of Operations
LHX edges ahead with a Piotroski F-Score of 9, indicating very strong operational quality and internal financial health. NOC’s score of 7 is strong but reveals some room for improvement in internal metrics:
How are the two companies positioned?
This section dissects the operational DNA of Northrop Grumman and L3Harris by comparing their revenue distribution and internal dynamics. The goal is to confront their economic moats and identify which model offers the most resilient competitive advantage today.
Revenue Segmentation: The Strategic Mix
This visual comparison dissects how Northrop Grumman and L3Harris diversify their income streams and where their primary sector bets lie:
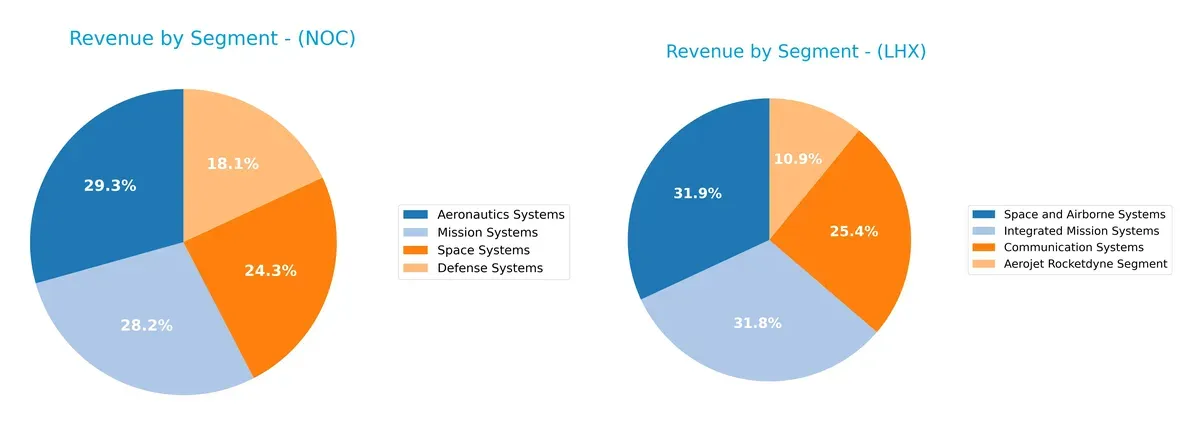
Northrop Grumman’s revenue spreads across four major segments: Aeronautics Systems ($13B), Mission Systems ($12.5B), Space Systems ($10.8B), and Defense Systems ($8B), showing balanced diversification. L3Harris leans more heavily on Integrated Mission Systems ($6.8B) and Space and Airborne Systems ($6.9B), with Communication Systems trailing at $5.5B. Northrop’s mix anchors on broad aerospace and defense domains, reducing concentration risk. L3Harris pivots around mission-critical communications and integrated solutions, indicating stronger ecosystem lock-in but higher segment dependence.
Strengths and Weaknesses Comparison
This table compares the Strengths and Weaknesses of Northrop Grumman Corporation and L3Harris Technologies, Inc.:
Northrop Grumman Corporation Strengths
- Diversified revenue across Aeronautics, Defense, Mission, and Space Systems
- Strong ROE at 25.08%
- Low debt-to-assets ratio at 3.61%
- Favorable WACC at 4.51%
- High fixed asset turnover at 3.27
L3Harris Technologies, Inc. Strengths
- Favorable WACC at 6.6%
- Growing Space and Airborne Systems segment
- Favorable fixed asset turnover at 8.2
- Moderate debt-to-assets at 25.35%
- Neutral to favorable liquidity ratios
Northrop Grumman Corporation Weaknesses
- High price-to-book ratio at 4.91 indicating potential overvaluation
- Neutral net margin at 9.97%
- Limited geographic revenue outside the U.S.
- Neutral asset turnover at 0.82
L3Harris Technologies, Inc. Weaknesses
- Unfavorable ROE at 8.18%
- High price-to-earnings ratio at 34.26
- Neutral interest coverage at 4.24
- Moderate debt-to-equity at 0.53
- Net margin lower at 7.35%
Northrop Grumman’s strengths lie in diversified segments and strong capital efficiency, though its valuation and geographic concentration raise caution. L3Harris shows operational efficiency but faces profitability and valuation challenges, impacting financial flexibility.
The Moat Duel: Analyzing Competitive Defensibility
A structural moat is the only reliable shield protecting long-term profits from relentless competitive erosion in aerospace and defense:
Northrop Grumman Corporation: Integrated Systems Moat
I see Northrop’s moat rooted in its diversified mission systems and aerospace integration. High ROIC above WACC confirms efficient capital use despite a declining trend. New space payloads and hypersonic tech may deepen this edge in 2026.
L3Harris Technologies, Inc.: Specialized Communications Moat
L3Harris leans on niche communication and ISR systems, contrasting Northrop’s broad aerospace scope. However, its negative ROIC spread signals value destruction. Growth in tactical SATCOM and cyber defense offers upside but risks remain elevated.
Verdict: Diversified Integration vs. Niche Specialization
Northrop Grumman holds a wider and more durable moat with positive value creation, while L3Harris struggles with declining profitability. Northrop is better positioned to defend and expand its market share in 2026.
Which stock offers better returns?
Both Northrop Grumman Corporation and L3Harris Technologies show strong bullish trends over the past year, with significant price appreciation and accelerating momentum.
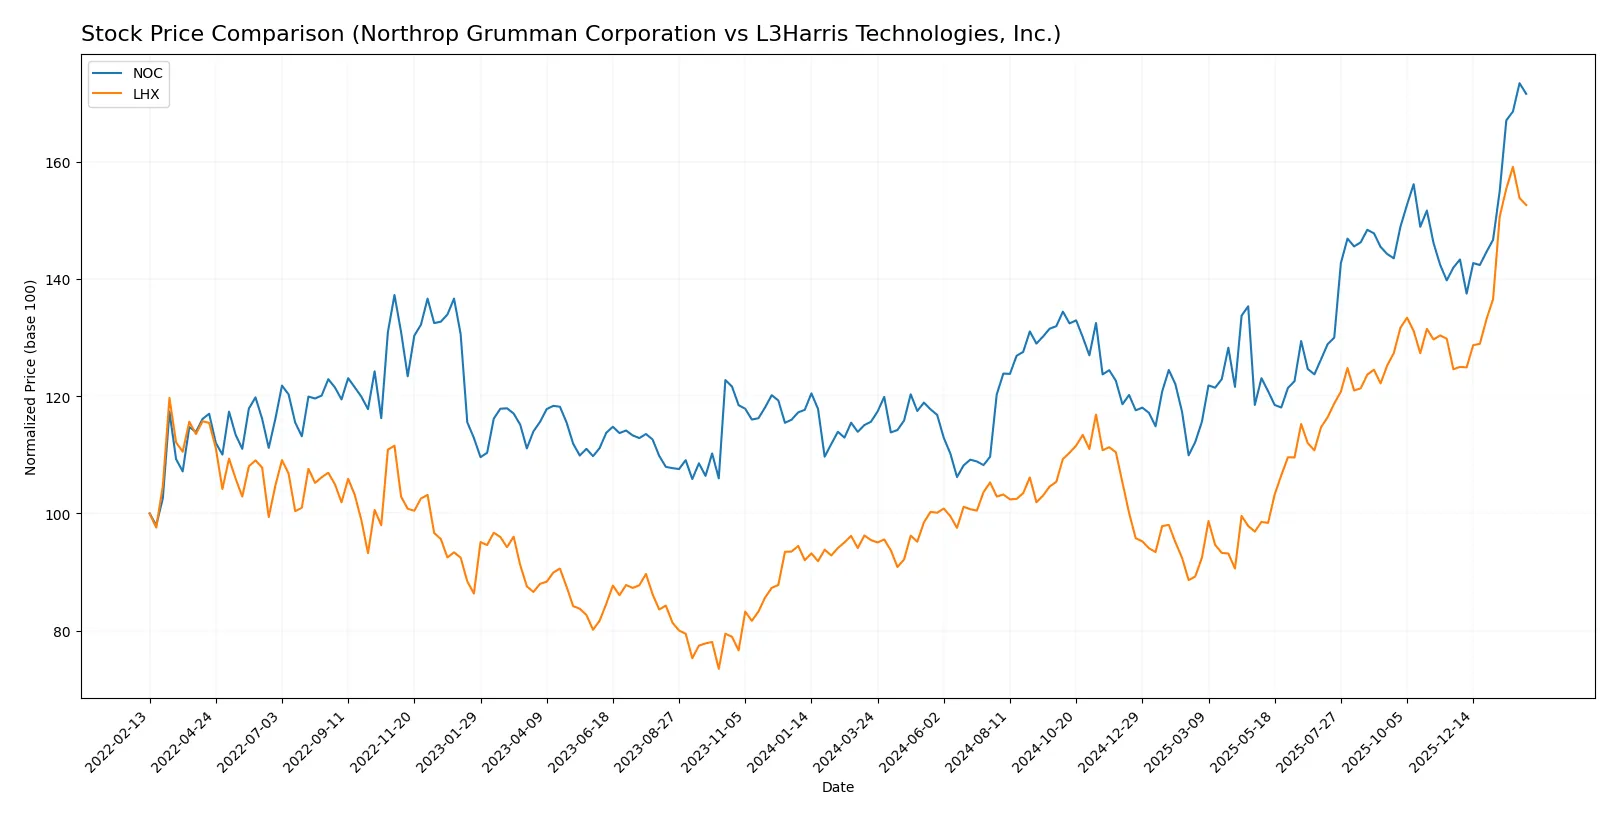
Trend Comparison
Northrop Grumman’s stock rose 48.35% over 12 months, showing acceleration and hitting a high of 692.26. Volatility is high with a 59.67 standard deviation.
L3Harris gained 59.84% in the same period, also accelerating, reaching 354.73. Its volatility is lower at 36.17 standard deviation, indicating steadier gains.
L3Harris outperformed Northrop Grumman in total price appreciation, delivering the highest market returns over the past year.
Target Prices
Analysts show a confident price range for these aerospace and defense leaders, reflecting solid growth expectations.
| Company | Target Low | Target High | Consensus |
|---|---|---|---|
| Northrop Grumman Corporation | 623 | 815 | 732.25 |
| L3Harris Technologies, Inc. | 323 | 367 | 352.25 |
The consensus targets for Northrop Grumman and L3Harris stand roughly 7% and 3.5% above current prices, signaling modest upside potential. Analysts expect steady performance aligned with sector trends.

Don’t Let Luck Decide Your Entry Point
Optimize your entry points with our advanced ProRealTime indicators. You’ll get efficient buy signals with precise price targets for maximum performance. Start outperforming now!
How do institutions grade them?
Here is a summary of the recent institutional grades assigned to Northrop Grumman Corporation and L3Harris Technologies, Inc.:
Northrop Grumman Corporation Grades
The following table shows recent grades from reputable grading firms for Northrop Grumman:
| Grading Company | Action | New Grade | Date |
|---|---|---|---|
| B of A Securities | Maintain | Buy | 2026-01-28 |
| BTIG | Maintain | Buy | 2026-01-28 |
| UBS | Maintain | Buy | 2026-01-28 |
| RBC Capital | Maintain | Outperform | 2026-01-28 |
| Citigroup | Maintain | Buy | 2026-01-28 |
| UBS | Maintain | Buy | 2026-01-15 |
| Citigroup | Maintain | Buy | 2026-01-13 |
| Truist Securities | Downgrade | Hold | 2026-01-09 |
| Morgan Stanley | Maintain | Overweight | 2025-12-16 |
| Alembic Global | Upgrade | Overweight | 2025-12-15 |
L3Harris Technologies, Inc. Grades
Below are the recent grades from recognized institutions for L3Harris Technologies:
| Grading Company | Action | New Grade | Date |
|---|---|---|---|
| Morgan Stanley | Maintain | Overweight | 2026-02-02 |
| RBC Capital | Maintain | Sector Perform | 2026-01-30 |
| UBS | Maintain | Neutral | 2026-01-15 |
| RBC Capital | Maintain | Sector Perform | 2026-01-14 |
| Citigroup | Maintain | Buy | 2026-01-13 |
| Morgan Stanley | Upgrade | Overweight | 2025-12-16 |
| JP Morgan | Maintain | Overweight | 2025-11-04 |
| UBS | Maintain | Neutral | 2025-10-31 |
| Truist Securities | Maintain | Buy | 2025-10-15 |
| Morgan Stanley | Maintain | Equal Weight | 2025-10-15 |
Which company has the best grades?
Northrop Grumman consistently receives buy and outperform ratings from top firms, with few downgrades. L3Harris shows a mix of overweight and sector perform grades. Investors may perceive Northrop Grumman as more favorably rated overall, possibly impacting confidence and valuation expectations.
Risks specific to each company
The following categories identify the critical pressure points and systemic threats facing both firms in the 2026 market environment:
1. Market & Competition
Northrop Grumman Corporation
- Dominates with diversified aerospace & defense products; faces intense innovation competition.
L3Harris Technologies, Inc.
- Competes in niche ISR and communication systems; higher market beta indicates more sensitivity to sector swings.
2. Capital Structure & Debt
Northrop Grumman Corporation
- Strong balance sheet with low debt-to-equity (0.11) and high-interest coverage (8.62).
L3Harris Technologies, Inc.
- Moderate leverage (debt-to-equity 0.53) with lower interest coverage (4.24) signals higher financial risk.
3. Stock Volatility
Northrop Grumman Corporation
- Extremely low beta (0.039) indicates stock stability and defensive positioning.
L3Harris Technologies, Inc.
- Higher beta (0.64) implies greater price volatility and market sensitivity.
4. Regulatory & Legal
Northrop Grumman Corporation
- Exposure to government contract regulations; potential program delays pose legal risks.
L3Harris Technologies, Inc.
- Similar regulatory environment with added complexity from classified intelligence contracts.
5. Supply Chain & Operations
Northrop Grumman Corporation
- Complex global supply chains for aerospace systems; susceptible to raw material cost fluctuations.
L3Harris Technologies, Inc.
- Relies heavily on specialized ISR components; supply disruptions could impact delivery schedules.
6. ESG & Climate Transition
Northrop Grumman Corporation
- Moderate ESG focus; increasing pressure to meet carbon reduction in aerospace manufacturing.
L3Harris Technologies, Inc.
- Advances in energy-efficient communication tech but faces scrutiny on emissions in defense manufacturing.
7. Geopolitical Exposure
Northrop Grumman Corporation
- High dependence on U.S. defense budget; geopolitical tensions influence contract pipeline.
L3Harris Technologies, Inc.
- Similar U.S. government reliance with added sensitivity to global ISR deployment politics.
Which company shows a better risk-adjusted profile?
Northrop Grumman’s strongest risk lies in regulatory and supply chain complexity, while L3Harris faces elevated financial leverage and market volatility. Despite L3Harris’s very strong Piotroski score, Northrop Grumman’s low debt and stable stock beta underpin a better risk-adjusted profile. The stark difference in debt-to-equity ratios (0.11 vs. 0.53) justifies caution over L3Harris’s financial flexibility.
Final Verdict: Which stock to choose?
Northrop Grumman’s superpower lies in its robust capital efficiency and strong return on equity, signaling disciplined management and value creation. A point of vigilance is its declining ROIC trend, suggesting profitability pressures ahead. It suits portfolios targeting steady, value-driven growth with moderate risk tolerance.
L3Harris stands out for its intangible asset moat and steady free cash flow yield, offering resilience through recurring revenues. Compared to Northrop, it carries higher leverage and a less impressive ROIC, which implies a more cautious risk profile. It fits well within portfolios favoring growth at a reasonable price with moderate volatility.
If you prioritize capital efficiency and proven value creation, Northrop Grumman is the compelling choice due to its superior ROE and safer leverage profile. However, if you seek steady cash flow and intangible asset strength with a tolerance for higher debt, L3Harris offers better growth potential, albeit with increased risk. Both present slightly favorable cases but cater to distinct investor profiles.
Disclaimer: Investment carries a risk of loss of initial capital. The past performance is not a reliable indicator of future results. Be sure to understand risks before making an investment decision.
Go Further
I encourage you to read the complete analyses of Northrop Grumman Corporation and L3Harris Technologies, Inc. to enhance your investment decisions: