Home > Comparison > Industrials > LMT vs LHX
The strategic rivalry between Lockheed Martin Corporation and L3Harris Technologies defines the current trajectory of the aerospace and defense sector. Lockheed Martin operates as a capital-intensive industrial giant with a broad portfolio spanning aeronautics, missiles, and space systems. In contrast, L3Harris focuses on high-tech mission-critical solutions, including integrated ISR and communication systems. This analysis will determine which company’s strategy offers superior risk-adjusted returns for a diversified portfolio.
Table of contents
Companies Overview
Lockheed Martin and L3Harris Technologies stand as pivotal players shaping the aerospace and defense landscape.
Lockheed Martin Corporation: Defense Industry Giant
Lockheed Martin dominates as a security and aerospace leader with $147B market cap. Its core revenue stems from manufacturing combat aircraft, missile systems, and space technologies, primarily serving the U.S. government. In 2026, Lockheed focuses sharply on integrating advanced missile defense and space-based intelligence, reinforcing its competitive edge in national security.
L3Harris Technologies, Inc.: Mission-Critical Innovator
L3Harris holds a $64B market cap, specializing in aerospace and defense technologies with a focus on integrated mission systems. Its revenue derives from ISR systems, tactical communications, and space payloads for government and commercial customers. The 2026 strategy emphasizes expanding cyber defense and electronic warfare capabilities alongside enhancing unmanned and satellite communications.
Strategic Collision: Similarities & Divergences
Both firms concentrate on aerospace and defense but differ fundamentally. Lockheed Martin pursues a broad, integrated defense platform, while L3Harris targets specialized mission systems and communications. Their main battleground is the defense technology market, competing over government contracts. Lockheed offers a large-scale, diversified portfolio; L3Harris presents a focused innovation-driven profile.
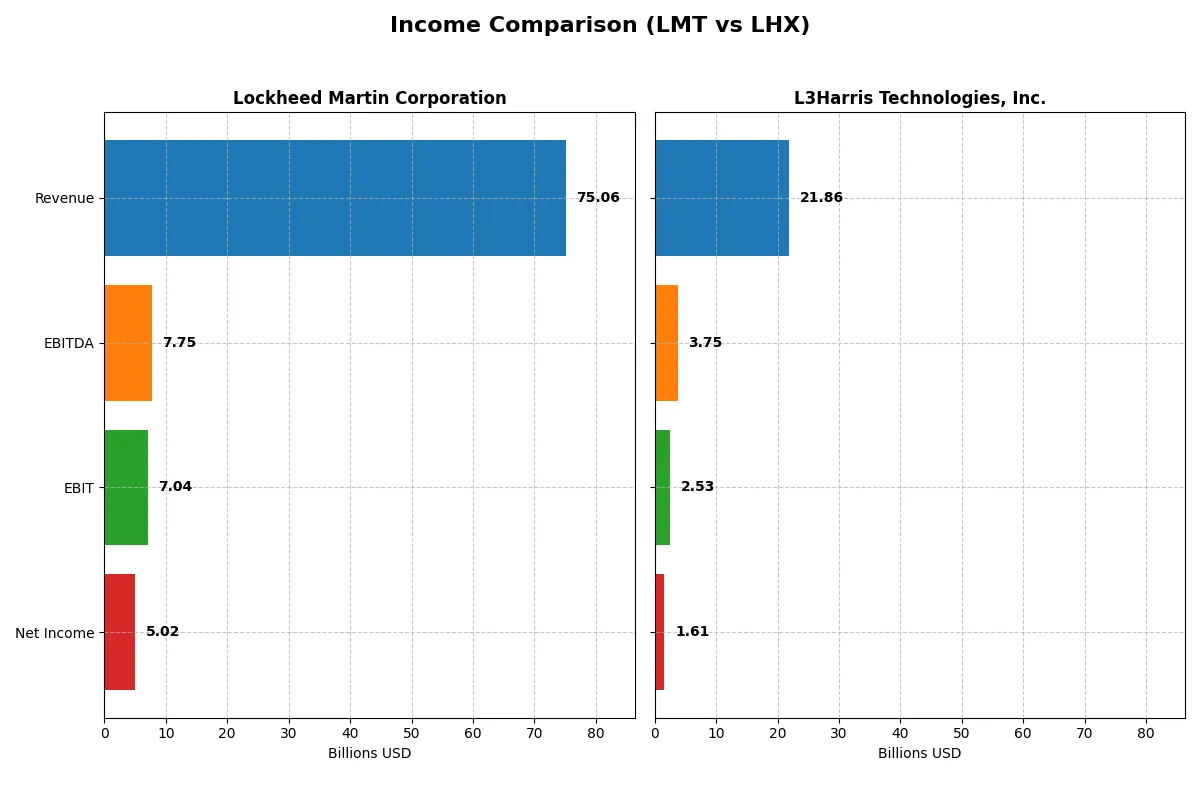
Income Statement Comparison
This data dissects the core profitability and scalability of both corporate engines to reveal who dominates the bottom line in the most recent fiscal year:
| Metric | Lockheed Martin Corporation (LMT) | L3Harris Technologies, Inc. (LHX) |
|---|---|---|
| Revenue | 75.06B | 21.87B |
| Cost of Revenue | 67.43B | 16.24B |
| Operating Expenses | -103M | 3.43B |
| Gross Profit | 7.62B | 5.63B |
| EBITDA | 7.75B | 3.75B |
| EBIT | 7.04B | 2.53B |
| Interest Expense | 1.12B | 597M |
| Net Income | 5.02B | 0 |
| EPS | 21.56 | 8.57 |
| Fiscal Year | 2025 | 2025 |
Income Statement Analysis: The Bottom-Line Duel
This income statement comparison reveals which company operates its business model with greater financial efficiency and profit resilience.
Lockheed Martin Corporation Analysis
Lockheed Martin’s revenue grew steadily from 67.0B in 2021 to 75.1B in 2025, but net income declined from 6.3B to 5.0B. Gross margins hovered around 10%, with net margins improving slightly to 6.7% in 2025. Despite top-line growth, EBIT and net margins weakened, signaling margin pressures and earnings contraction.
L3Harris Technologies, Inc. Analysis
L3Harris expanded revenue from 17.8B in 2021 to 21.9B in 2025, showing solid organic growth. Gross margins improved to 25.7%, and net margins reached 7.4%, both outperforming Lockheed Martin. EBIT and EPS both advanced in the latest year, reflecting stronger operational leverage and momentum.
Margin Strength vs. Earnings Scale
L3Harris delivers superior margin efficiency and earnings growth momentum, contrasting with Lockheed Martin’s larger scale but deteriorating profitability. For investors prioritizing margin quality and improving returns, L3Harris presents a more attractive financial profile. Lockheed Martin’s scale may appeal differently but faces headwinds in margin sustainability.
Financial Ratios Comparison
These vital ratios act as a diagnostic tool to expose the underlying fiscal health, valuation premiums, and capital efficiency of the companies compared below:
| Ratios | Lockheed Martin Corporation (LMT) | L3Harris Technologies, Inc. (LHX) |
|---|---|---|
| ROE | 74.65% | 8.18% |
| ROIC | 17.39% | 5.37% |
| P/E | 22.26 | 34.26 |
| P/B | 16.62 | 2.80 |
| Current Ratio | 1.09 | 1.19 |
| Quick Ratio | 0.94 | 1.02 |
| D/E (Debt-to-Equity) | 0.17 | 0.53 |
| Debt-to-Assets | 1.95% | 25.35% |
| Interest Coverage | 6.92 | 3.68 |
| Asset Turnover | 1.25 | 0.53 |
| Fixed Asset Turnover | 8.46 | 8.20 |
| Payout Ratio | 62.41% | 56.23% |
| Dividend Yield | 2.80% | 1.64% |
| Fiscal Year | 2025 | 2025 |
Efficiency & Valuation Duel: The Vital Signs
Financial ratios act as a company’s DNA, exposing hidden risks and operational excellence critical to investment decisions.
Lockheed Martin Corporation
Lockheed Martin shows a robust ROE of 74.65%, reflecting exceptional profitability and efficient capital use. Its P/E of 22.26 suggests a fair valuation, though a high P/B at 16.62 signals price premium. The firm delivers shareholder value with a 2.8% dividend yield, balancing returns and growth prudently.
L3Harris Technologies, Inc.
L3Harris posts a modest ROE of 8.18%, indicating limited profitability compared to peers. Its P/E of 34.26 signals an expensive stock, potentially stretched. The company offers a lower 1.64% dividend yield, with a cautious reinvestment approach given its neutral to slightly favorable ratio profile.
Premium Valuation vs. Operational Strength
Lockheed Martin balances strong profitability with a reasonable valuation, offering better risk-adjusted potential. L3Harris trades at a premium with weaker returns, fitting investors prioritizing growth over operational safety. The choice hinges on appetite for earnings power versus valuation stretch.
Which one offers the Superior Shareholder Reward?
Lockheed Martin (LMT) delivers a robust 2.8% dividend yield with a high payout ratio near 62%, supported by strong free cash flow coverage (~80%). Its buyback program is vigorous, enhancing total returns. L3Harris (LHX) pays a lower 1.6% dividend with a 56% payout ratio but reinvests more aggressively in growth. LMT’s distribution model combines income and capital return sustainably, making it the superior choice for total shareholder reward in 2026.
Comparative Score Analysis: The Strategic Profile
The radar chart reveals the fundamental DNA and trade-offs of Lockheed Martin and L3Harris Technologies, highlighting their strategic strengths and vulnerabilities:
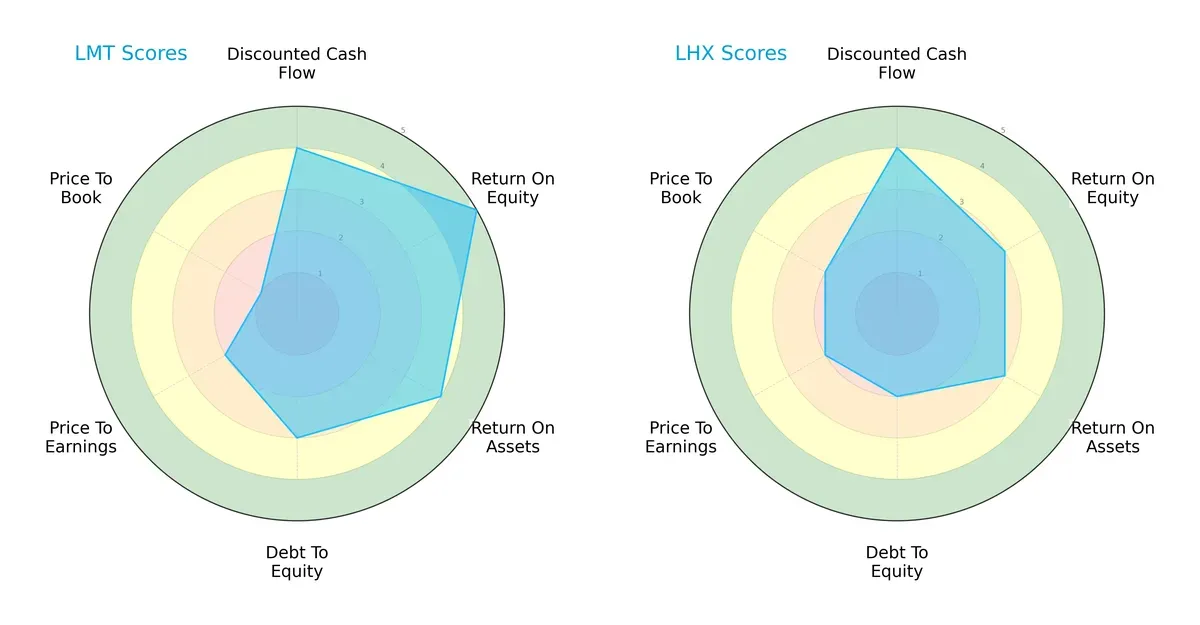
Lockheed Martin boasts superior ROE (5 vs. 3) and ROA (4 vs. 3) scores, demonstrating more efficient profit generation and asset utilization. L3Harris shows a slightly stronger valuation balance with better price-to-book scores (2 vs. 1). Both share equal DCF scores (4), but Lockheed Martin carries a moderate debt-to-equity advantage (3 vs. 2). Overall, Lockheed Martin presents a more balanced profile driven by operational efficiency, while L3Harris leans on valuation metrics for its edge.
Bankruptcy Risk: Solvency Showdown
Lockheed Martin’s Altman Z-Score of 3.69 places it comfortably in the safe zone, while L3Harris at 2.56 sits in the grey zone, suggesting higher bankruptcy risk:
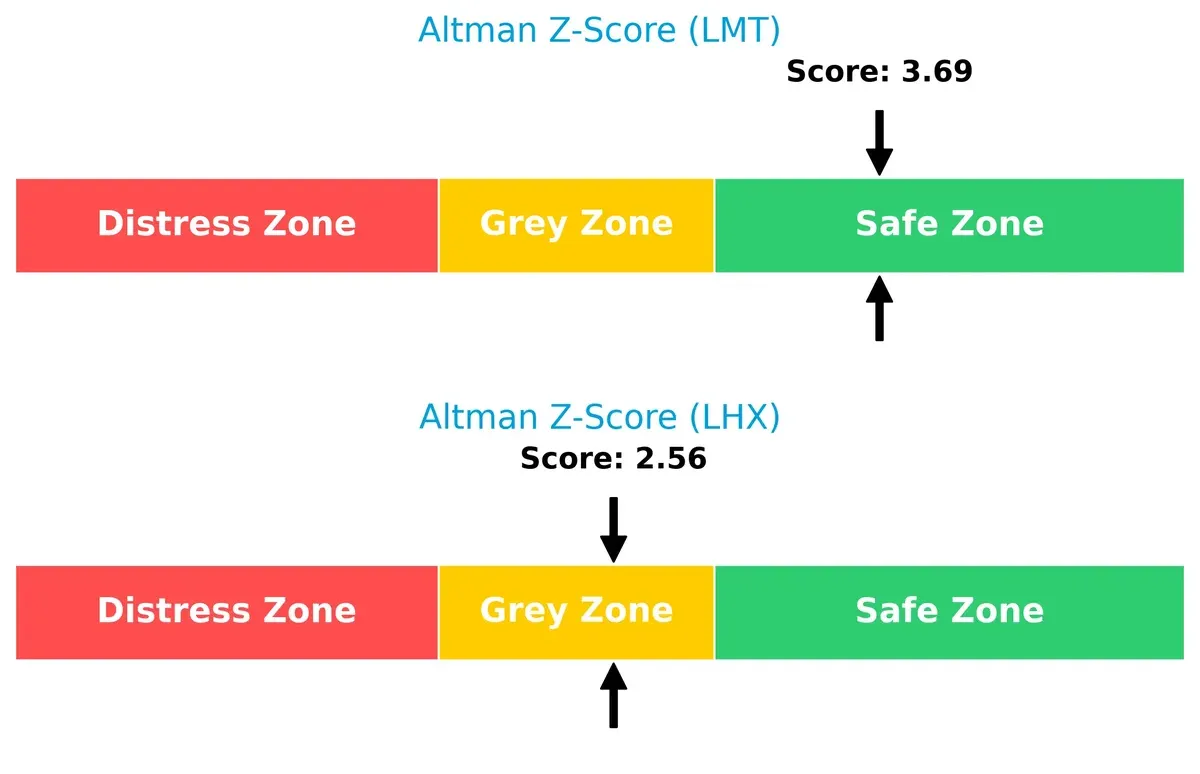
Lockheed Martin’s stronger score signals robust financial stability and survivability in economic downturns. L3Harris’s position in the grey zone warrants caution, as it faces moderate financial distress risk during the current market cycle.
Financial Health: Quality of Operations
L3Harris scores a near-perfect 9 on the Piotroski F-Score, indicating very strong financial health, compared to Lockheed Martin’s solid but lower 6, signaling average strength:
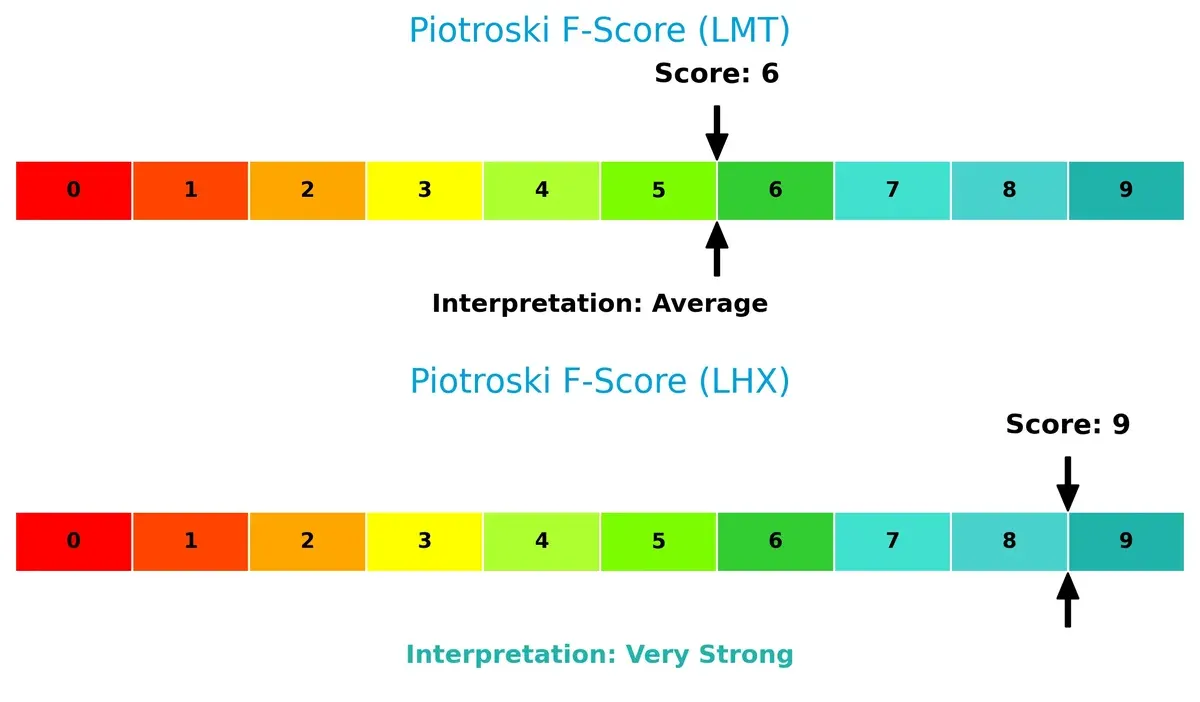
L3Harris excels in internal financial metrics, suggesting superior operational quality and value potential. Lockheed Martin’s average score flags potential red flags in operational efficiency or balance sheet quality relative to its peer.
How are the two companies positioned?
This section dissects the operational DNA of LMT and LHX by comparing their revenue distribution by segment and internal dynamics. The goal is to confront their economic moats to identify which business model offers the most resilient and sustainable competitive advantage today.
Revenue Segmentation: The Strategic Mix
This visual comparison dissects how Lockheed Martin Corporation and L3Harris Technologies diversify their income streams and where their primary sector bets lie:
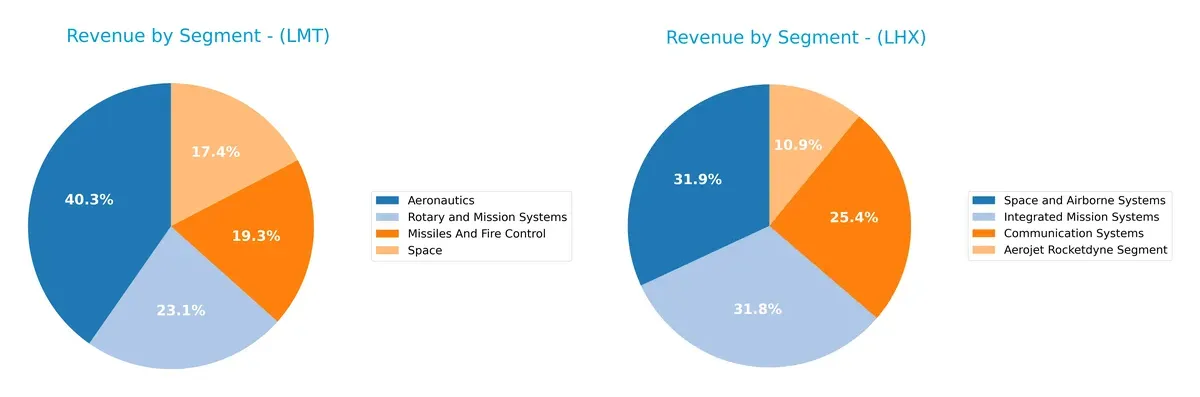
Lockheed Martin anchors its revenue with Aeronautics at $30.3B, but also generates substantial income from Rotary and Mission Systems ($17.3B) and Space ($13B), showing a balanced portfolio. In contrast, L3Harris relies more evenly on Integrated Mission Systems ($6.8B), Space and Airborne Systems ($6.9B), and Communication Systems ($5.5B). Lockheed’s dominance in Aeronautics signals infrastructure leadership, while L3Harris’s spread reduces concentration risk but lacks a clear flagship segment.
Strengths and Weaknesses Comparison
This table compares the Strengths and Weaknesses of Lockheed Martin Corporation and L3Harris Technologies, Inc.:
Lockheed Martin Corporation Strengths
- Strong profitability with ROE at 74.65% and ROIC at 17.39%
- Favorable WACC at 4.85% supports efficient capital use
- Diversified revenue streams across Aeronautics, Missiles, Rotary Systems, and Space
- Leading global presence with major sales in the United States and multiple regions
- High asset turnover indicating operational efficiency
- Solid dividend yield at 2.8%
L3Harris Technologies, Inc. Strengths
- Neutral net margin at 7.35% with slightly favorable WACC at 6.6%
- Favorable quick ratio and fixed asset turnover demonstrate liquidity and asset use
- Diversified segments including Communication Systems and Space and Airborne Systems
- Favorable debt-to-assets ratio at 25.35% indicates manageable leverage
- Presence in aerospace and defense niches with growth from Aerojet Rocketdyne segment
Lockheed Martin Corporation Weaknesses
- High price-to-book ratio at 16.62 may indicate overvaluation risk
- Neutral current and quick ratios suggest balanced but not strong liquidity
- Low debt-to-assets ratio could limit financial leverage benefits
- Market concentration in the United States might limit global diversification
- Neutral net margin points to potential margin pressure
L3Harris Technologies, Inc. Weaknesses
- Low ROE at 8.18% signals weaker profitability
- Unfavorable PE ratio at 34.26 reflects possible overvaluation
- Neutral to unfavorable interest coverage ratio at 4.24 could constrain debt servicing
- Lower asset turnover at 0.53 indicates less efficient asset use
- Limited geographic revenue data restricts clear global presence assessment
Lockheed Martin shows robust profitability and broad geographic diversification, underpinning its market leadership. L3Harris exhibits solid liquidity and manageable leverage but faces challenges in profitability and valuation metrics, affecting its competitive positioning.
The Moat Duel: Analyzing Competitive Defensibility
A structural moat is the only reliable shield protecting long-term profits from relentless competition erosion. Let’s dissect the moats of two aerospace giants:
Lockheed Martin Corporation: Intangible Assets and Government Relationships
Lockheed Martin’s primary moat stems from its unmatched government contracts and classified technology. This manifests in consistent, favorable net margins around 6.7% despite fluctuating EBIT growth. In 2026, expanding space and missile defense programs could deepen this advantage but require careful capital allocation.
L3Harris Technologies, Inc.: Technological Innovation and Integrated Systems
L3Harris competes with a technology-driven moat focused on integrated mission systems and ISR capabilities. Its gross margin at 25.7% and EBIT growth of 11.3% reflect operational strength, but a declining ROIC signals vulnerability. Future growth hinges on breakthroughs in electro-optical and cyber defense solutions.
Verdict: Government Ties vs. Tech Innovation
Lockheed Martin holds a wider moat supported by economic value creation and long-term government partnerships. L3Harris shows innovation but currently destroys value with a negative ROIC spread. Lockheed Martin is better positioned to defend its market share in the defense sector.
Which stock offers better returns?
The past year showed strong gains for both stocks, with Lockheed Martin and L3Harris demonstrating significant price increases and buyer dominance in volume trends.
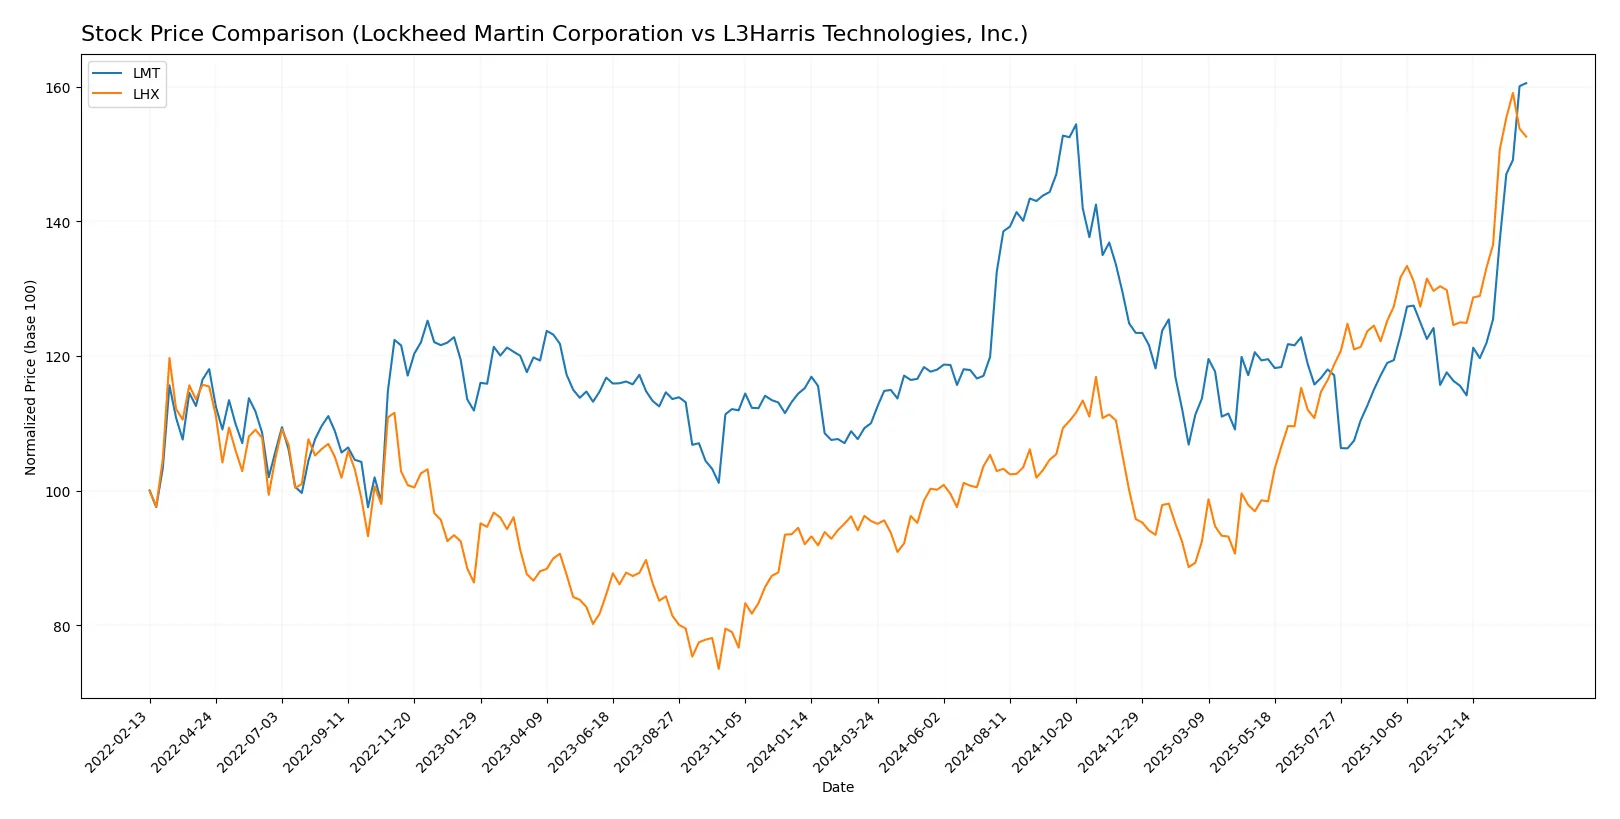
Trend Comparison
Lockheed Martin’s stock rose 45.93% over the past 12 months, reflecting a bullish trend with accelerating momentum and notable volatility, hitting a high of 636.0 and a low of 421.01.
L3Harris gained 59.84% in the same period, also bullish with acceleration but lower volatility, reaching a peak of 354.73 and a trough of 197.61.
L3Harris outperformed Lockheed Martin in market returns, delivering the highest price appreciation over the analyzed year.
Target Prices
Analysts present a balanced target consensus for Lockheed Martin Corporation and L3Harris Technologies, Inc.
| Company | Target Low | Target High | Consensus |
|---|---|---|---|
| Lockheed Martin Corporation | 517 | 695 | 607 |
| L3Harris Technologies, Inc. | 323 | 367 | 352.25 |
The consensus target for Lockheed Martin at 607 sits slightly below its current price of 636, suggesting modest downside risk. L3Harris’s consensus target of 352.25 exceeds its current 340, indicating moderate upside potential.

Don’t Let Luck Decide Your Entry Point
Optimize your entry points with our advanced ProRealTime indicators. You’ll get efficient buy signals with precise price targets for maximum performance. Start outperforming now!
How do institutions grade them?
Here is a comparison of recent institutional grades for Lockheed Martin Corporation and L3Harris Technologies, Inc.:
Lockheed Martin Corporation Grades
The following table summarizes recent grades from notable financial institutions for Lockheed Martin Corporation.
| Grading Company | Action | New Grade | Date |
|---|---|---|---|
| Goldman Sachs | Maintain | Sell | 2026-02-02 |
| RBC Capital | Maintain | Sector Perform | 2026-01-30 |
| TD Cowen | Maintain | Hold | 2026-01-30 |
| UBS | Maintain | Neutral | 2026-01-15 |
| Citigroup | Maintain | Neutral | 2026-01-13 |
| Jefferies | Maintain | Hold | 2026-01-12 |
| Truist Securities | Upgrade | Buy | 2026-01-09 |
| JP Morgan | Downgrade | Neutral | 2025-12-19 |
| Morgan Stanley | Downgrade | Equal Weight | 2025-12-16 |
| UBS | Maintain | Neutral | 2025-10-22 |
L3Harris Technologies, Inc. Grades
This table presents recent institutional grades for L3Harris Technologies, Inc.
| Grading Company | Action | New Grade | Date |
|---|---|---|---|
| Morgan Stanley | Maintain | Overweight | 2026-02-02 |
| RBC Capital | Maintain | Sector Perform | 2026-01-30 |
| UBS | Maintain | Neutral | 2026-01-15 |
| RBC Capital | Maintain | Sector Perform | 2026-01-14 |
| Citigroup | Maintain | Buy | 2026-01-13 |
| Morgan Stanley | Upgrade | Overweight | 2025-12-16 |
| JP Morgan | Maintain | Overweight | 2025-11-04 |
| UBS | Maintain | Neutral | 2025-10-31 |
| Truist Securities | Maintain | Buy | 2025-10-15 |
| Morgan Stanley | Maintain | Equal Weight | 2025-10-15 |
Which company has the best grades?
L3Harris Technologies holds consistently higher grades, including multiple Buy and Overweight ratings. Lockheed Martin faces more cautious assessments, including Sell and Neutral grades. Investors might interpret L3Harris as having stronger institutional support, potentially reflecting better near-term outlooks.
Risks specific to each company
The following categories identify the critical pressure points and systemic threats facing both firms in the 2026 market environment:
1. Market & Competition
Lockheed Martin Corporation
- Dominates key defense segments with strong government contracts and broad tech integration.
L3Harris Technologies, Inc.
- Faces intense competition in niche ISR and communication systems markets with evolving tech demands.
2. Capital Structure & Debt
Lockheed Martin Corporation
- Maintains low debt-to-equity of 0.17 and excellent interest coverage at 6.3, signaling financial strength.
L3Harris Technologies, Inc.
- Higher debt-to-equity of 0.53 and moderate interest coverage at 4.24 raise caution on leverage risks.
3. Stock Volatility
Lockheed Martin Corporation
- Exhibits very low beta at 0.23, indicating stable stock price behavior amid market swings.
L3Harris Technologies, Inc.
- Beta of 0.64 suggests moderate stock volatility, increasing investment risk during market stress.
4. Regulatory & Legal
Lockheed Martin Corporation
- Heavily reliant on U.S. government contracts, subject to policy shifts and export regulations.
L3Harris Technologies, Inc.
- Exposure to classified intelligence programs entails elevated legal and compliance scrutiny risks.
5. Supply Chain & Operations
Lockheed Martin Corporation
- Complex global supply chains vulnerable to geopolitical disruptions but diversified across segments.
L3Harris Technologies, Inc.
- More concentrated supply chain for ISR and communication products, sensitive to component shortages.
6. ESG & Climate Transition
Lockheed Martin Corporation
- Faces growing pressure to reduce carbon footprint in aerospace manufacturing and defense systems.
L3Harris Technologies, Inc.
- Actively developing energy-efficient technologies but must accelerate ESG disclosures to meet investor demand.
7. Geopolitical Exposure
Lockheed Martin Corporation
- Significant exposure to global defense markets and foreign military sales tied to U.S. policies.
L3Harris Technologies, Inc.
- Geopolitical risks heightened by ISR and cyber defense operations in volatile international regions.
Which company shows a better risk-adjusted profile?
Lockheed Martin’s dominant market position and robust capital structure mitigate risks better than L3Harris’s higher leverage and moderate volatility. LMT’s low beta and strong interest coverage provide a cushion against market and financial shocks. Conversely, LHX’s top Piotroski score signals operational strength but its Altman Z-score in the grey zone flags caution on financial stability. The most impactful risk for Lockheed Martin is dependence on government contracts subject to policy shifts. For L3Harris, leverage and supply chain concentration pose the biggest threats. Overall, Lockheed Martin presents a superior risk-adjusted profile, supported by a solid balance sheet and stable stock behavior in 2026’s uncertain aerospace and defense environment.
Final Verdict: Which stock to choose?
Lockheed Martin’s superpower lies in its formidable capital efficiency and robust value creation, evidenced by a strong ROIC comfortably above its WACC. Its point of vigilance is a declining profitability trend, which warrants close monitoring. This stock fits well in portfolios seeking aggressive growth with a long-term horizon.
L3Harris Technologies boasts a strategic moat in its diversified defense technology portfolio and relatively stable recurring revenue streams. Compared to Lockheed Martin, it offers a safer profile with a stronger recent income statement performance but struggles with value creation and profitability erosion. It suits investors favoring growth at a reasonable price (GARP) with moderate risk tolerance.
If you prioritize aggressive growth powered by efficient capital allocation and enduring competitive advantage, Lockheed Martin is the compelling choice due to its superior ROIC and strong return on equity. However, if you seek more stability with consistent income statement improvement and a balanced risk profile, L3Harris offers better stability despite its weaker moat and profitability metrics. Both present viable scenarios depending on your investment strategy and risk appetite.
Disclaimer: Investment carries a risk of loss of initial capital. The past performance is not a reliable indicator of future results. Be sure to understand risks before making an investment decision.
Go Further
I encourage you to read the complete analyses of Lockheed Martin Corporation and L3Harris Technologies, Inc. to enhance your investment decisions: