Home > Comparison > Technology > KLAC vs TSEM
The strategic rivalry between KLA Corporation and Tower Semiconductor Ltd. shapes the semiconductor sector’s competitive landscape. KLA operates as a capital-intensive leader in process control and yield management solutions. Tower Semiconductor focuses on customizable analog and mixed-signal foundry services, emphasizing niche process technologies. This clash highlights a contrast between integrated control systems and specialized manufacturing. This analysis aims to identify which company’s trajectory offers superior risk-adjusted returns for a diversified portfolio in this dynamic industry.
Table of contents
Companies Overview
KLA Corporation and Tower Semiconductor Ltd. hold pivotal roles in the semiconductor industry, shaping innovation and production worldwide.
KLA Corporation: Leader in Semiconductor Process Control
KLA dominates as a process control and yield management provider for semiconductor manufacturing. Its revenue stems from high-tech inspection, metrology, and process-enabling solutions. In 2026, the company focuses strategically on enhancing integrated circuit manufacturing precision and expanding specialty semiconductor services globally.
Tower Semiconductor Ltd.: Independent Foundry Specialist
Tower Semiconductor stands out as an independent semiconductor foundry offering analog and mixed-signal device fabrication. It generates revenue through customizable process technologies for diverse markets including automotive and medical. The 2026 strategy centers on broadening wafer fabrication services and advancing design enablement platforms for fabless companies.
Strategic Collision: Similarities & Divergences
KLA and Tower both operate in semiconductors but diverge in core approaches: KLA provides process control tools, while Tower delivers manufacturing capacity. Their competition centers on the semiconductor production value chain, with KLA focusing upstream on yield optimization, and Tower downstream on manufacturing flexibility. Investors face distinct profiles—KLA as a technology enabler, Tower as a capacity provider.
Income Statement Comparison
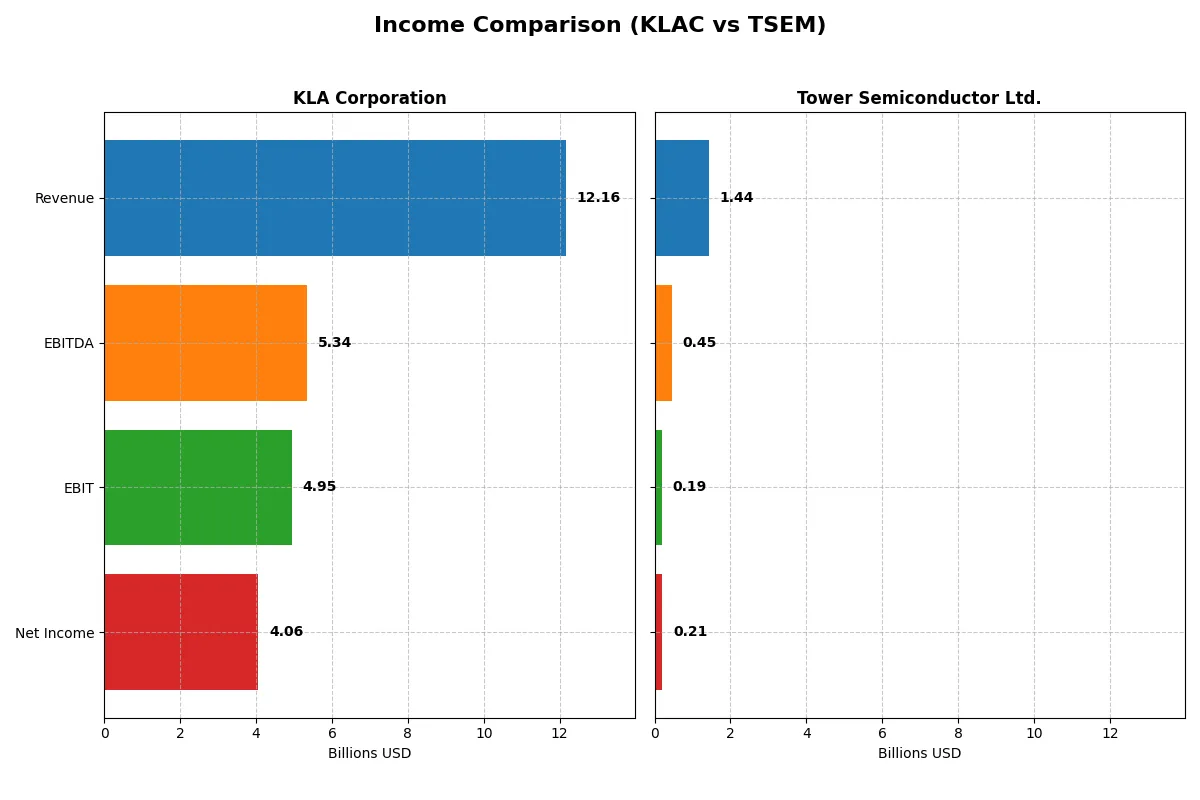
This data dissects the core profitability and scalability of both corporate engines to reveal who dominates the bottom line:
| Metric | KLA Corporation (KLAC) | Tower Semiconductor Ltd. (TSEM) |
|---|---|---|
| Revenue | 12.2B | 1.44B |
| Cost of Revenue | 4.58B | 1.10B |
| Operating Expenses | 2.33B | 148M |
| Gross Profit | 7.58B | 339M |
| EBITDA | 5.34B | 451M |
| EBIT | 4.95B | 185M |
| Interest Expense | 302M | 6M |
| Net Income | 4.06B | 208M |
| EPS | 30.53 | 1.87 |
| Fiscal Year | 2025 | 2024 |
Income Statement Analysis: The Bottom-Line Duel
This income statement comparison exposes which company truly maximizes revenue into efficient profit generation.
KLA Corporation Analysis
KLA’s revenue surged from 6.9B in 2021 to 12.2B in 2025, nearly doubling net income from 2.1B to 4.1B. Its gross margin remains robust above 62%, while net margin expanded favorably to 33.4%. The 2025 fiscal year highlights accelerating momentum with a 23.9% revenue growth and 49.8% EPS jump, signaling strong operational leverage.
Tower Semiconductor Ltd. Analysis
Tower Semiconductor’s revenue growth stagnated near 1.4B in 2024 with net income at 208M, reflecting a muted scale. Gross margin at 23.6% and net margin of 14.5% lag industry leaders. Recent declines in EBIT and net margin by over 60% indicate weakening profitability despite solid net income growth over the longer term, pointing to volatility in operational efficiency.
Margin Dominance vs. Scale Challenges
KLA decisively outperforms Tower Semiconductor in both scale and margin health. KLA’s 33%+ net margin and consistent revenue growth dwarf Tower’s limited top-line expansion and depressed profitability. For investors prioritizing durable earnings and margin strength, KLA’s profile offers clearer fundamental superiority in converting revenue into profit.
Financial Ratios Comparison
These vital ratios act as a diagnostic tool to expose the underlying fiscal health, valuation premiums, and capital efficiency of each company:
| Ratios | KLA Corporation (KLAC) | Tower Semiconductor Ltd. (TSEM) |
|---|---|---|
| ROE | 86.6% | 7.8% |
| ROIC | 38.0% | 6.4% |
| P/E | 29.3 | 27.5 |
| P/B | 25.4 | 2.16 |
| Current Ratio | 2.62 | 6.18 |
| Quick Ratio | 1.83 | 5.23 |
| D/E | 1.30 | 0.068 |
| Debt-to-Assets | 37.9% | 5.9% |
| Interest Coverage | 17.3 | 32.6 |
| Asset Turnover | 0.76 | 0.47 |
| Fixed Asset Turnover | 9.70 | 1.11 |
| Payout Ratio | 22.3% | 0% |
| Dividend Yield | 0.76% | 0% |
| Fiscal Year | 2025 | 2024 |
Efficiency & Valuation Duel: The Vital Signs
Ratios act as a company’s DNA, unveiling hidden risks and operational strengths that define its market standing and future prospects.
KLA Corporation
KLA delivers strong profitability with an 86.6% ROE and a robust 33.4% net margin, signaling operational excellence. However, its valuation appears stretched, with a high P/E of 29.3 and a steep P/B of 25.4. Shareholders receive a modest 0.76% dividend yield, reflecting a cautious payout amid solid reinvestment in R&D.
Tower Semiconductor Ltd.
Tower Semiconductor shows moderate profitability, with a 7.8% ROE and a 14.5% net margin, indicating room for improvement. Its valuation is slightly more attractive, though the P/E of 27.5 remains high. The company pays no dividend, prioritizing growth through reinvestment, while maintaining a low debt profile and strong liquidity metrics.
Premium Valuation vs. Operational Safety
KLA boasts superior profitability but at a premium valuation and higher leverage. Tower offers a more conservative balance sheet with less profitability and no dividend payout. Investors seeking operational efficiency might prefer KLA, while those valuing financial safety and growth reinvestment may lean toward Tower.
Which one offers the Superior Shareholder Reward?
I compare KLA Corporation (KLAC) and Tower Semiconductor Ltd. (TSEM) on their shareholder reward strategies. KLAC pays dividends with a 0.76% yield and maintains a disciplined 22% payout ratio, well-covered by 92% free cash flow. KLAC also runs steady buybacks, enhancing total returns sustainably. TSEM pays no dividends, focusing on reinvestment in growth and R&D, but its free cash flow is minimal at just 0.1B on 12.9B revenue, limiting buyback potential. KLAC’s balanced dividend and buyback model offers a more reliable and attractive total return profile for 2026 investors.
Comparative Score Analysis: The Strategic Profile
The radar chart reveals the fundamental DNA and trade-offs of KLA Corporation and Tower Semiconductor Ltd., highlighting their core financial strengths and weaknesses:
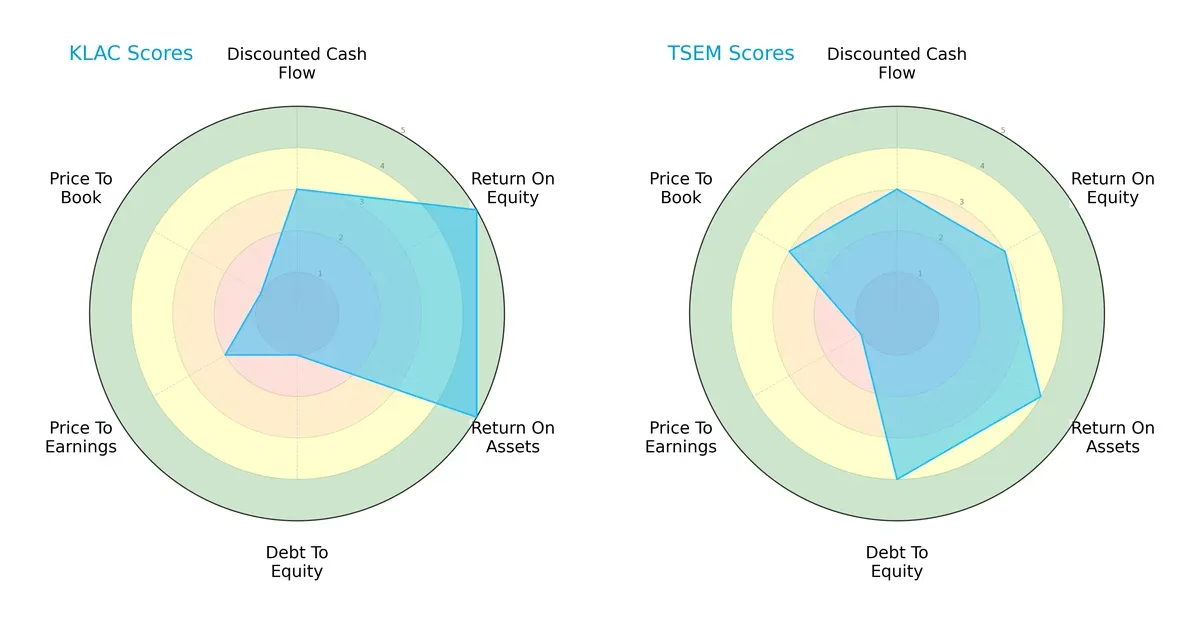
KLA Corporation excels in profitability with top ROE (5) and ROA (5) scores but suffers from a weak balance sheet, indicated by a very unfavorable debt-to-equity score (1). Tower Semiconductor shows better financial stability with a favorable debt-to-equity score (4) and solid asset utilization (ROA 4), yet its profitability metrics lag behind KLAC. KLAC relies heavily on operational efficiency, while TSEM presents a more balanced but less dominant profile.
Bankruptcy Risk: Solvency Showdown
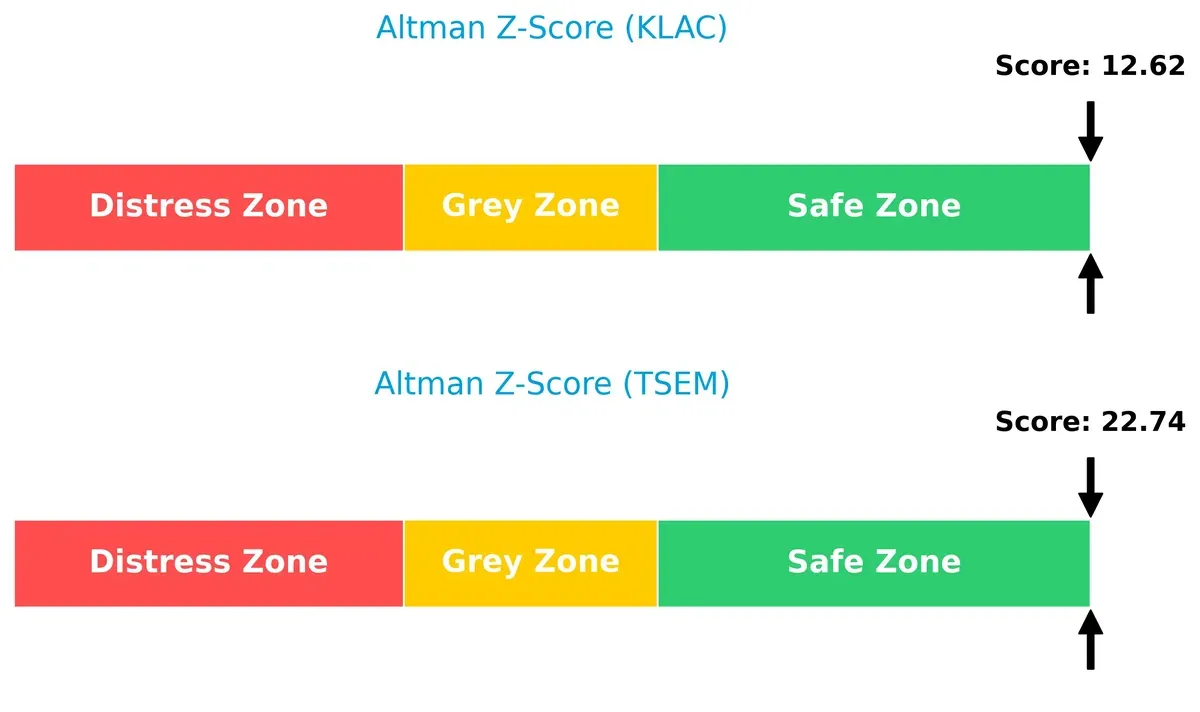
The Altman Z-Score delta indicates both firms reside comfortably in the safe zone, with TSEM scoring a superior 22.7 versus KLAC’s 12.6, signaling lower bankruptcy risk and stronger resilience in this cycle:
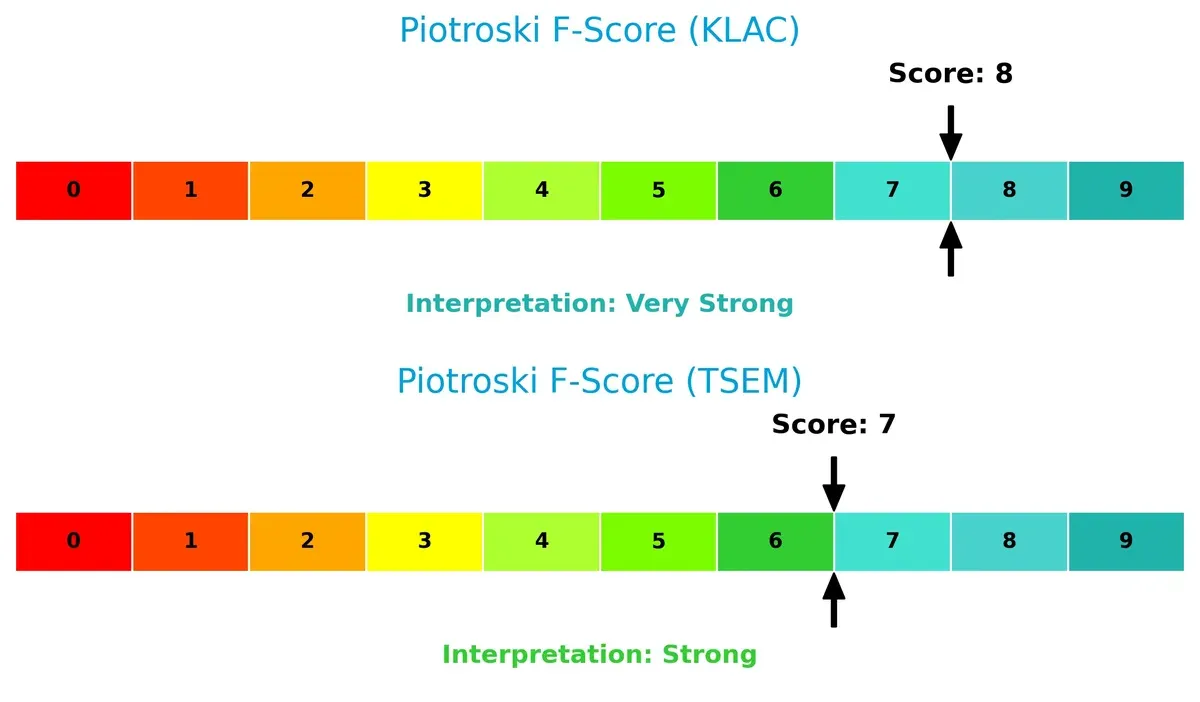
Financial Health: Quality of Operations
KLA Corporation’s Piotroski F-Score of 8 reflects very strong financial health, outperforming Tower Semiconductor’s solid 7. KLAC’s internal metrics demonstrate better profitability and operational efficiency, while TSEM, although strong, shows minor red flags in comparative financial robustness:
How are the two companies positioned?
This section dissects the operational DNA of KLAC and TSEM by comparing their revenue distribution by segment and internal dynamics. The goal is to confront their economic moats to reveal which model offers the most resilient competitive advantage today.
Revenue Segmentation: The Strategic Mix
The following visual comparison dissects how both firms diversify their income streams and where their primary sector bets lie:
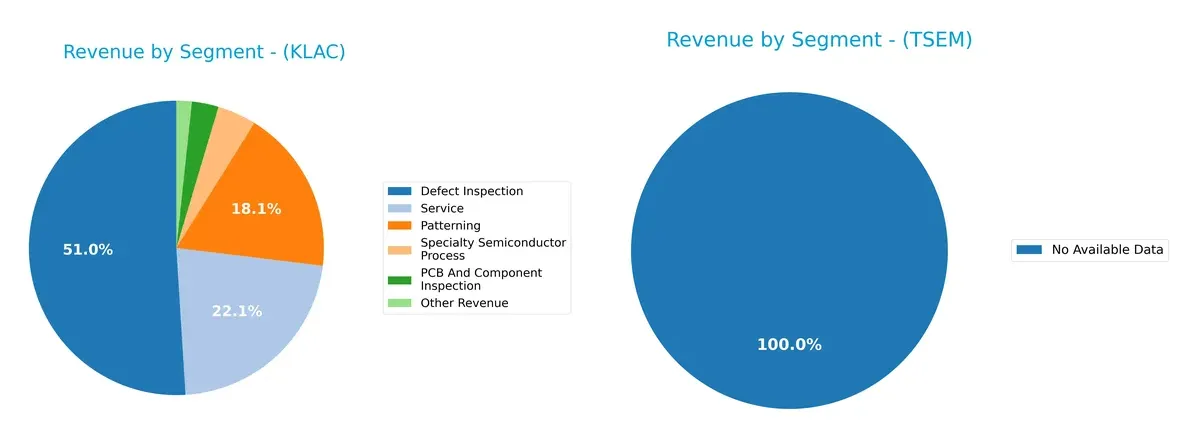
KLA Corporation anchors its revenue heavily in Defect Inspection at $6.2B, dwarfing other segments like Service ($2.7B) and Patterning ($2.2B). This concentration underscores its dominance in semiconductor infrastructure but signals exposure to segment-specific cycles. Tower Semiconductor Ltd. lacks available data, making diversification assessment impossible. KLA’s focused portfolio suggests a moat in inspection technology, but investors must watch for concentration risk amid sector volatility.
Strengths and Weaknesses Comparison
This table compares the strengths and weaknesses of KLA Corporation and Tower Semiconductor Ltd.:
KLA Corporation Strengths
- High net margin at 33.41%
- Exceptional ROE at 86.56%
- Strong ROIC at 37.97%
- Robust current and quick ratios
- High interest coverage at 16.37x
- Diverse revenue streams including defect inspection and services
- Broad global presence with strong China and Taiwan sales
Tower Semiconductor Ltd. Strengths
- Favorable net margin at 14.47%
- Low debt-to-equity ratio at 0.07
- High interest coverage at 31.57x
- Favorable WACC at 7.87%
- Solid quick ratio at 5.23
- Low debt to assets at 5.87%
- Reasonable P/B ratio at 2.16
KLA Corporation Weaknesses
- High WACC at 10.42%
- Elevated P/E at 29.34
- High P/B at 25.39
- Debt to equity ratio at 1.3 is unfavorable
- Dividend yield low at 0.76%
- Asset turnover moderate at 0.76
- Debt to assets at 37.89% is neutral
Tower Semiconductor Ltd. Weaknesses
- ROE low at 7.83%
- ROIC only neutral at 6.41%
- Unfavorable P/E at 27.54
- Current ratio unusually high at 6.18 (possible inefficiency)
- Asset turnover weak at 0.47
- No dividend yield reported
KLA exhibits strong profitability and global diversification but carries higher leverage and valuation multiples. Tower Semiconductor shows conservative debt management and solid coverage ratios, yet profitability and asset utilization lag behind. Each company’s financial profile suggests distinct strategic priorities around growth and capital efficiency.
The Moat Duel: Analyzing Competitive Defensibility
A structural moat shields long-term profits from relentless competition erosion. It defines which firms sustain value and which ones fade:
KLA Corporation: Precision Process Control Moat
KLA’s competitive edge stems from its high-precision process control technology. This moat shows in its 40.7% EBIT margin and a ROIC exceeding WACC by 27.5%. New semiconductor nodes in 2026 should deepen this advantage.
Tower Semiconductor Ltd.: Niche Foundry Flexibility Moat
Tower’s strength lies in customizable analog and mixed-signal foundry services, contrasting with KLA’s tech-driven moat. Despite growing ROIC, it currently sheds value with ROIC below WACC. Expansion in specialized markets could improve its moat.
Precision Process Control vs. Niche Foundry Flexibility
KLA holds the wider and deeper moat, demonstrated by superior margins and value creation. Tower’s rising profitability is promising, but KLA is better positioned to defend market share in 2026.
Which stock offers better returns?
Over the past year, both KLA Corporation and Tower Semiconductor Ltd. exhibited strong price appreciation, with notable acceleration in their upward trends and contrasting volatility patterns.
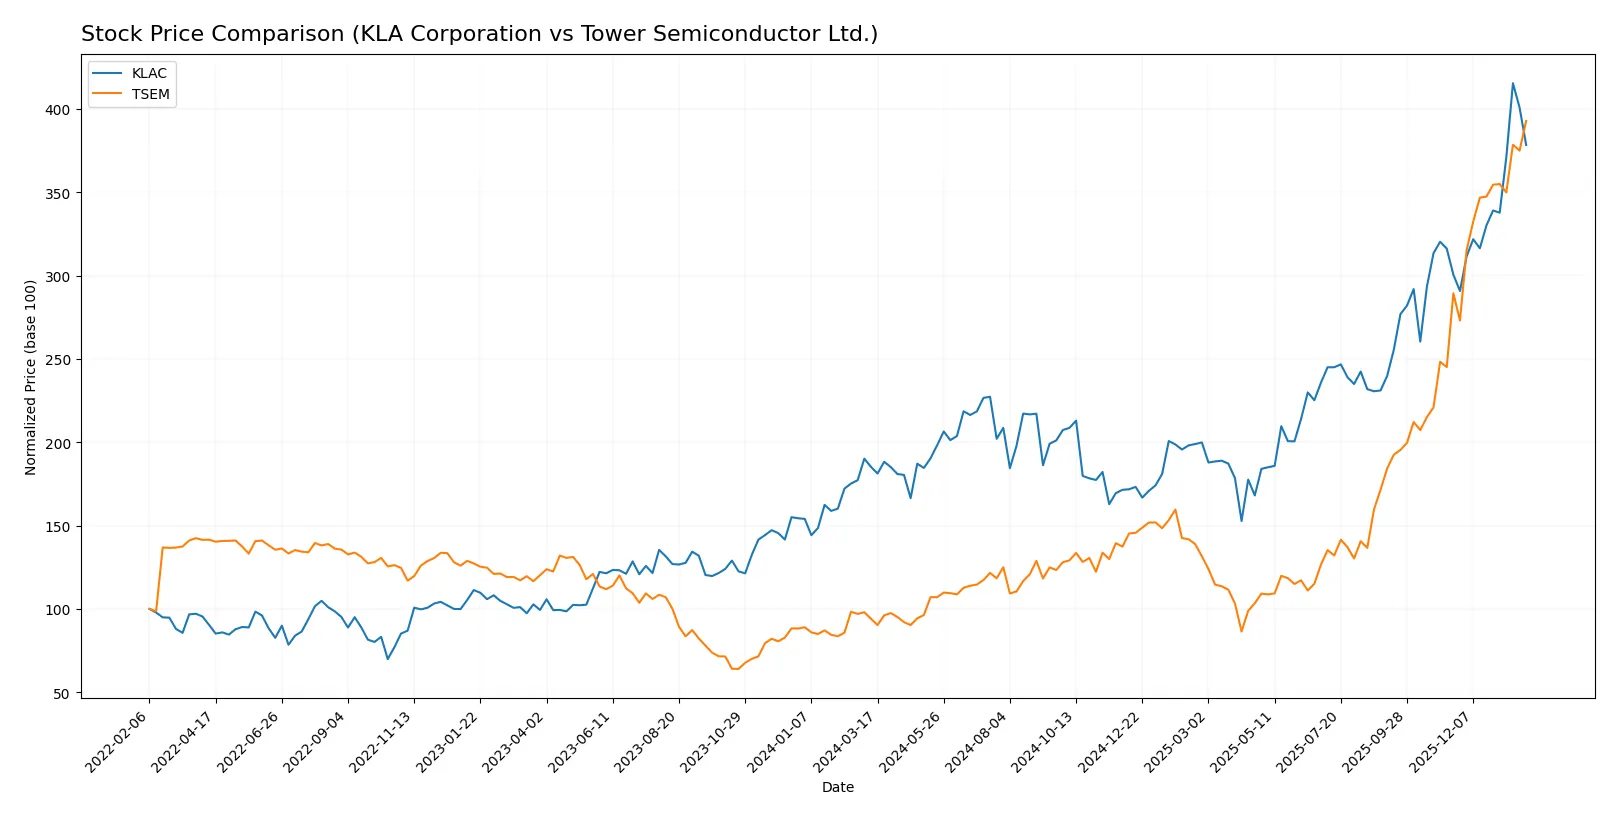
Trend Comparison
KLA Corporation’s stock price rose 104.22% over the past 12 months, showing a bullish trend with accelerating momentum and high volatility, peaking at 1567.82 and bottoming at 576.53.
Tower Semiconductor’s stock surged 316.99% over the same period, also bullish with accelerating gains but significantly lower volatility, reaching a high of 134.73 from a low of 29.65.
Comparing both, Tower Semiconductor delivered the highest market performance with a more than threefold price increase, outpacing KLA’s strong but less pronounced rise.
Target Prices
Analysts present a measured target consensus for both KLA Corporation and Tower Semiconductor Ltd.
| Company | Target Low | Target High | Consensus |
|---|---|---|---|
| KLA Corporation | 1400 | 1900 | 1672.25 |
| Tower Semiconductor Ltd. | 66 | 125 | 96 |
The consensus target for KLA sits about 17% above its current price of 1427.94, signaling moderate upside potential. Tower Semiconductor’s consensus target is slightly below its current price of 134.73, suggesting limited near-term gains.

Don’t Let Luck Decide Your Entry Point
Optimize your entry points with our advanced ProRealTime indicators. You’ll get efficient buy signals with precise price targets for maximum performance. Start outperforming now!
How do institutions grade them?
KLA Corporation Grades
Here are the most recent institutional grades for KLA Corporation:
| Grading Company | Action | New Grade | Date |
|---|---|---|---|
| Oppenheimer | maintain | Outperform | 2026-01-30 |
| Barclays | maintain | Overweight | 2026-01-30 |
| Cantor Fitzgerald | maintain | Overweight | 2026-01-30 |
| Jefferies | maintain | Buy | 2026-01-30 |
| Stifel | maintain | Buy | 2026-01-30 |
| Wells Fargo | maintain | Overweight | 2026-01-30 |
| Needham | maintain | Buy | 2026-01-30 |
| RBC Capital | maintain | Sector Perform | 2026-01-30 |
| Deutsche Bank | maintain | Hold | 2026-01-21 |
| Needham | maintain | Buy | 2026-01-20 |
Tower Semiconductor Ltd. Grades
Here are the most recent institutional grades for Tower Semiconductor Ltd.:
| Grading Company | Action | New Grade | Date |
|---|---|---|---|
| Benchmark | maintain | Buy | 2026-01-09 |
| Wedbush | downgrade | Neutral | 2025-12-31 |
| Benchmark | maintain | Buy | 2025-11-11 |
| Susquehanna | maintain | Positive | 2025-11-11 |
| Wedbush | maintain | Outperform | 2025-11-11 |
| Barclays | maintain | Equal Weight | 2025-11-11 |
| Benchmark | maintain | Buy | 2025-09-08 |
| Susquehanna | maintain | Positive | 2025-08-05 |
| Benchmark | maintain | Buy | 2025-08-05 |
| Benchmark | maintain | Buy | 2025-08-04 |
Which company has the best grades?
KLA Corporation consistently receives Buy, Overweight, and Outperform ratings, while Tower Semiconductor has a mixture including Neutral and Equal Weight. KLA’s stronger grades typically indicate higher institutional confidence, potentially influencing investor sentiment positively.
Risks specific to each company
The following categories identify the critical pressure points and systemic threats facing both firms in the 2026 market environment:
1. Market & Competition
KLA Corporation
- Dominates high-end process control with strong market share but faces aggressive innovation cycles.
Tower Semiconductor Ltd.
- Competes as an independent foundry with niche analog focus but limited scale against larger peers.
2. Capital Structure & Debt
KLA Corporation
- Higher debt-to-equity ratio (1.3) signals elevated leverage and financial risk.
Tower Semiconductor Ltd.
- Very low debt-to-equity (0.07) reflects conservative capital structure and lower financial risk.
3. Stock Volatility
KLA Corporation
- Beta of 1.44 indicates higher stock volatility relative to market benchmarks.
Tower Semiconductor Ltd.
- Beta of 0.88 shows lower market sensitivity and more stable share price behavior.
4. Regulatory & Legal
KLA Corporation
- Exposed to stringent U.S. technology export controls and IP regulations.
Tower Semiconductor Ltd.
- Faces complex multi-jurisdictional compliance risks, including U.S. and Israeli export laws.
5. Supply Chain & Operations
KLA Corporation
- Relies on advanced materials suppliers with potential bottlenecks impacting delivery.
Tower Semiconductor Ltd.
- Dependent on global foundry supply chains vulnerable to geopolitical disruptions.
6. ESG & Climate Transition
KLA Corporation
- Increasing ESG initiatives but must manage high energy use in manufacturing.
Tower Semiconductor Ltd.
- Strong ESG focus with lower emissions footprint but faces pressure to improve transparency.
7. Geopolitical Exposure
KLA Corporation
- Primarily U.S.-based but global operations expose it to export restrictions and trade tensions.
Tower Semiconductor Ltd.
- Israeli base subjects it to regional geopolitical risks and global trade uncertainties.
Which company shows a better risk-adjusted profile?
Tower Semiconductor’s low leverage and stable beta offer a more resilient risk profile despite regulatory and geopolitical complexities. KLA’s dominant market position is offset by elevated debt and stock volatility. Tower’s conservative capital structure and safer Altman Z-score (22.7 vs. 12.6) justify cautious preference in risk management.
Final Verdict: Which stock to choose?
KLA Corporation’s superpower lies in its commanding economic moat, reflected by a high and growing ROIC that far exceeds its cost of capital. It operates as a cash-generating machine with robust profitability and efficiency. Its point of vigilance is its elevated valuation multiples, which demand careful timing. KLAC suits portfolios targeting aggressive growth with tolerance for premium pricing.
Tower Semiconductor’s strategic moat centers on its solid balance sheet and high liquidity, offering a safety cushion amid volatility. While its profitability metrics trail KLAC’s, TSEM benefits from a low debt load and strong free cash flow stability. This profile appeals to investors seeking growth at a reasonable price with a defensive tilt.
If you prioritize durable competitive advantage and high return on invested capital, KLA outshines due to its value creation and scalable profitability. However, if you seek a safer growth exposure with more conservative financial risk, Tower Semiconductor offers better stability and balance sheet strength. Both present analytical scenarios worth considering based on your risk appetite and growth expectations.
Disclaimer: Investment carries a risk of loss of initial capital. The past performance is not a reliable indicator of future results. Be sure to understand risks before making an investment decision.
Go Further
I encourage you to read the complete analyses of KLA Corporation and Tower Semiconductor Ltd. to enhance your investment decisions: