Home > Comparison > Technology > KLAC vs TXN
The strategic rivalry between KLA Corporation and Texas Instruments Incorporated shapes the semiconductor sector’s evolution. KLA operates as a capital-intensive process control and yield management specialist. Texas Instruments leads as a diversified semiconductor designer with strong analog and embedded processing segments. This analysis pits KLA’s precision manufacturing solutions against Texas Instruments’ broad product portfolio to identify which trajectory offers superior risk-adjusted returns for a balanced portfolio.
Table of contents
Companies Overview
KLA Corporation and Texas Instruments Incorporated hold pivotal roles in the semiconductor industry, shaping technology innovation and supply chains globally.
KLA Corporation: Semiconductor Process Control Specialist
KLA Corporation dominates the semiconductor process control market. It generates revenue primarily through advanced inspection and metrology tools that enhance IC manufacturing yields. In 2026, KLA’s strategic focus centers on expanding integrated process management solutions, targeting precision and efficiency gains in wafer and substrate inspection across semiconductor and electronics sectors.
Texas Instruments Incorporated: Analog and Embedded Processing Leader
Texas Instruments Incorporated leads in analog and embedded semiconductor products. Its revenue engine revolves around power management and signal processing chips used broadly in industrial, automotive, and consumer electronics. The 2026 strategy emphasizes innovation in low-power solutions and embedded processors, reinforcing its foundation in diverse end markets while growing digital signal processors and microcontrollers.
Strategic Collision: Similarities & Divergences
Both firms operate in semiconductors but diverge sharply: KLA specializes in process control equipment, while Texas Instruments focuses on chip design and manufacturing. The primary battleground lies in supporting semiconductor production—KLA on yield optimization; Texas Instruments on end-device chip performance. Their investment profiles differ as KLA offers exposure to manufacturing precision tools, whereas Texas Instruments provides broad semiconductor market participation.
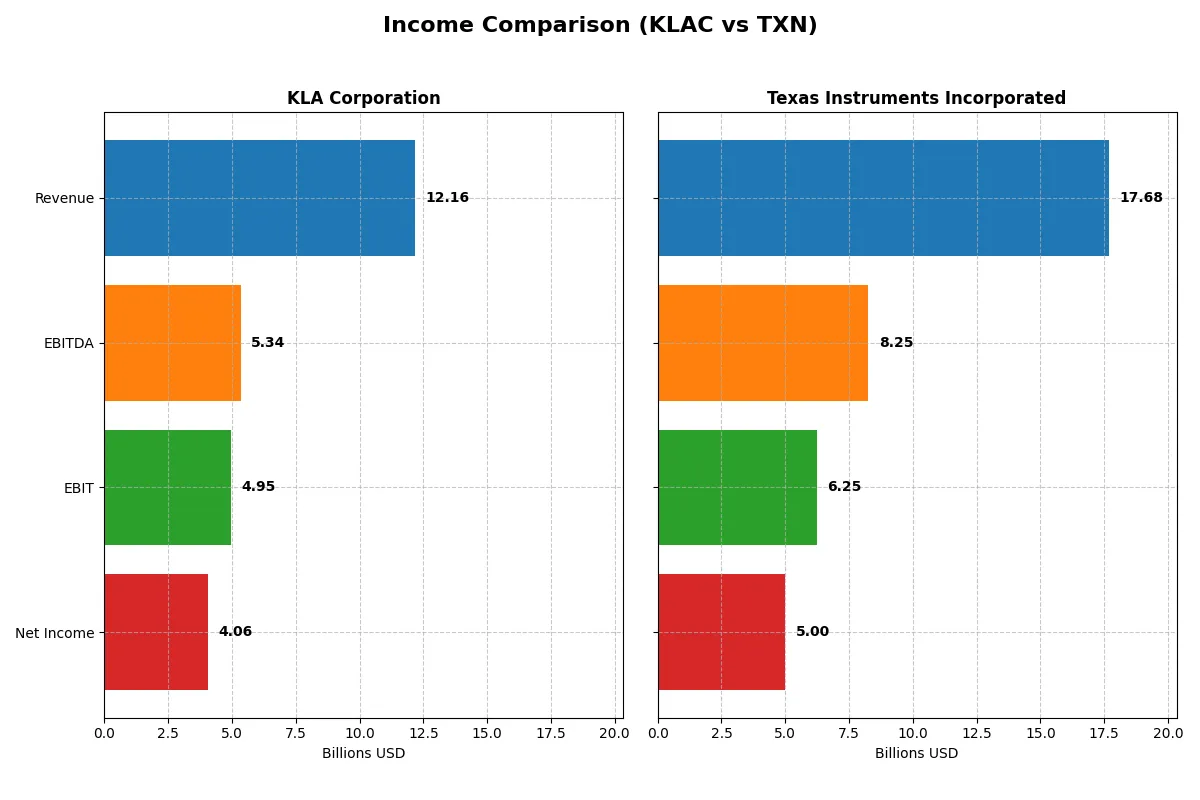
Income Statement Comparison
The following data dissects the core profitability and scalability of both corporate engines to reveal who dominates the bottom line:
| Metric | KLA Corporation (KLAC) | Texas Instruments Incorporated (TXN) |
|---|---|---|
| Revenue | 12.2B | 17.7B |
| Cost of Revenue | 4.6B | 7.6B |
| Operating Expenses | 2.3B | 4.1B |
| Gross Profit | 7.6B | 10.1B |
| EBITDA | 5.3B | 8.3B |
| EBIT | 4.9B | 6.3B |
| Interest Expense | 302M | 543M |
| Net Income | 4.1B | 5.0B |
| EPS | 30.53 | 5.45 |
| Fiscal Year | 2025 | 2025 |
Income Statement Analysis: The Bottom-Line Duel
This income statement comparison reveals which company operates its business with superior efficiency and profit generation over recent years.
KLA Corporation Analysis
KLA’s revenue surged 23.9% in 2025 to $12.2B, driving net income up 47% to $4.1B. Its gross margin stands at a robust 62.3%, and net margin at 33.4%, both favorable. The company accelerated earnings growth with a 40%+ EBIT increase, reflecting strong operational leverage and margin expansion.
Texas Instruments Incorporated Analysis
Texas Instruments grew revenue 13% to $17.7B in 2025, while net income declined 7.8% to $5.0B. Gross margin reached 57.0%, with a net margin of 28.3%, remaining healthy but lower than KLA. EBIT growth slowed to under 5%, signaling margin pressure and waning momentum compared to prior years.
Margin Leadership vs. Scale Advantage
KLA exhibits superior margin expansion and faster earnings growth, while Texas Instruments benefits from larger top-line scale but faces declining profitability. Fundamentally, KLA outperforms in operational efficiency and margin health. For investors prioritizing profit quality and growth, KLA’s profile is more compelling.
Financial Ratios Comparison
These vital ratios act as a diagnostic tool to expose the underlying fiscal health, valuation premiums, and capital efficiency of the companies analyzed:
| Ratios | KLA Corporation (KLAC) | Texas Instruments Incorporated (TXN) |
|---|---|---|
| ROE | 86.6% | 30.7% |
| ROIC | 38.0% | 16.5% |
| P/E | 29.3 | 31.5 |
| P/B | 25.4 | 9.7 |
| Current Ratio | 2.62 | 4.35 |
| Quick Ratio | 1.83 | 2.83 |
| D/E | 1.30 | 0.86 |
| Debt-to-Assets | 37.9% | 40.6% |
| Interest Coverage | 17.3 | 11.1 |
| Asset Turnover | 0.76 | 0.51 |
| Fixed Asset Turnover | 9.70 | 1.44 |
| Payout ratio | 22.3% | 100.0% |
| Dividend yield | 0.76% | 3.17% |
| Fiscal Year | 2025 | 2025 |
Efficiency & Valuation Duel: The Vital Signs
Financial ratios serve as a company’s DNA, uncovering hidden risks and operational strengths that raw numbers alone cannot reveal.
KLA Corporation
KLA displays exceptional profitability with an 86.6% ROE and a robust 33.4% net margin, signaling operational excellence. Its valuation appears stretched, marked by a high P/E of 29.3 and a P/B of 25.4. Shareholder returns lean on modest dividends (0.76% yield) alongside aggressive reinvestment in R&D, fueling growth.
Texas Instruments Incorporated
Texas Instruments delivers solid profitability with a 30.7% ROE and a 28.3% net margin, reflecting efficient operations. The stock trades at a slightly higher P/E of 31.5 yet a more reasonable P/B of 9.7. It offers a meaningful 3.17% dividend yield, balancing shareholder returns with steady reinvestment in innovation and growth.
Premium Valuation vs. Operational Safety
KLA commands superior profitability but at a stretched valuation and lower dividend yield, whereas Texas Instruments offers a safer valuation profile with steady income through dividends. Investors seeking growth may favor KLA’s operational excellence; income-focused investors might prefer Texas Instruments’ balanced risk and yield.
Which one offers the Superior Shareholder Reward?
I compare KLA Corporation (KLAC) and Texas Instruments Incorporated (TXN) on dividends, payout ratios, and buybacks through 2025. KLAC yields 0.76%, with a 22% payout ratio, supported by robust free cash flow (FCF) coverage near 92%. TXN pays a higher 3.17% yield but nearly 100% payout ratio, straining dividend sustainability. KLAC maintains steady buybacks, enhancing shareholder value without overleveraging. TXN’s high dividend payout limits buyback capacity, risking long-term growth trade-offs. I see KLAC’s balanced distribution and buyback approach as more sustainable, offering superior total return potential in 2026.
Comparative Score Analysis: The Strategic Profile
The radar chart reveals the fundamental DNA and trade-offs of KLA Corporation and Texas Instruments Incorporated, highlighting their financial strengths and vulnerabilities:
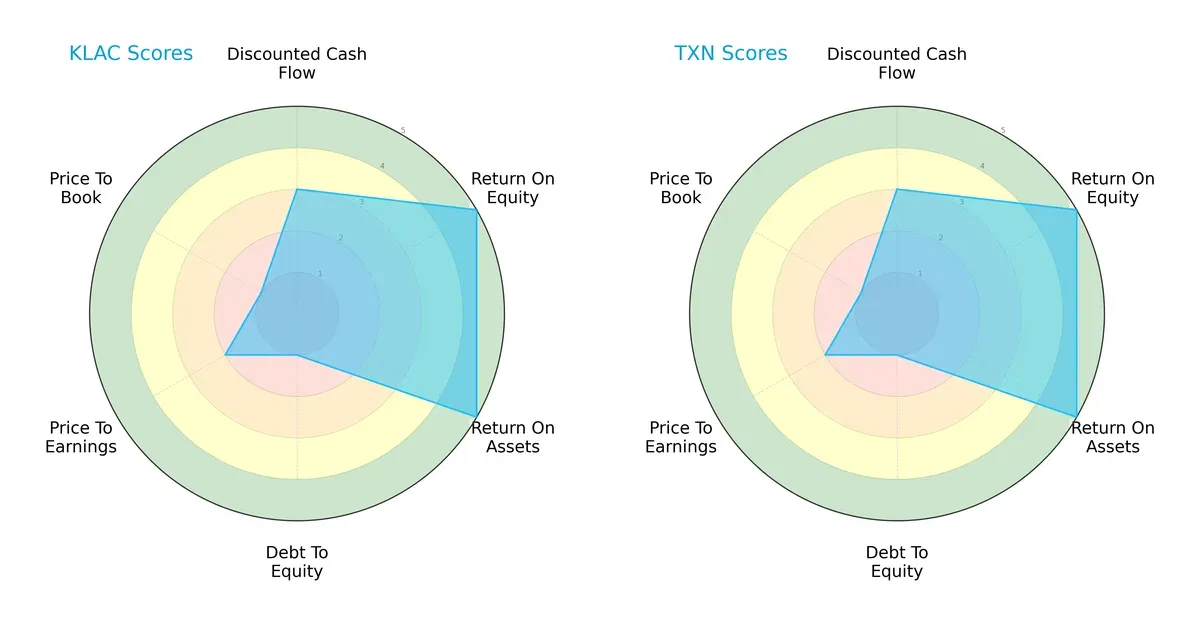
Both companies share identical scores across DCF, ROE, ROA, Debt/Equity, and valuation metrics, reflecting a matched strategic profile. They both excel in profitability with top ROE and ROA scores. However, their balance sheets show elevated financial risk with very unfavorable Debt/Equity and Price-to-Book scores. Neither firm displays a more balanced profile; instead, both rely heavily on operational efficiency while carrying notable leverage concerns.
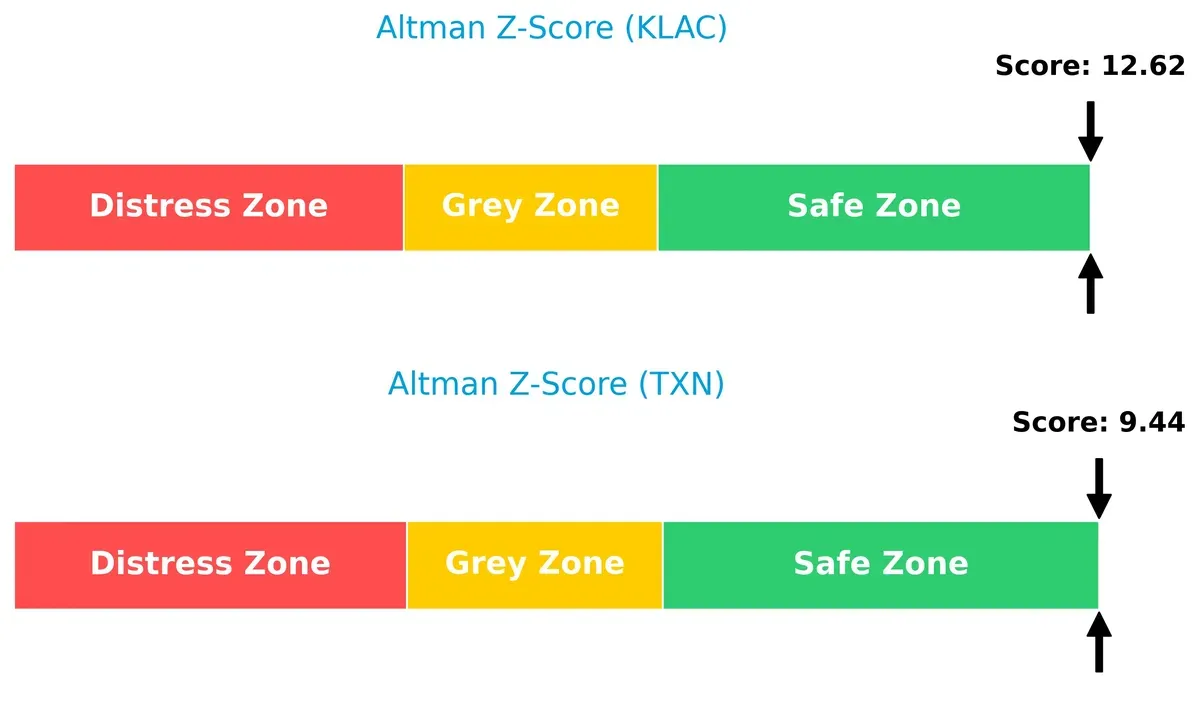
Bankruptcy Risk: Solvency Showdown
KLA Corporation’s Altman Z-Score of 12.6 surpasses Texas Instruments’ 9.4, placing both comfortably in the safe zone but showing KLA with a stronger cushion against financial distress in this cycle:
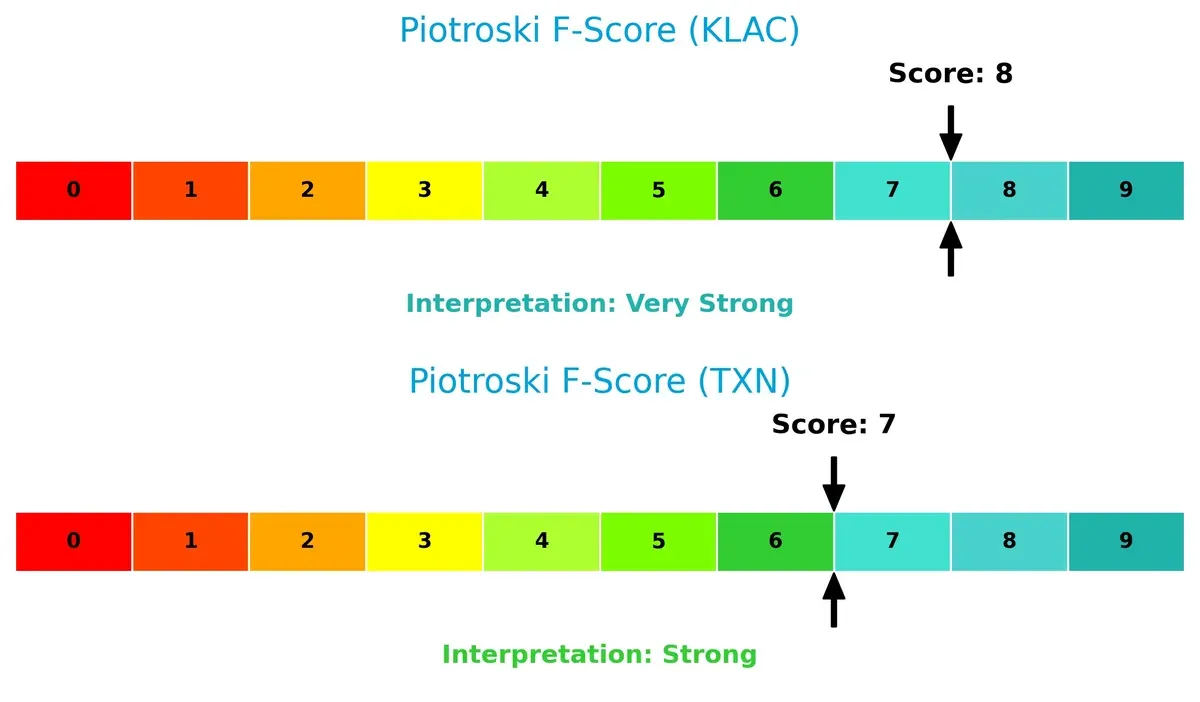
Financial Health: Quality of Operations
KLA scores an 8 on the Piotroski F-Score, edging Texas Instruments at 7. Both demonstrate robust financial health, but KLA’s higher score signals a slightly stronger internal control and operational quality with fewer red flags:
How are the two companies positioned?
This section dissects KLAC and TXN’s operational DNA by comparing revenue distribution and internal strengths and weaknesses. The goal is to confront their economic moats to reveal which model offers the most resilient competitive advantage today.
Revenue Segmentation: The Strategic Mix
The following visual comparison dissects how KLA Corporation and Texas Instruments Incorporated diversify their income streams and where their primary sector bets lie:
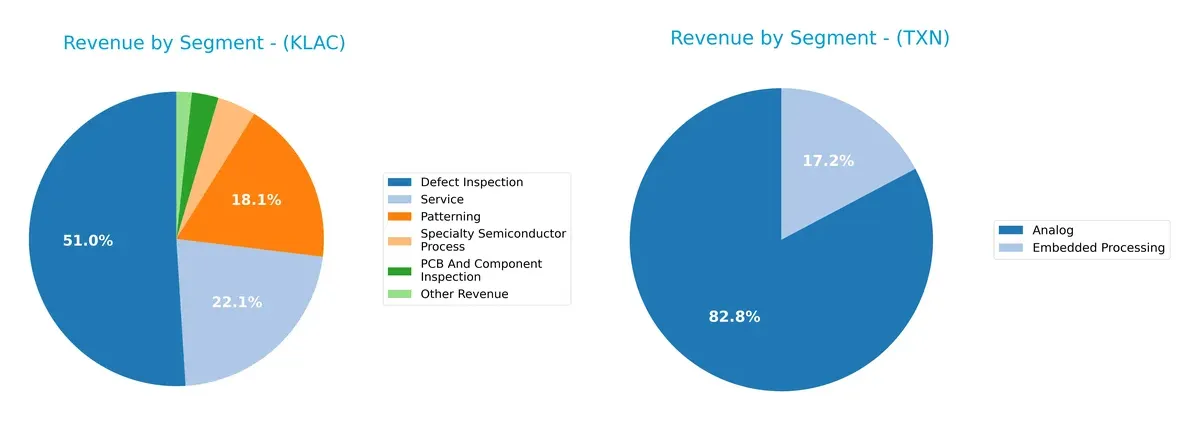
KLA relies heavily on Defect Inspection at $6.2B, anchoring its portfolio with this dominant segment. Service at $2.7B and Patterning at $2.2B provide solid diversification. In contrast, Texas Instruments pivots around Analog revenue with $12.2B, dwarfing Embedded Processing at $2.5B. TI’s concentrated Analog focus signals infrastructure dominance but exposes it to single-sector risks, while KLA’s mix suggests ecosystem lock-in through diversified semiconductor process solutions.
Strengths and Weaknesses Comparison
This table compares the strengths and weaknesses of KLA Corporation and Texas Instruments Incorporated:
KLA Corporation Strengths
- Strong profitability with 33.41% net margin and 86.56% ROE
- High ROIC of 37.97% far above WACC
- Diversified revenue streams across semiconductor process segments
- Solid global presence with strong sales in China and Taiwan
- Favorable liquidity ratios: current ratio 2.62 and quick ratio 1.83
Texas Instruments Strengths
- Robust profitability with 28.28% net margin and 30.73% ROE
- Diversified product portfolio: Analog and Embedded Processing segments
- Strong global footprint, especially in US and EMEA markets
- Favorable quick ratio of 2.83 supports short-term liquidity
- Attractive dividend yield at 3.17%, enhancing shareholder returns
KLA Corporation Weaknesses
- Elevated WACC at 10.42%, exceeding cost of capital efficiency
- High P/E (29.34) and P/B (25.39) ratios suggest premium valuation
- Debt-to-equity ratio of 1.3 indicates higher leverage risk
- Lower dividend yield at 0.76% may deter income-focused investors
- Asset turnover at 0.76 is only neutral, limiting operational efficiency
Texas Instruments Weaknesses
- Unfavorable current ratio at 4.35 may signal inefficiencies in working capital
- P/E of 31.53 and P/B of 9.69 indicate expensive valuation
- Moderate ROIC of 16.52% is less robust versus cost of capital
- Lower fixed asset turnover at 1.44 shows less efficient use of assets
- Debt-to-equity ratio of 0.86 indicates moderate leverage, slightly less conservative
KLA Corporation demonstrates superior profitability and efficient capital returns but carries valuation and leverage concerns. Texas Instruments offers strong diversification and shareholder yield but faces challenges in working capital management and operational efficiency. These factors shape each company’s strategic financial priorities.
The Moat Duel: Analyzing Competitive Defensibility
A structural moat protects long-term profits from relentless competition and market pressure. Without it, profits erode quickly. Let’s examine two semiconductor leaders’ moats:
KLA Corporation: Precision Analytics Moat
KLA’s moat stems from intangible assets and high switching costs tied to its advanced process control technology. Its ROIC outpaces WACC by 27.5%, reflecting exceptional value creation and margin stability. Continued innovation in wafer inspection deepens this moat in 2026.
Texas Instruments: Analog Strength Moat
Texas Instruments relies on cost advantage and broad analog product diversification. Unlike KLA, TI’s ROIC exceeds WACC by just 8.4%, but its declining ROIC trend flags margin pressures. Expansion into embedded processing markets offers moderate upside to defend its position.
Precision Analytics vs. Analog Breadth
KLA’s wider and growing moat outmatches TI’s narrower, declining profitability moat. KLA’s superior capital efficiency better shields it from competitive threats and market disruptions. It stands stronger to defend market share in 2026.
Which stock offers better returns?
Over the past 12 months, KLA Corporation and Texas Instruments exhibited notable bullish trends, with KLA showing strong acceleration and significant price gains compared to Texas Instruments’ steadier climb.
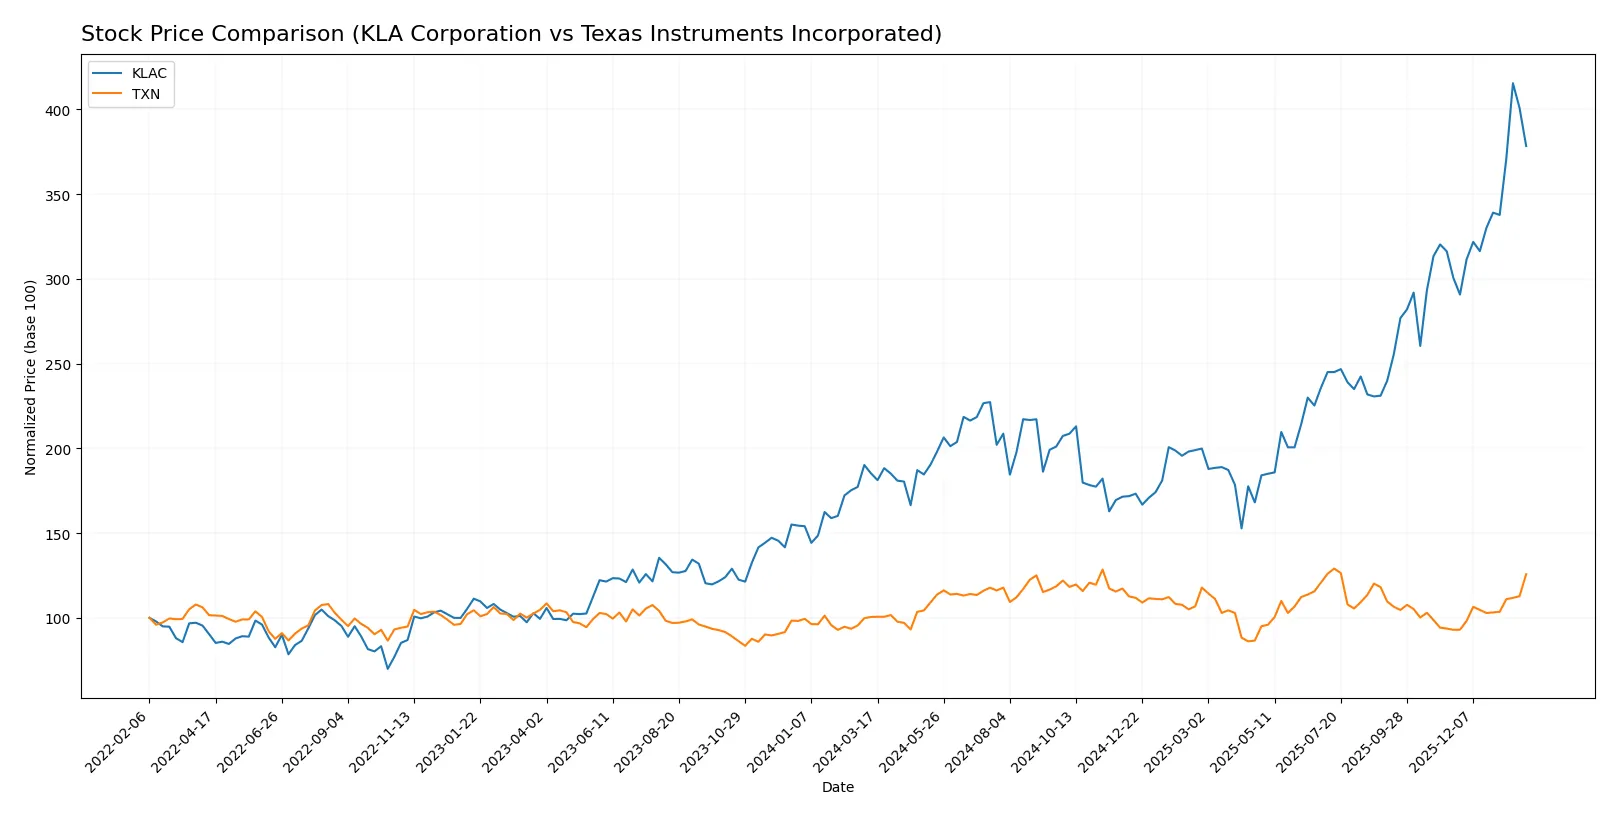
Trend Comparison
KLA Corporation’s stock surged 104.22% over the last year, showing a bullish trend with accelerating momentum and high volatility. Its price ranged from 577 to 1,568.
Texas Instruments gained 25.1% over the same period, also bullish with acceleration but much lower volatility. Its price moved between 148 and 221.
KLA clearly outperformed Texas Instruments with a more than fourfold higher price appreciation, despite higher volatility and recent slight seller dominance.
Target Prices
Analysts present a clear target price consensus for KLA Corporation and Texas Instruments Incorporated.
| Company | Target Low | Target High | Consensus |
|---|---|---|---|
| KLA Corporation | 1400 | 1900 | 1672.25 |
| Texas Instruments Incorporated | 160 | 260 | 204.64 |
The consensus target for KLA Corporation suggests upside potential from its current price of 1427.94 USD. Texas Instruments trades slightly above its consensus target of 204.64 USD, indicating moderate valuation risk.

Don’t Let Luck Decide Your Entry Point
Optimize your entry points with our advanced ProRealTime indicators. You’ll get efficient buy signals with precise price targets for maximum performance. Start outperforming now!
How do institutions grade them?
KLA Corporation Grades
The table below shows recent institutional grades for KLA Corporation from leading firms.
| Grading Company | Action | New Grade | Date |
|---|---|---|---|
| Oppenheimer | Maintain | Outperform | 2026-01-30 |
| Barclays | Maintain | Overweight | 2026-01-30 |
| Cantor Fitzgerald | Maintain | Overweight | 2026-01-30 |
| Jefferies | Maintain | Buy | 2026-01-30 |
| Stifel | Maintain | Buy | 2026-01-30 |
| Wells Fargo | Maintain | Overweight | 2026-01-30 |
| Needham | Maintain | Buy | 2026-01-30 |
| RBC Capital | Maintain | Sector Perform | 2026-01-30 |
| Deutsche Bank | Maintain | Hold | 2026-01-21 |
| Needham | Maintain | Buy | 2026-01-20 |
Texas Instruments Incorporated Grades
Below is a summary of recent institutional grades for Texas Instruments Incorporated from reputable sources.
| Grading Company | Action | New Grade | Date |
|---|---|---|---|
| Keybanc | Maintain | Overweight | 2026-01-28 |
| Deutsche Bank | Maintain | Hold | 2026-01-28 |
| Truist Securities | Maintain | Hold | 2026-01-28 |
| Cantor Fitzgerald | Maintain | Neutral | 2026-01-28 |
| Mizuho | Maintain | Underperform | 2026-01-28 |
| Stifel | Maintain | Hold | 2026-01-28 |
| UBS | Maintain | Buy | 2026-01-28 |
| Goldman Sachs | Maintain | Sell | 2026-01-28 |
| JP Morgan | Maintain | Overweight | 2026-01-28 |
| Jefferies | Maintain | Hold | 2026-01-28 |
Which company has the best grades?
KLA Corporation holds predominantly positive grades, with multiple “Buy” and “Outperform” ratings. Texas Instruments shows a mixed profile, including “Hold,” “Neutral,” and some negative ratings like “Underperform” and “Sell.” Investors may view KLA’s stronger consensus as reflecting greater confidence in its near-term prospects.
Risks specific to each company
The following categories identify critical pressure points and systemic threats facing KLA Corporation and Texas Instruments Incorporated in the 2026 market environment:
1. Market & Competition
KLA Corporation
- Operates in specialized semiconductor process control, facing intense technology innovation pressure.
Texas Instruments Incorporated
- Competes broadly in analog and embedded processing markets with diverse end-market exposure.
2. Capital Structure & Debt
KLA Corporation
- Debt-to-equity ratio at 1.3 signals higher leverage, increasing financial risk.
Texas Instruments Incorporated
- Lower debt-to-equity at 0.86 suggests more prudent leverage, enhancing financial stability.
3. Stock Volatility
KLA Corporation
- Beta of 1.444 indicates above-market volatility, raising risk in turbulent cycles.
Texas Instruments Incorporated
- Beta near 1.0 shows stock volatility aligns with market, implying moderate risk.
4. Regulatory & Legal
KLA Corporation
- Global semiconductor regulations may impact process control solutions.
Texas Instruments Incorporated
- Analog and embedded products face regulatory scrutiny, especially in automotive and industrial sectors.
5. Supply Chain & Operations
KLA Corporation
- Complex manufacturing operations and specialized equipment heighten supply chain risks.
Texas Instruments Incorporated
- Larger scale with diversified manufacturing reduces some supply chain vulnerability.
6. ESG & Climate Transition
KLA Corporation
- Increasing pressure to meet sustainability targets in semiconductor manufacturing.
Texas Instruments Incorporated
- Active initiatives in energy efficiency align with ESG trends, but challenges remain.
7. Geopolitical Exposure
KLA Corporation
- Global sales expose it to US-China tensions affecting semiconductor supply chains.
Texas Instruments Incorporated
- Broad international footprint also exposes it to geopolitical risks but with diversified risk.
Which company shows a better risk-adjusted profile?
KLA’s most impactful risk lies in elevated financial leverage and stock volatility amid a tech cycle downturn. Texas Instruments faces regulatory and geopolitical risks but benefits from stronger capital discipline and lower beta. Texas Instruments’ lower leverage and more stable stock price suggest a better risk-adjusted profile. Recent data show KLA’s debt-to-equity ratio at 1.3, signaling caution, while Texas Instruments maintains a more conservative 0.86 ratio.
Final Verdict: Which stock to choose?
KLA Corporation’s superpower lies in its exceptional capital efficiency and robust profitability that outpaces its cost of capital by a wide margin. Its rapid growth and strong returns reflect a durable competitive advantage. A point of vigilance remains its elevated debt-to-equity ratio, which could pressure financial flexibility. KLAC suits portfolios targeting aggressive growth with a tolerance for leverage risk.
Texas Instruments commands a strategic moat through steady cash flow generation and a conservative balance sheet, evidenced by a high current ratio and sustainable dividend yield. While its profitability and growth metrics trail KLAC, TXN offers better stability and income reliability. This profile fits well within GARP (Growth at a Reasonable Price) portfolios seeking steady, lower-volatility exposure.
If you prioritize high growth backed by superior ROIC and accelerating stock momentum, KLA outshines as the compelling choice due to its strong value creation and expanding moat. However, if you seek stability combined with dependable income and a more conservative financial structure, Texas Instruments offers better stability and a safer risk profile. Each presents a distinct analytical scenario aligned with different investor appetites.
Disclaimer: Investment carries a risk of loss of initial capital. The past performance is not a reliable indicator of future results. Be sure to understand risks before making an investment decision.
Go Further
I encourage you to read the complete analyses of KLA Corporation and Texas Instruments Incorporated to enhance your investment decisions: