Home > Comparison > Technology > KLAC vs TER
The strategic rivalry between KLA Corporation and Teradyne, Inc. shapes the semiconductor industry’s evolution. KLA operates as a capital-intensive process control and yield management powerhouse. Teradyne focuses on automated test equipment and industrial automation, blending manufacturing precision with robotics. This analysis pits KLA’s process mastery against Teradyne’s diversified testing and automation edge. I aim to identify which trajectory offers superior risk-adjusted returns for a diversified technology portfolio.
Table of contents
Companies Overview
KLA Corporation and Teradyne, Inc. both play pivotal roles in the global semiconductor equipment market, shaping chip manufacturing’s future.
KLA Corporation: Semiconductor Process Control Leader
KLA Corporation dominates the semiconductor process control market by designing and selling yield management and inspection solutions. Its core revenue stems from wafer inspection, metrology, and defect analysis products that enhance integrated circuit manufacturing. In 2026, KLA’s strategic focus remains on expanding its product suite across semiconductor process control and specialty manufacturing, driving innovation to improve chip yield and quality.
Teradyne, Inc.: Automated Test Equipment Specialist
Teradyne, Inc. leads in automatic test equipment for semiconductors, system tests, and industrial automation. It generates revenue primarily through semiconductor wafer and device testing platforms, serving fabless companies and foundries. Teradyne’s 2026 strategy emphasizes broadening its industrial automation robotics and wireless test solutions, aligning with rising demand in automotive, consumer electronics, and IoT sectors.
Strategic Collision: Similarities & Divergences
Both companies serve the semiconductor equipment space but diverge in business models: KLA focuses on process control and yield management, while Teradyne prioritizes test automation and robotics. Their competition centers on chipmakers’ demand for efficiency and quality assurance. Investors face distinct profiles: KLA offers precision process tools with a dominant market share, Teradyne provides diversified test and automation technologies with growth in adjacent industries.
Income Statement Comparison
This data dissects the core profitability and scalability of both corporate engines to reveal who dominates the bottom line:

| Metric | KLA Corporation (KLAC) | Teradyne, Inc. (TER) |
|---|---|---|
| Revenue | 12.2B | 2.8B |
| Cost of Revenue | 4.6B | 1.2B |
| Operating Expenses | 2.3B | 1.1B |
| Gross Profit | 7.6B | 1.6B |
| EBITDA | 5.3B | 732M |
| EBIT | 4.9B | 613M |
| Interest Expense | 302M | 3.6M |
| Net Income | 4.1B | 542M |
| EPS | 30.53 | 3.41 |
| Fiscal Year | 2025 | 2024 |
Income Statement Analysis: The Bottom-Line Duel
This income statement comparison reveals which company runs its financial engine with superior efficiency and sustainable growth momentum.
KLA Corporation Analysis
KLA’s revenue surged from 6.9B in 2021 to 12.2B in 2025, nearly doubling in five years. Net income followed, climbing from 2.1B to 4.1B. Gross margin holds strong at 62%, with net margin expanding to 33%. The latest year shows sharp EBIT growth of 41%, fueled by disciplined operating expenses and solid R&D investment, signaling robust operational momentum.
Teradyne, Inc. Analysis
Teradyne’s revenue peaked at 3.7B in 2021 but slid to 2.8B in 2024, reflecting a 9.7% decline over the period. Net income dropped 31% to 542M, with gross margin steady at 58% but net margin lower at 19%. Despite a modest 5% revenue growth last year, EBIT rose 16%, showing improved cost control, though overall profitability and growth remain challenged.
Margin Strength vs. Revenue Scale
KLA outpaces Teradyne in revenue scale and margin expansion, posting nearly three times the net income with superior profitability ratios. KLA’s consistent double-digit growth and margin improvement crown it the fundamental winner on operational efficiency and earnings power. Investors seeking growth backed by margin strength will find KLA’s profile more compelling.
Financial Ratios Comparison
These vital ratios act as a diagnostic tool to expose the underlying fiscal health, valuation premiums, and capital efficiency of the companies compared:
| Ratios | KLA Corporation (KLAC) | Teradyne, Inc. (TER) |
|---|---|---|
| ROE | 86.6% | 19.2% |
| ROIC | 38.0% | 17.2% |
| P/E | 29.3 | 36.9 |
| P/B | 25.4 | 7.1 |
| Current Ratio | 2.62 | 2.91 |
| Quick Ratio | 1.83 | 1.84 |
| D/E | 1.30 | 0.03 |
| Debt-to-Assets | 37.9% | 2.1% |
| Interest Coverage | 17.3 | 165.5 |
| Asset Turnover | 0.76 | 0.76 |
| Fixed Asset Turnover | 9.70 | 4.88 |
| Payout ratio | 22.3% | 14.1% |
| Dividend yield | 0.76% | 0.38% |
| Fiscal Year | 2025 | 2024 |
Efficiency & Valuation Duel: The Vital Signs
Financial ratios act as the company’s DNA, unveiling hidden risks and operational excellence that shape investment decisions in subtle ways.
KLA Corporation
KLA commands exceptional profitability with an 86.56% ROE and a robust 33.41% net margin, signaling operational dominance. Despite these strengths, its 29.34 P/E and 25.39 P/B ratios mark it as expensive. The modest 0.76% dividend yield suggests KLA balances shareholder returns with reinvestment in innovation and growth.
Teradyne, Inc.
Teradyne delivers solid profitability, with a 19.24% ROE and 19.23% net margin reflecting efficiency. Its valuation appears stretched, trading at a 36.93 P/E and a 7.11 P/B, higher relative to peers. The low 0.38% dividend yield highlights a focus on capital preservation, supported by a conservative debt profile and robust interest coverage.
Premium Valuation vs. Operational Safety
KLA’s extraordinary returns offset its premium valuation, while Teradyne offers a more balanced risk profile with solid efficiency and stronger balance sheet metrics. Investors favoring high operational prowess may lean toward KLA, whereas those prioritizing financial stability may find Teradyne’s profile more suitable.
Which one offers the Superior Shareholder Reward?
I see KLA Corporation (KLAC) delivers a stronger dividend yield near 0.76% with a moderate 22% payout ratio, well-covered by robust free cash flow. Its buyback program is intense, enhancing shareholder value. Teradyne, Inc. (TER) offers a lower 0.38% yield with a 14% payout but conserves cash for growth investments. TER’s buybacks are less aggressive. Historically in tech hardware, KLAC’s balanced dividend and buyback mix drives sustainable returns better than TER’s cautious approach. I favor KLAC for superior total shareholder reward in 2026.
Comparative Score Analysis: The Strategic Profile
The radar chart reveals the fundamental DNA and trade-offs of KLA Corporation and Teradyne, Inc., highlighting their financial strengths and vulnerabilities:

KLA shows superior profitability with top ROE (5) and ROA (5) scores but suffers from a weak balance sheet, reflected in its poor debt-to-equity (1) and price-to-book (1) scores. Teradyne offers a more balanced profile with moderate ROE (4) and strong asset efficiency (5), paired with a healthier debt position (4). However, Teradyne’s valuation metrics (P/E and P/B at 1 each) signal possible overvaluation risks. KLA relies heavily on operational efficiency, while Teradyne maintains steadier financial leverage.
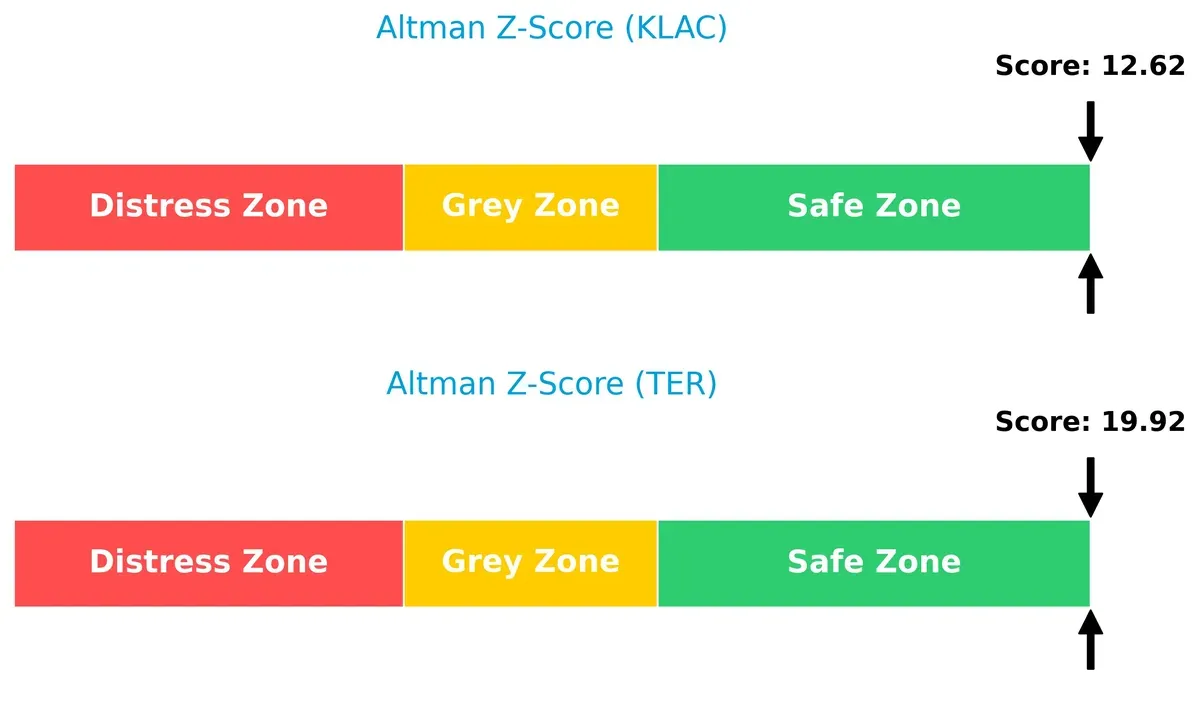
Bankruptcy Risk: Solvency Showdown
KLA’s Altman Z-Score of 12.62 versus Teradyne’s 19.92 firmly places both firms in the safe zone, indicating strong long-term solvency in this cycle:
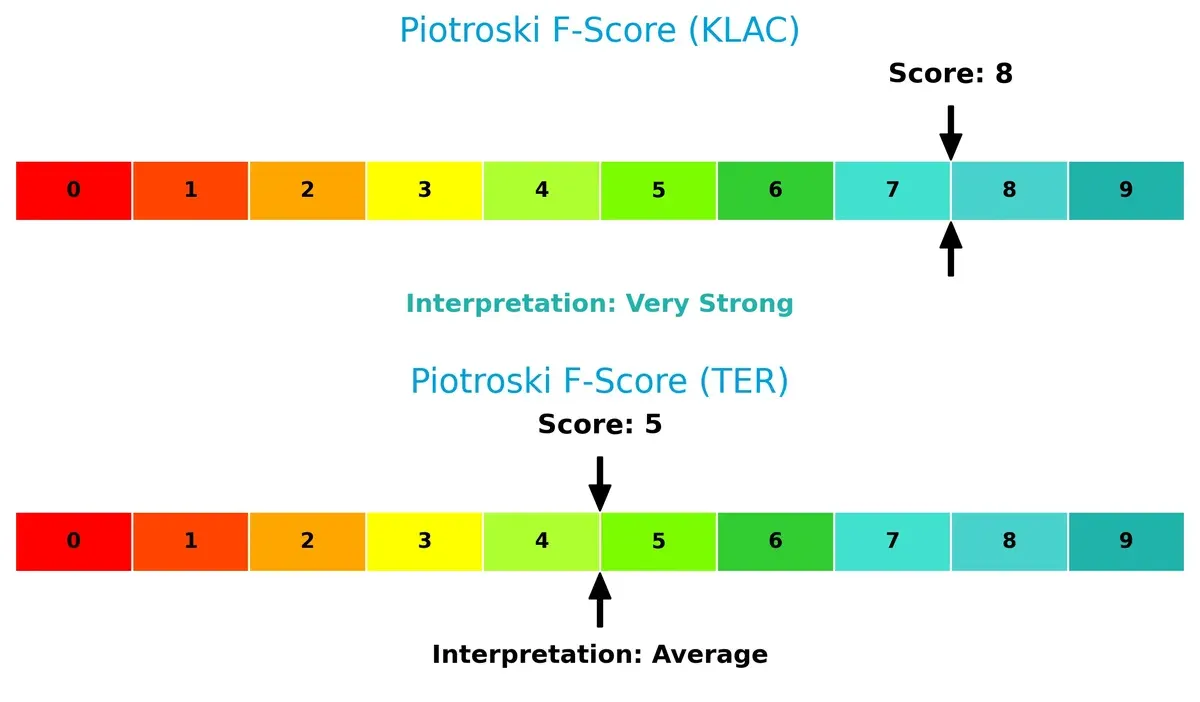
Financial Health: Quality of Operations
KLA’s Piotroski F-Score of 8 signals very strong financial health. Teradyne’s score of 5 is average, indicating some internal operational red flags compared to KLA:
How are the two companies positioned?
This section dissects KLAC and TER’s operational DNA by comparing their revenue distribution and internal dynamics. The goal is to confront their economic moats and reveal which model offers a more resilient competitive advantage today.
Revenue Segmentation: The Strategic Mix
This visual comparison dissects how KLA Corporation and Teradyne, Inc. diversify their income streams and where their primary sector bets lie:

KLA anchors its revenue in Defect Inspection at $6.2B, supplemented by strong Service ($2.7B) and Patterning ($2.2B). Teradyne pivots mostly on Product sales at $2.3B, with a smaller Service segment of $525M. KLA’s diversified portfolio across semiconductor process segments suggests ecosystem lock-in, while Teradyne’s concentration in core products poses higher exposure to market cycles but benefits from infrastructure dominance.
Strengths and Weaknesses Comparison
This table compares the Strengths and Weaknesses of KLA Corporation and Teradyne, Inc.:
KLA Corporation Strengths
- High net margin at 33.41%
- ROE extremely strong at 86.56%
- ROIC well above WACC at 37.97%
- Solid current and quick ratios above 1.8
- Diverse revenue streams including inspection and specialty semiconductor process
- Significant global presence with strong Asia and North America sales
Teradyne, Inc. Strengths
- Favorable net margin of 19.23%
- ROE and ROIC positive and above WACC
- Excellent debt management with low debt-to-equity of 0.03
- Strong interest coverage at 170.8
- Balanced revenue mix with product and service segments
- Global footprint including emerging markets and US presence
KLA Corporation Weaknesses
- WACC at 10.42% higher than ideal
- High price-to-book of 25.39 and price-to-earnings of 29.34
- Debt-to-equity ratio elevated at 1.3
- Dividend yield low at 0.76%
- Asset turnover moderate at 0.76
Teradyne, Inc. Weaknesses
- WACC elevated at 12.37%
- Price-to-earnings at 36.93 and price-to-book at 7.11 considered high
- Dividend yield low at 0.38%
- Asset turnover neutral at 0.76
KLA demonstrates superior profitability and financial leverage metrics but carries higher valuation multiples and leverage risks. Teradyne shows stronger balance sheet conservatism and a more favorable ratio profile overall, though with lower profitability margins. These contrasts suggest differing strategic priorities around growth, risk, and capital allocation.
The Moat Duel: Analyzing Competitive Defensibility
A structural moat is the only true shield guarding long-term profits from relentless competitive erosion in dynamic markets:
KLA Corporation: Precision Process Control Moat
KLA’s moat stems from intangible assets and switching costs linked to its wafer inspection technology. It sustains a very favorable 27.5% ROIC premium over WACC with growing profitability. New semiconductor process innovations in 2026 could deepen its margin stability and market grip.
Teradyne, Inc.: Automation and Test Equipment Moat
Teradyne’s competitive edge lies in its system integration and cost advantage, contrasting KLA’s asset-heavy control moat. Despite a positive ROIC spread, its declining ROIC trend signals margin pressures. Expansion into industrial automation offers growth but also intensifies competitive risks.
Moat Strength: Process Control Precision vs. Broad Automation Reach
KLA’s wider and deepening moat outmatches Teradyne’s narrower, eroding advantage. KLA’s superior ROIC growth and margin resilience position it better to defend market share amid semiconductor complexity in 2026.
Which stock offers better returns?
The past year saw strong upward moves for both KLA Corporation and Teradyne, Inc., with notable acceleration in their stock prices and distinct trading volume dynamics.
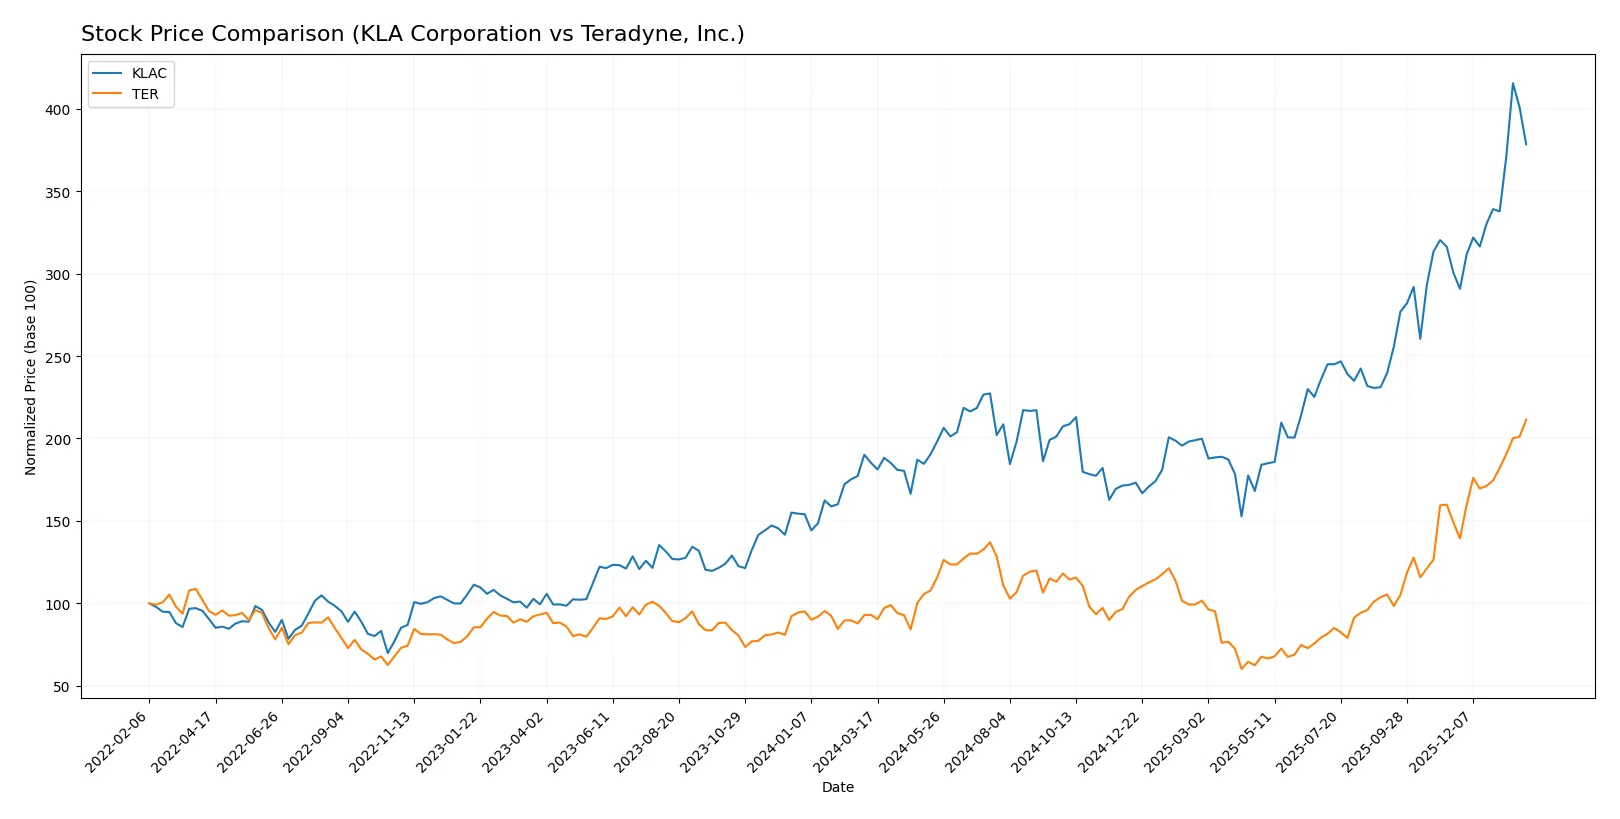
Trend Comparison
KLA Corporation’s stock rose 104.22% over 12 months, showing a bullish trend with accelerating gains and high volatility, hitting a peak near 1568. Recent months saw a 25.89% increase, but buyer dominance weakened.
Teradyne, Inc.’s stock gained 127.15% over the same period, also bullish with accelerating momentum and lower volatility. The stock reached a high of 241.05, with strong buyer dominance persisting recently and a 41.82% price rise.
Teradyne outperformed KLA with a higher overall gain and stronger buyer dominance, indicating more robust market performance over the last year.
Target Prices
Analysts present a cautiously optimistic consensus for KLA Corporation and Teradyne, Inc., suggesting upside potential from current levels.
| Company | Target Low | Target High | Consensus |
|---|---|---|---|
| KLA Corporation | 1400 | 1900 | 1672.25 |
| Teradyne, Inc. | 136 | 280 | 221.2 |
The consensus target for KLA stands about 17% above its current price of 1428, indicating moderate upside. Teradyne’s target consensus exceeds its current price by roughly 8%, reflecting cautious market optimism.

Don’t Let Luck Decide Your Entry Point
Optimize your entry points with our advanced ProRealTime indicators. You’ll get efficient buy signals with precise price targets for maximum performance. Start outperforming now!
How do institutions grade them?
Here are the latest institutional grades for KLA Corporation and Teradyne, Inc.:
KLA Corporation Grades
This table summarizes recent analyst grades for KLA Corporation from major firms.
| Grading Company | Action | New Grade | Date |
|---|---|---|---|
| Oppenheimer | Maintain | Outperform | 2026-01-30 |
| Barclays | Maintain | Overweight | 2026-01-30 |
| Cantor Fitzgerald | Maintain | Overweight | 2026-01-30 |
| Jefferies | Maintain | Buy | 2026-01-30 |
| Stifel | Maintain | Buy | 2026-01-30 |
| Wells Fargo | Maintain | Overweight | 2026-01-30 |
| Needham | Maintain | Buy | 2026-01-30 |
| RBC Capital | Maintain | Sector Perform | 2026-01-30 |
| Deutsche Bank | Maintain | Hold | 2026-01-21 |
| Needham | Maintain | Buy | 2026-01-20 |
Teradyne, Inc. Grades
Below are recent grades given to Teradyne, Inc. by prominent institutional analysts.
| Grading Company | Action | New Grade | Date |
|---|---|---|---|
| Stifel | Maintain | Buy | 2026-01-30 |
| UBS | Maintain | Buy | 2026-01-26 |
| B of A Securities | Maintain | Buy | 2026-01-22 |
| Stifel | Maintain | Buy | 2026-01-14 |
| B of A Securities | Maintain | Buy | 2026-01-13 |
| Goldman Sachs | Upgrade | Buy | 2025-12-16 |
| Stifel | Upgrade | Buy | 2025-12-02 |
| Citigroup | Maintain | Buy | 2025-11-12 |
| UBS | Maintain | Buy | 2025-10-30 |
| JP Morgan | Maintain | Neutral | 2025-10-30 |
Which company has the best grades?
Both companies show strong institutional support with mostly “Buy” or equivalent ratings. KLA’s grades are broader, including some “Outperform” and “Overweight” labels, indicating slightly stronger analyst conviction. Teradyne has more consistent “Buy” grades but includes a “Neutral” from JP Morgan. Investors may interpret KLA’s marginally higher grades as a signal of greater confidence by analysts.
Risks specific to each company
The following categories identify critical pressure points and systemic threats facing KLA Corporation and Teradyne, Inc. in the 2026 market environment:
1. Market & Competition
KLA Corporation
- Faces intense competition in semiconductor process control, risking margin pressure.
Teradyne, Inc.
- Operates in diverse segments yet competes aggressively in automated test equipment.
2. Capital Structure & Debt
KLA Corporation
- Higher debt-to-equity ratio (1.3) raises financial risk. Interest coverage strong but leverage unfavorable.
Teradyne, Inc.
- Very low debt-to-equity (0.03) indicates conservative capital structure and low financial risk.
3. Stock Volatility
KLA Corporation
- Beta of 1.44 shows moderate sensitivity to market swings; recent 15% price drop signals risk.
Teradyne, Inc.
- Higher beta at 1.82 implies greater volatility; recent 4.3% decline less severe proportionally.
4. Regulatory & Legal
KLA Corporation
- Semiconductor industry faces evolving export controls and IP risks globally.
Teradyne, Inc.
- Exposure to defense and wireless sectors increases regulatory scrutiny but diversifies risk.
5. Supply Chain & Operations
KLA Corporation
- Complex semiconductor manufacturing supply chain vulnerable to component shortages.
Teradyne, Inc.
- Diversified product lines reduce supply chain concentration risk but add operational complexity.
6. ESG & Climate Transition
KLA Corporation
- Pressure to reduce carbon footprint in energy-intensive semiconductor processes.
Teradyne, Inc.
- Active in industrial automation, potentially benefiting from energy efficiency trends.
7. Geopolitical Exposure
KLA Corporation
- Significant exposure to US-China trade tensions impacting semiconductor equipment sales.
Teradyne, Inc.
- Geopolitical risks mitigated by broader product applications and US defense contracts.
Which company shows a better risk-adjusted profile?
Teradyne’s low leverage and diversified operations form a sturdier risk-adjusted profile. KLA’s higher debt and sector concentration elevate its risk, despite strong profitability. Teradyne’s Altman Z-score near 20 confirms financial safety, while KLA’s robust Piotroski score of 8 shows operational strength but financial risk lingers.
Final Verdict: Which stock to choose?
KLA Corporation’s superpower lies in its exceptional capital efficiency and soaring profitability, outpacing industry norms with a very favorable moat. Its main point of vigilance remains its elevated leverage, which could amplify risks in downturns. This stock suits portfolios targeting aggressive growth with a tolerance for financial risk.
Teradyne, Inc. boasts a strategic moat grounded in strong balance sheet discipline and consistent free cash flow generation. Its lower debt and safer financial profile make it a steadier choice than KLA. Teradyne fits well within GARP portfolios seeking growth backed by relative stability and prudent capital allocation.
If you prioritize high returns on invested capital and are comfortable with leverage, KLA outshines as the compelling growth engine. However, if you seek better financial stability and a resilient cash flow profile, Teradyne offers superior safety at a reasonable growth premium. Both present attractive but distinct scenarios depending on your risk appetite and investment horizon.
Disclaimer: Investment carries a risk of loss of initial capital. The past performance is not a reliable indicator of future results. Be sure to understand risks before making an investment decision.
Go Further
I encourage you to read the complete analyses of KLA Corporation and Teradyne, Inc. to enhance your investment decisions: