Home > Comparison > Technology > TSM vs KLAC
The strategic rivalry between Taiwan Semiconductor Manufacturing Company Limited and KLA Corporation shapes the future of the semiconductor sector. TSM operates as a capital-intensive foundry giant, specializing in wafer fabrication at scale. In contrast, KLAC excels as a high-tech equipment provider focusing on process control and yield management. This analysis will reveal which company’s operational model offers a superior risk-adjusted return potential for a diversified portfolio amid evolving industry dynamics.
Table of contents
Companies Overview
Taiwan Semiconductor Manufacturing Company Limited and KLA Corporation dominate critical segments of the semiconductor industry.
Taiwan Semiconductor Manufacturing Company Limited: Leading Pure-Play Foundry
Taiwan Semiconductor Manufacturing Company Limited stands as the world’s largest semiconductor foundry. It generates revenue by manufacturing, packaging, and testing integrated circuits, serving sectors like high-performance computing and smartphones. In 2026, it focuses heavily on advancing wafer fabrication processes, including CMOS and mixed-signal technologies, to sustain its leadership in a fiercely competitive global market.
KLA Corporation: Semiconductor Process Control Pioneer
KLA Corporation specializes in process control and yield management solutions for semiconductor manufacturing. Its revenue stems from inspection, metrology, and defect analysis products that enhance wafer fabrication efficiency. In 2026, KLA emphasizes expanding advanced inspection technologies and software-driven process controls to meet rising demands for semiconductor quality and manufacturing precision worldwide.
Strategic Collision: Similarities & Divergences
Both companies serve the semiconductor industry but with contrasting philosophies—TSMC operates a capital-intensive foundry model, while KLA provides high-tech process control tools and software. They compete indirectly, with TSMC focused on chip production and KLA on manufacturing optimization. Their distinct investment profiles reflect this: TSMC embodies scale and manufacturing prowess; KLA offers specialized technology leadership and exposure to semiconductor equipment demand cycles.
Income Statement Comparison
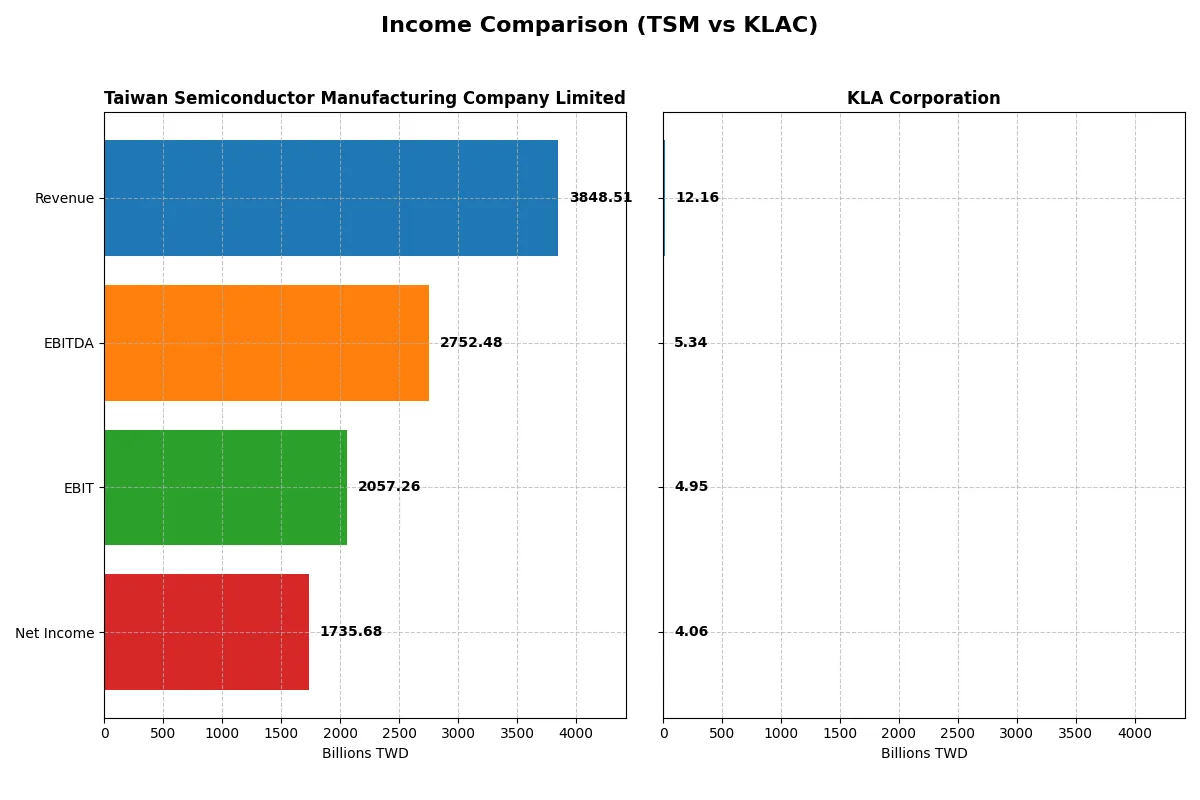
This data dissects the core profitability and scalability of both corporate engines to reveal who dominates the bottom line:
| Metric | Taiwan Semiconductor Manufacturing Company Limited (TSM) | KLA Corporation (KLAC) |
|---|---|---|
| Revenue | 3.85T TWD | 12.16B USD |
| Cost of Revenue | 1.54T TWD | 4.58B USD |
| Operating Expenses | 349.2B TWD | 2.33B USD |
| Gross Profit | 2.30T TWD | 7.58B USD |
| EBITDA | 2.75T TWD | 5.34B USD |
| EBIT | 2.06T TWD | 4.95B USD |
| Interest Expense | 0 | 302M USD |
| Net Income | 1.74T TWD | 4.06B USD |
| EPS | 334.6 TWD | 30.53 USD |
| Fiscal Year | 2025 | 2025 |
Income Statement Analysis: The Bottom-Line Duel
This income statement comparison unveils the true operational efficiency and profitability trajectory of two semiconductor sector leaders.
Taiwan Semiconductor Manufacturing Company Limited Analysis
TSM’s revenue jumps from 1.59T TWD in 2021 to 3.85T TWD in 2025, showing robust growth. Net income expands even faster, reaching 1.74T TWD in 2025. Its gross margin holds strong near 60%, while net margin climbs to 45.1%, reflecting superior cost control and operating leverage in the latest fiscal year.
KLA Corporation Analysis
KLAC grows revenue from $6.92B in 2021 to $12.16B in 2025, with net income nearly doubling to $4.06B. The company sustains a higher gross margin at 62.3% but a lower net margin of 33.4% compared to TSM. KLAC’s EBIT margin at 40.7% signals solid efficiency gains and momentum in profitability over the latest year.
Margin Leadership vs. Scale Expansion
TSM delivers stronger net margins and faster bottom-line growth, doubling net income over five years with excellent operating efficiency. KLAC matches this with higher gross margins and steady revenue gains but lags in net margin expansion. For investors, TSM’s profile appeals more to those prioritizing margin power and earnings growth, while KLAC offers a balanced mix of scale and consistent profitability.
Financial Ratios Comparison
These vital ratios act as a diagnostic tool to expose the underlying fiscal health, valuation premiums, and capital efficiency of the companies compared below:
| Ratios | Taiwan Semiconductor Manufacturing Company Limited (TSM) | KLA Corporation (KLAC) |
|---|---|---|
| ROE | 32.1% | 86.6% |
| ROIC | 24.9% | 38.0% |
| P/E | 28.5 | 29.3 |
| P/B | 9.14 | 25.39 |
| Current Ratio | 2.62 | 2.62 |
| Quick Ratio | 2.42 | 1.83 |
| D/E | 0.18 | 1.30 |
| Debt-to-Assets | 12.5% | 37.9% |
| Interest Coverage | 0 (not available) | 17.3 |
| Asset Turnover | 0.49 | 0.76 |
| Fixed Asset Turnover | 1.05 | 9.70 |
| Payout ratio | 27.2% | 22.3% |
| Dividend yield | 0.95% | 0.76% |
| Fiscal Year | 2025 | 2025 |
Efficiency & Valuation Duel: The Vital Signs
Financial ratios act as a company’s DNA, exposing both hidden risks and operational strengths crucial for investment insight.
Taiwan Semiconductor Manufacturing Company Limited
TSM exhibits robust profitability with a 32.12% ROE and a strong 45.1% net margin, signaling operational excellence. However, its valuation is stretched, with a high P/E of 28.45 and P/B of 9.14. Shareholder returns include a modest 0.95% dividend yield, balancing growth reinvestment in R&D.
KLA Corporation
KLAC commands an exceptional 86.56% ROE and a solid 33.41% net margin, reflecting high efficiency. Yet, it trades at a premium with a P/E of 29.34 and an elevated P/B of 25.39, coupled with a concerning debt-to-equity ratio of 1.3. Dividends yield 0.76%, indicating limited cash return amid growth focus.
Premium Valuation vs. Operational Safety
TSM offers a more balanced risk profile with favorable leverage and consistent profitability despite stretched valuation multiples. KLAC’s extraordinary returns come with higher debt and valuation risks. Investors seeking operational safety may prefer TSM, while those favoring aggressive growth might lean toward KLAC’s profile.
Which one offers the Superior Shareholder Reward?
I observe that Taiwan Semiconductor Manufacturing Company (TSM) delivers a higher dividend yield around 1.08% with a payout ratio near 31%, signaling steady income. KLA Corporation (KLAC) yields about 0.76% with a lower payout near 22%, retaining more cash for growth. TSM’s free cash flow coverage of dividends remains solid at 1.35x, supporting sustainability. KLAC invests heavily in buybacks, with free cash flow nearly 92% reinvested, intensifying shareholder returns beyond dividends. Historically, TSM balances dividends and buybacks conservatively, sustaining long-term value. KLAC’s aggressive buybacks risk leverage, given its higher debt ratios. I conclude TSM offers a more reliable and sustainable total return profile in 2026, appealing to income-focused investors seeking prudent capital allocation.
Comparative Score Analysis: The Strategic Profile
The radar chart reveals the fundamental DNA and trade-offs of Taiwan Semiconductor Manufacturing Company Limited and KLA Corporation:
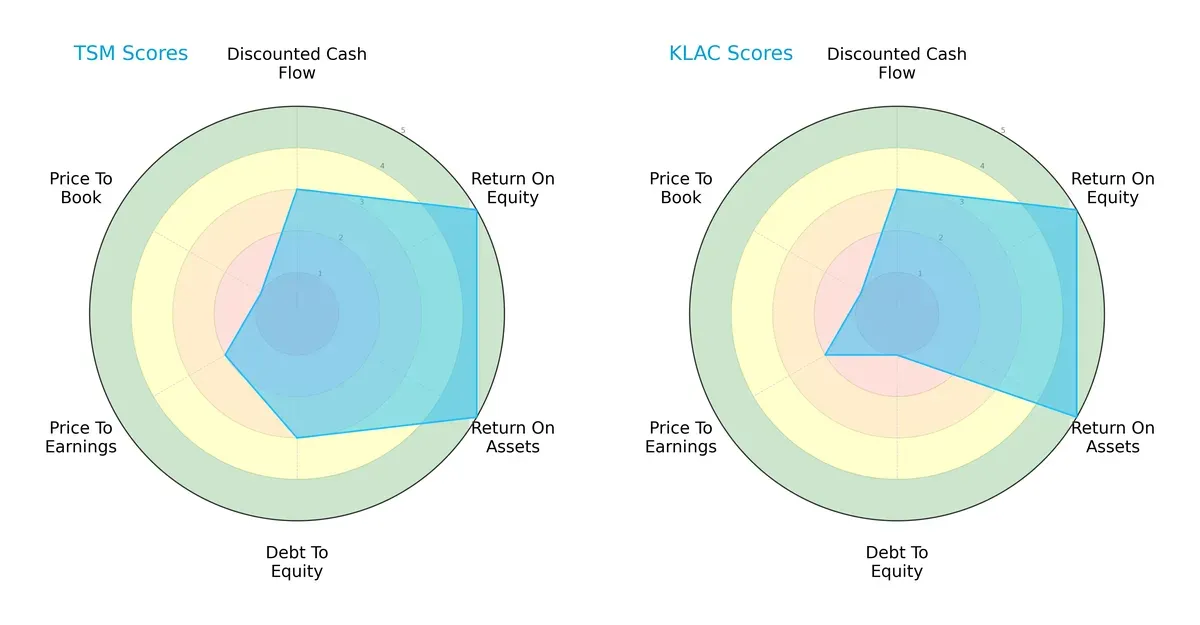
Both companies excel with top-tier ROE and ROA scores of 5, indicating superior profitability and asset efficiency. TSM shows a moderate debt-to-equity score (3), suggesting balanced leverage, while KLAC’s low score (1) signals higher financial risk. Valuation metrics (P/E and P/B) are equally weak for both, hinting at potential overvaluation or market skepticism. Overall, TSM presents a more balanced financial profile; KLAC relies more heavily on operational efficiency but carries greater leverage risk.
Bankruptcy Risk: Solvency Showdown
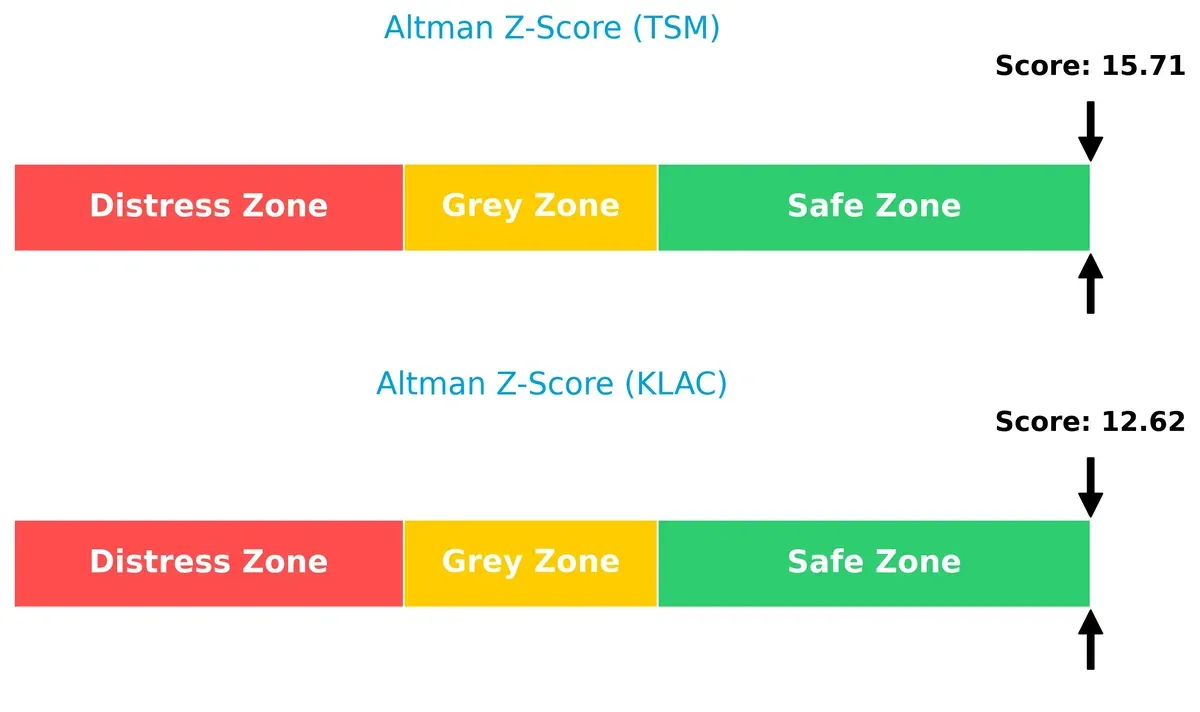
The Altman Z-Scores place both firms firmly in the safe zone, with TSM at 15.7 and KLAC at 12.6, reflecting strong financial stability and very low bankruptcy risk in this cycle:
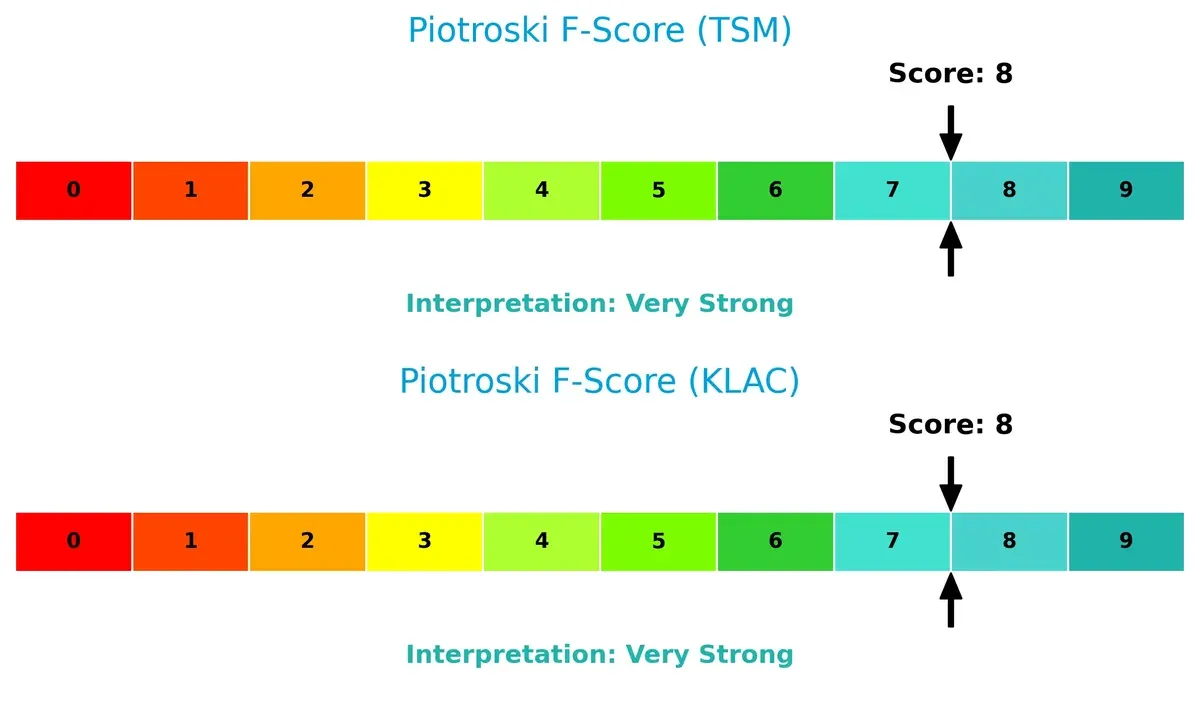
Financial Health: Quality of Operations
Both companies score an impressive 8 on the Piotroski F-Score, signaling very strong financial health and operational quality. Neither shows red flags, confirming robust internal metrics and sound management execution:
How are the two companies positioned?
This section dissects TSM and KLAC’s operational DNA by comparing their revenue distribution by segment and analyzing their internal strengths and weaknesses. The final objective is to confront their economic moats to reveal which offers the most resilient, sustainable competitive advantage today.
Revenue Segmentation: The Strategic Mix
This visual comparison dissects how Taiwan Semiconductor Manufacturing Company and KLA Corporation diversify their income streams and where their primary sector bets lie:
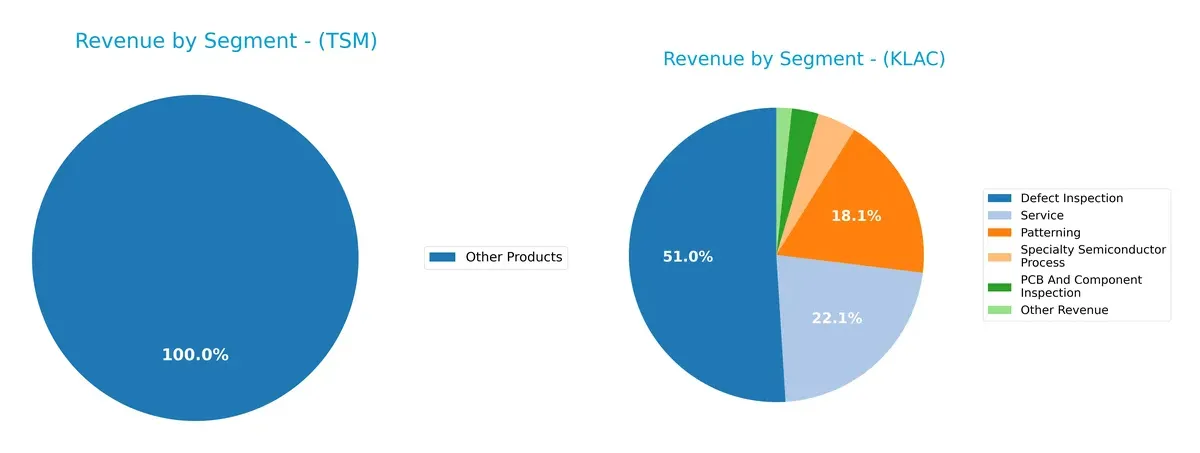
Taiwan Semiconductor Manufacturing Company anchors its revenue in wafer sales, with 1.99T TWD in 2022, dwarfing other product lines. This concentration reflects its infrastructure dominance in semiconductor manufacturing. In contrast, KLA Corporation exhibits a more diversified mix, with defect inspection leading at $6.2B in 2025, supported by service and patterning segments. KLA’s spread reduces concentration risk, leveraging ecosystem lock-in across semiconductor process stages.
Strengths and Weaknesses Comparison
This table compares the strengths and weaknesses of TSM and KLAC based on diversification, profitability, financials, innovation, global presence, and market share:
TSM Strengths
- High net margin at 45.1%
- Strong ROE of 32.12%
- Favorable ROIC at 24.92%
- Low debt-to-equity at 0.18
- Robust current and quick ratios above 2.4
- Diverse revenue streams including wafer and other products
- Significant global presence, especially in the US and China
KLAC Strengths
- Very high ROE at 86.56%
- Outstanding ROIC at 37.97%
- Favorable net margin of 33.41%
- Strong interest coverage at 16.37
- High fixed asset turnover at 9.7
- Diverse product segments including patterning and defect inspection
- Global footprint across China, North America, and Asia
TSM Weaknesses
- Unfavorable P/E of 28.45 and PB of 9.14 suggest high valuation
- Lower asset turnover at 0.49
- Dividend yield below 1%
- Neutral WACC at 9.69%
- Limited innovation metrics disclosed
- Market share concentration in wafers
KLAC Weaknesses
- Elevated debt-to-equity at 1.3 raises leverage concerns
- Unfavorable P/E of 29.34 and very high PB of 25.39
- Dividend yield under 1%
- WACC unfavorable at 10.42%
- Asset turnover only neutral at 0.76
- Less revenue scale compared to TSM, smaller global sales volume
TSM’s strengths lie in solid profitability with conservative leverage and strong liquidity, balanced by valuation and turnover challenges. KLAC excels in capital efficiency and product diversification but carries higher leverage and valuation risks. Each company’s profile reveals strategic trade-offs between growth, risk, and market positioning.
The Moat Duel: Analyzing Competitive Defensibility
A structural moat is the only barrier protecting long-term profits from relentless competitive erosion. Let’s dissect the moats of two semiconductor giants:
Taiwan Semiconductor Manufacturing Company Limited: Cost Leadership Moat
TSMC’s moat stems from its unmatched cost advantage through scale and advanced manufacturing. Its 15.2% excess ROIC over WACC confirms efficient capital use and margin resilience. Expanding into newer process nodes in 2026 should deepen this moat further.
KLA Corporation: Technology-Driven Process Control Moat
KLA’s moat relies on proprietary process control technology, contrasting TSMC’s cost focus. It boasts a stronger 27.5% ROIC premium over WACC and a faster ROIC growth trend. Its innovation pipeline in metrology tools positions it well for emerging semiconductor complexity.
Scale Dominance vs. Precision Innovation: The Moat Verdict
While KLA enjoys a deeper moat with higher ROIC spread and growth, TSMC’s scale-based cost moat delivers a wider competitive footprint. I view KLA as better equipped to protect and expand profitability amid rising semiconductor manufacturing complexity.
Which stock offers better returns?
The past year shows strong price gains for both Taiwan Semiconductor Manufacturing Company Limited and KLA Corporation, with dynamic trading patterns and accelerating upward trends.
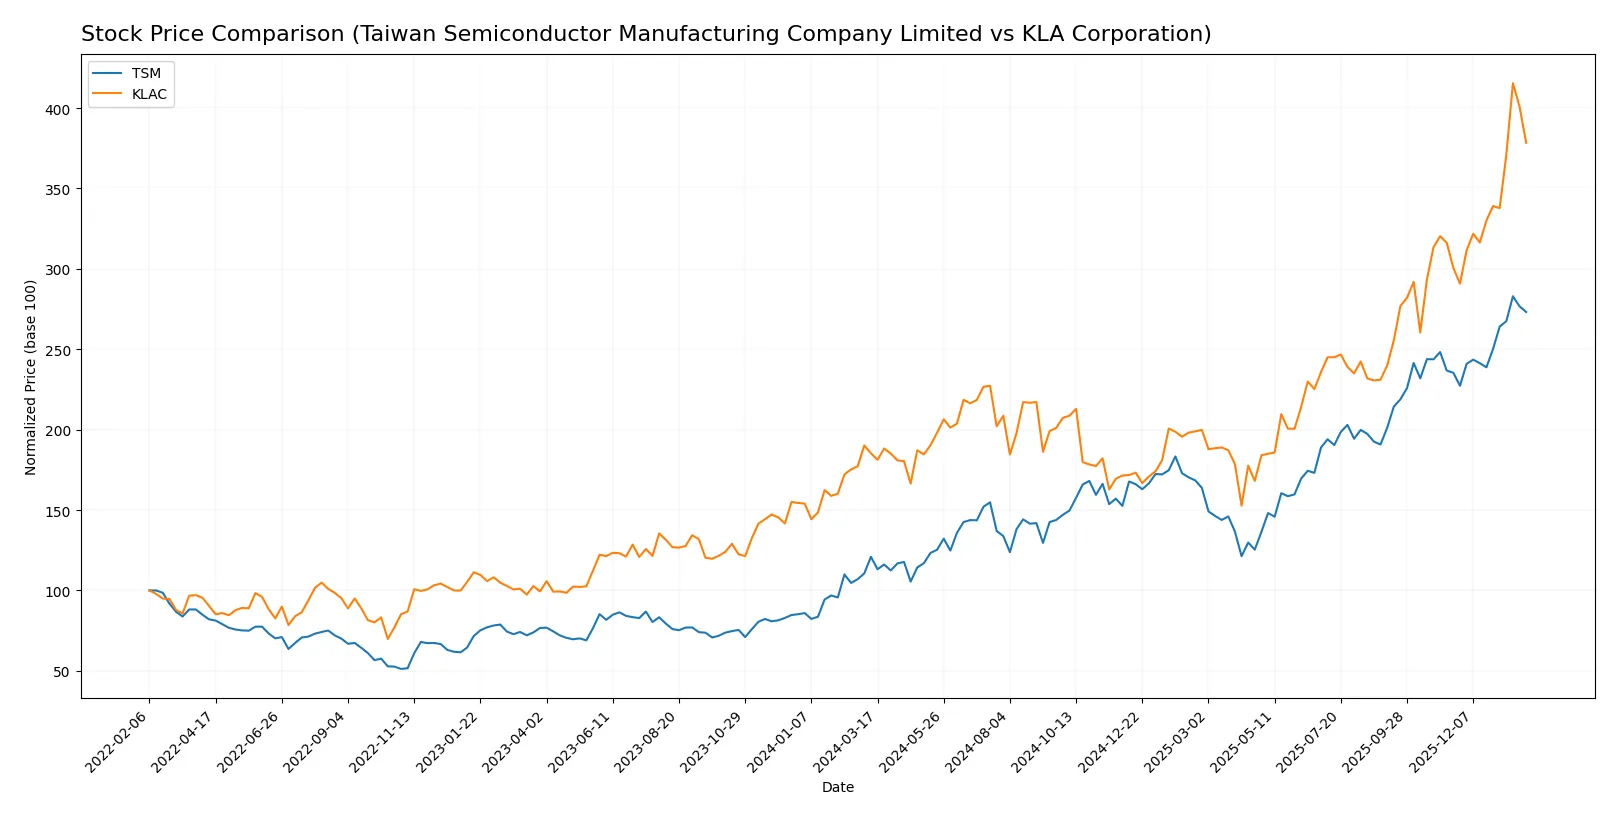
Trend Comparison
Taiwan Semiconductor Manufacturing Company Limited’s stock rose 125.84% over the past 12 months, showing a bullish trend with accelerating momentum and a standard deviation of 53.6. It hit a high of 342.4 and a low of 127.7.
KLA Corporation’s stock increased 104.22% over the last year, also bullish with acceleration but higher volatility at a 213.25 standard deviation. Its price range spanned from 576.53 to 1567.82.
TSM outperformed KLAC in market gains over the year, delivering a stronger total return despite KLAC’s higher volatility and wider price swings.
Target Prices
Analysts present a robust target price consensus for Taiwan Semiconductor Manufacturing Company Limited and KLA Corporation.
| Company | Target Low | Target High | Consensus |
|---|---|---|---|
| Taiwan Semiconductor Manufacturing Company Limited | 330 | 450 | 397.5 |
| KLA Corporation | 1400 | 1900 | 1672.25 |
The consensus target for TSM sits about 20% above its current price of 330.56, signaling moderate upside. KLAC’s consensus target exceeds its 1427.94 share price by roughly 17%, reflecting cautious optimism among analysts.

Don’t Let Luck Decide Your Entry Point
Optimize your entry points with our advanced ProRealTime indicators. You’ll get efficient buy signals with precise price targets for maximum performance. Start outperforming now!
How do institutions grade them?
Taiwan Semiconductor Manufacturing Company Limited Grades
The latest institutional grades for TSM from major firms are summarized below:
| Grading Company | Action | New Grade | Date |
|---|---|---|---|
| TD Cowen | Maintain | Hold | 2026-01-16 |
| Barclays | Maintain | Overweight | 2026-01-16 |
| Needham | Maintain | Buy | 2026-01-15 |
| Bernstein | Maintain | Outperform | 2025-12-08 |
| Needham | Maintain | Buy | 2025-10-27 |
| Barclays | Maintain | Overweight | 2025-10-17 |
| Needham | Maintain | Buy | 2025-10-16 |
| Susquehanna | Maintain | Positive | 2025-10-10 |
| Barclays | Maintain | Overweight | 2025-10-09 |
| Barclays | Maintain | Overweight | 2025-09-16 |
KLA Corporation Grades
Below is the table of recent reliable grades for KLAC from reputable institutions:
| Grading Company | Action | New Grade | Date |
|---|---|---|---|
| Oppenheimer | Maintain | Outperform | 2026-01-30 |
| Barclays | Maintain | Overweight | 2026-01-30 |
| Cantor Fitzgerald | Maintain | Overweight | 2026-01-30 |
| Jefferies | Maintain | Buy | 2026-01-30 |
| Stifel | Maintain | Buy | 2026-01-30 |
| Wells Fargo | Maintain | Overweight | 2026-01-30 |
| Needham | Maintain | Buy | 2026-01-30 |
| RBC Capital | Maintain | Sector Perform | 2026-01-30 |
| Deutsche Bank | Maintain | Hold | 2026-01-21 |
| Needham | Maintain | Buy | 2026-01-20 |
Which company has the best grades?
KLAC consistently receives higher grades such as Outperform and multiple Buy ratings, indicating stronger institutional confidence. TSM’s grades range from Hold to Buy, suggesting more cautious optimism. This difference may influence investor perception of growth potential and risk.
Risks specific to each company
The following categories identify the critical pressure points and systemic threats facing both firms in the 2026 market environment:
1. Market & Competition
Taiwan Semiconductor Manufacturing Company Limited
- Dominates foundry market with scale but faces rising competition from US and Chinese fabs.
KLA Corporation
- Leads in semiconductor process control but faces cyclicality and aggressive technology shifts.
2. Capital Structure & Debt
Taiwan Semiconductor Manufacturing Company Limited
- Maintains low debt (D/E 0.18), strong interest coverage, and conservative leverage.
KLA Corporation
- Carries higher debt (D/E 1.3) with solid interest coverage but increased financial risk.
3. Stock Volatility
Taiwan Semiconductor Manufacturing Company Limited
- Beta 1.27 signals moderate volatility, reflecting semiconductor sector cyclicality.
KLA Corporation
- Higher beta 1.44 implies greater stock price swings and market sensitivity.
4. Regulatory & Legal
Taiwan Semiconductor Manufacturing Company Limited
- Exposed to Taiwan-China political risks and export controls affecting supply chains.
KLA Corporation
- Faces US regulatory scrutiny but benefits from stable domestic legal environment.
5. Supply Chain & Operations
Taiwan Semiconductor Manufacturing Company Limited
- Relies heavily on Taiwan-based manufacturing; supply chain disruptions pose risks.
KLA Corporation
- Global operations with diversified supplier base reduce single-point supply risks.
6. ESG & Climate Transition
Taiwan Semiconductor Manufacturing Company Limited
- Progresses in sustainability but energy-intensive fabs challenge carbon reduction goals.
KLA Corporation
- Advances in clean tech integration but must manage manufacturing waste and emissions.
7. Geopolitical Exposure
Taiwan Semiconductor Manufacturing Company Limited
- High geopolitical risk due to Taiwan location and US-China tensions.
KLA Corporation
- Primarily US-based, with less direct geopolitical exposure but subject to trade tensions.
Which company shows a better risk-adjusted profile?
Taiwan Semiconductor’s biggest risk is geopolitical exposure in Taiwan, threatening operations amid rising US-China tensions. KLA’s primary risk lies in elevated financial leverage, increasing vulnerability to interest rate hikes and downturns. Despite TSM’s geopolitical stakes, its conservative debt and robust liquidity create a stronger risk-adjusted profile. KLA’s higher debt-to-equity ratio and stock volatility raise caution despite solid operational diversification. Notably, TSM’s Altman Z-Score of 15.7 versus KLAC’s 12.6 confirms superior financial stability, reinforcing my concern over KLA’s leverage risk.
Final Verdict: Which stock to choose?
Taiwan Semiconductor Manufacturing Company Limited (TSM) operates as a cash machine with a durable competitive moat, driven by consistently superior ROIC versus WACC. Its unmatched operational efficiency fuels robust profitability and growth. The point of vigilance lies in its relatively high valuation multiples, which might temper near-term upside. It suits portfolios seeking aggressive growth anchored in industry leadership.
KLA Corporation (KLAC) commands a strategic moat through its advanced semiconductor equipment dominance and recurring revenue streams. While riskier in leverage compared to TSM, KLAC offers higher ROE and a faster ROIC growth trend, underpinning its value creation. It fits well with GARP investors who favor growth paired with reasonable valuation discipline and operational safety.
If you prioritize durable operational efficiency and market leadership with a strong balance sheet, TSM is the compelling choice due to its sustained value creation and cash flow generation. However, if you seek higher returns on invested capital combined with a strong growth trajectory backed by a specialized moat, KLAC offers better growth potential albeit with elevated leverage risk. Both present very favorable economic moats but appeal to distinct investor profiles.
Disclaimer: Investment carries a risk of loss of initial capital. The past performance is not a reliable indicator of future results. Be sure to understand risks before making an investment decision.
Go Further
I encourage you to read the complete analyses of Taiwan Semiconductor Manufacturing Company Limited and KLA Corporation to enhance your investment decisions: