Home > Comparison > Technology > KLAC vs STM
The strategic rivalry between KLA Corporation and STMicroelectronics N.V. shapes the semiconductor industry’s evolution. KLA operates as a capital-intensive process control leader, while STMicroelectronics drives growth through diversified analog and microcontroller solutions. This head-to-head pits specialized precision technology against broad-based semiconductor manufacturing. This analysis will determine which corporate trajectory offers superior risk-adjusted returns for portfolios seeking exposure to the dynamic technology sector.
Table of contents
Companies Overview
KLA Corporation and STMicroelectronics N.V. stand as pivotal players shaping the semiconductor industry landscape.
KLA Corporation: Precision Process Control Leader
KLA Corporation dominates semiconductor process control with integrated inspection and metrology solutions. Its revenue stems from wafer and substrate defect inspection, process management software, and specialty semiconductor manufacturing. In 2026, KLA sharpens focus on advanced semiconductor yield management, positioning itself as the backbone of chipmakers’ quality assurance.
STMicroelectronics N.V.: Broad-Spectrum Semiconductor Innovator
STMicroelectronics thrives as a diversified semiconductor manufacturer with a strong presence in automotive, analog, and microcontroller markets. Its core revenue comes from automotive ICs, MEMS sensors, and microcontrollers. In 2026, ST emphasizes expanding its footprint in automotive electronics and industrial applications, leveraging innovation across analog and digital product lines.
Strategic Collision: Similarities & Divergences
KLA’s precision process control contrasts with ST’s diversified semiconductor manufacturing approach. Both battle for dominance in semiconductor innovation but occupy distinct niches: KLA secures manufacturing yield; ST drives end-device functionality. Their investment profiles diverge sharply—KLA offers exposure to capital equipment, while ST delivers broad semiconductor market participation.
Income Statement Comparison
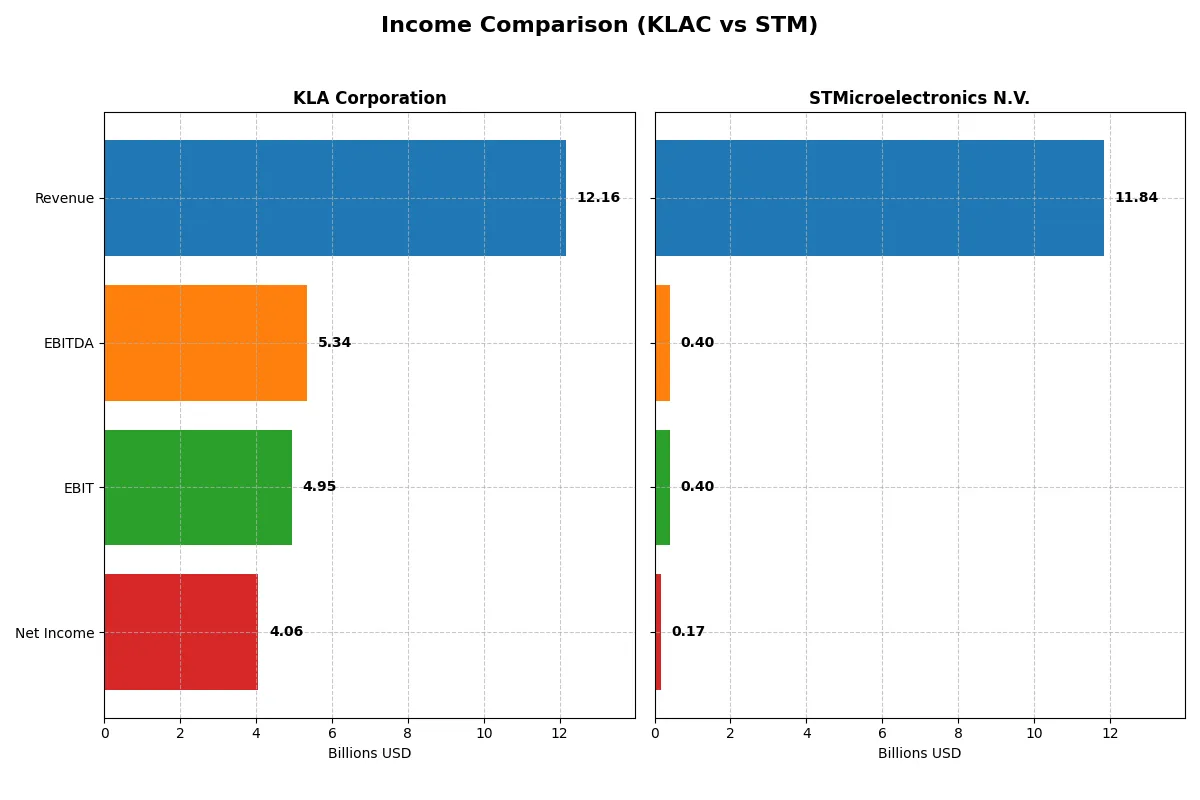
The following data dissects the core profitability and scalability of both corporate engines to reveal who dominates the bottom line:
| Metric | KLA Corporation (KLAC) | STMicroelectronics N.V. (STM) |
|---|---|---|
| Revenue | 12.2B | 11.8B |
| Cost of Revenue | 4.6B | 7.8B |
| Operating Expenses | 2.3B | 3.7B |
| Gross Profit | 7.6B | 4.0B |
| EBITDA | 5.3B | 401M |
| EBIT | 4.9B | 401M |
| Interest Expense | 302M | 0 |
| Net Income | 4.1B | 0 |
| EPS | 30.53 | 0.19 |
| Fiscal Year | 2025 | 2025 |
Income Statement Analysis: The Bottom-Line Duel
This income statement comparison reveals the true efficiency and profitability trajectory of two semiconductor industry leaders.
KLA Corporation Analysis
KLA’s revenue surged from 6.9B in 2021 to 12.2B in 2025, nearly doubling its net income from 2.1B to 4.1B. Its gross margin consistently exceeds 62%, while the net margin rose to 33.4%, demonstrating robust operational leverage and disciplined cost control. The 2025 fiscal year highlights accelerated growth with a 23.9% revenue jump and a 41.3% EBIT increase, signaling strong momentum.
STMicroelectronics N.V. Analysis
STM’s revenue declined from 12.8B in 2021 to 11.8B in 2025, with net income plummeting from 2B to near breakeven. Despite a gross margin near 34%, its EBIT margin barely reached 3.4%, reflecting weak operating efficiency. The latest fiscal year showed a sharp 10.8% revenue drop and an 88% net margin contraction, indicating operational struggles and margin compression.
Margin Power vs. Revenue Scale
KLA exhibits superior margin strength and consistent profit growth, while STM faces declining revenue and deteriorating profitability. KLA’s efficiency and expanding margins mark it as the clear fundamental winner. Investors seeking durable profitability will find KLA’s profile more attractive than STM’s challenging turnaround.
Financial Ratios Comparison
These vital ratios act as a diagnostic tool to expose the underlying fiscal health, valuation premiums, and capital efficiency of the companies compared below:
| Ratios | KLA Corporation (KLAC) | STMicroelectronics N.V. (STM) |
|---|---|---|
| ROE | 87% | 0.9% |
| ROIC | 38% | 0.7% |
| P/E | 29.3 | 0 (no earnings) |
| P/B | 25.4 | 0 |
| Current Ratio | 2.62 | 3.36 |
| Quick Ratio | 1.83 | 2.43 |
| D/E | 1.30 | 0.12 |
| Debt-to-Assets | 38% | 9% |
| Interest Coverage | 17.3 | 0 |
| Asset Turnover | 0.76 | 0.48 |
| Fixed Asset Turnover | 9.70 | 1.07 |
| Payout ratio | 22.3% | 0% |
| Dividend yield | 0.76% | 0% |
| Fiscal Year | 2025 | 2025 |
Efficiency & Valuation Duel: The Vital Signs
Ratios act as a company’s DNA, unveiling hidden risks and operational excellence that numbers alone cannot capture. They reveal efficiency, profitability, and valuation nuances crucial for investors.
KLA Corporation
KLA dominates with an exceptional 86.6% ROE and a robust 33.4% net margin, signaling stellar profitability. However, its 29.3 P/E and 25.4 P/B ratios highlight a stretched valuation. The company returns value via a modest 0.76% dividend yield, balancing shareholder rewards with sustained R&D investment.
STMicroelectronics N.V.
STMicroelectronics struggles with a low 0.9% ROE and a thin 1.4% net margin, reflecting weak profitability. Its zero P/E and P/B ratios suggest undervaluation or accounting anomalies. Despite no dividend, STM maintains a solid balance sheet with low debt, focusing on growth via significant R&D expenditures.
Premium Valuation vs. Operational Safety
KLA offers superior profitability but at a premium valuation, introducing valuation risk. STM presents a conservative capital structure and growth focus, yet profitability remains weak. Investors valuing operational strength might prefer STM; those seeking high returns must weigh KLA’s stretched multiples carefully.
Which one offers the Superior Shareholder Reward?
I see KLA Corporation (KLAC) delivers a balanced shareholder reward with a 0.76% dividend yield and a 22% payout ratio, supported by a strong buyback program that sustains long-term value. STM pays a lower 0.69% yield with an 18% payout ratio and weaker buybacks. KLAC’s robust free cash flow coverage and consistent buybacks make its distribution more sustainable. STM reinvests heavily in growth, but its lower margins and volatile cash flow raise risks. For 2026 investors seeking total return, KLAC offers the superior blend of yield, buybacks, and sustainability.
Comparative Score Analysis: The Strategic Profile
The radar chart reveals the fundamental DNA and trade-offs of KLA Corporation and STMicroelectronics N.V., highlighting their distinct financial strengths and weaknesses:
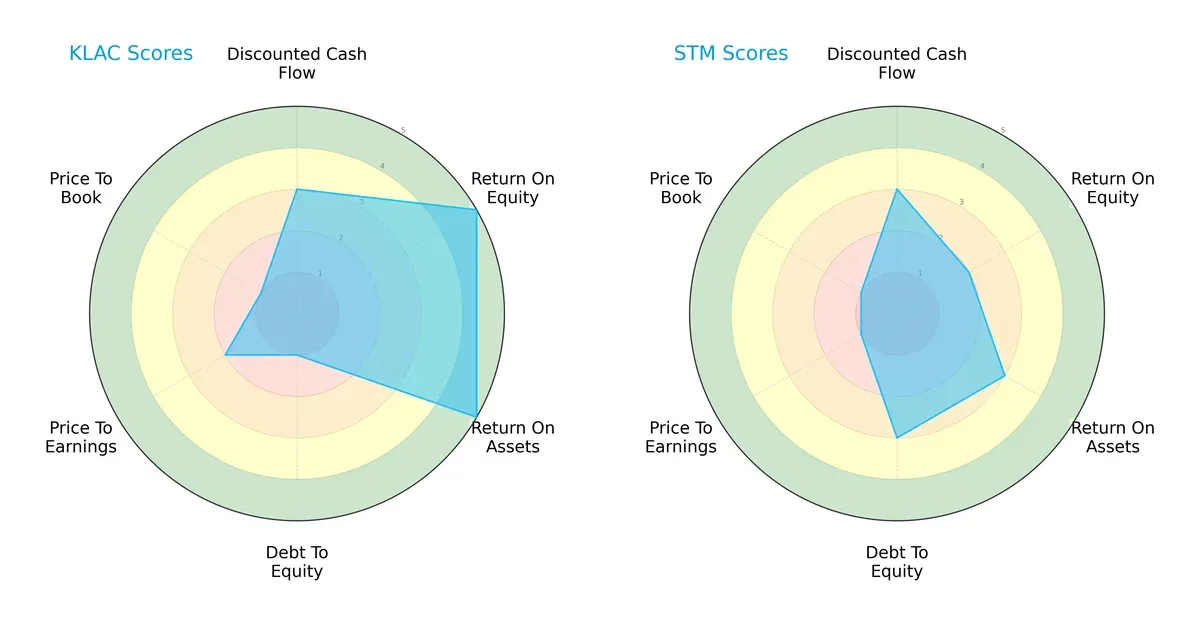
KLA leads with strong profitability metrics, scoring 5 in both ROE and ROA, signaling efficient capital and asset utilization. However, its high debt-to-equity risk (score 1) and weak valuation scores (P/E 2, P/B 1) reveal balance sheet vulnerability and potential overvaluation concerns. STMicroelectronics presents a more balanced debt profile (score 3) but lags in profitability (ROE 2, ROA 3) and suffers from very unfavorable valuation scores (P/E 1, P/B 1). KLA’s profile relies on operational excellence offset by leverage risks; ST offers steadier financial risk management but at the cost of weaker returns.
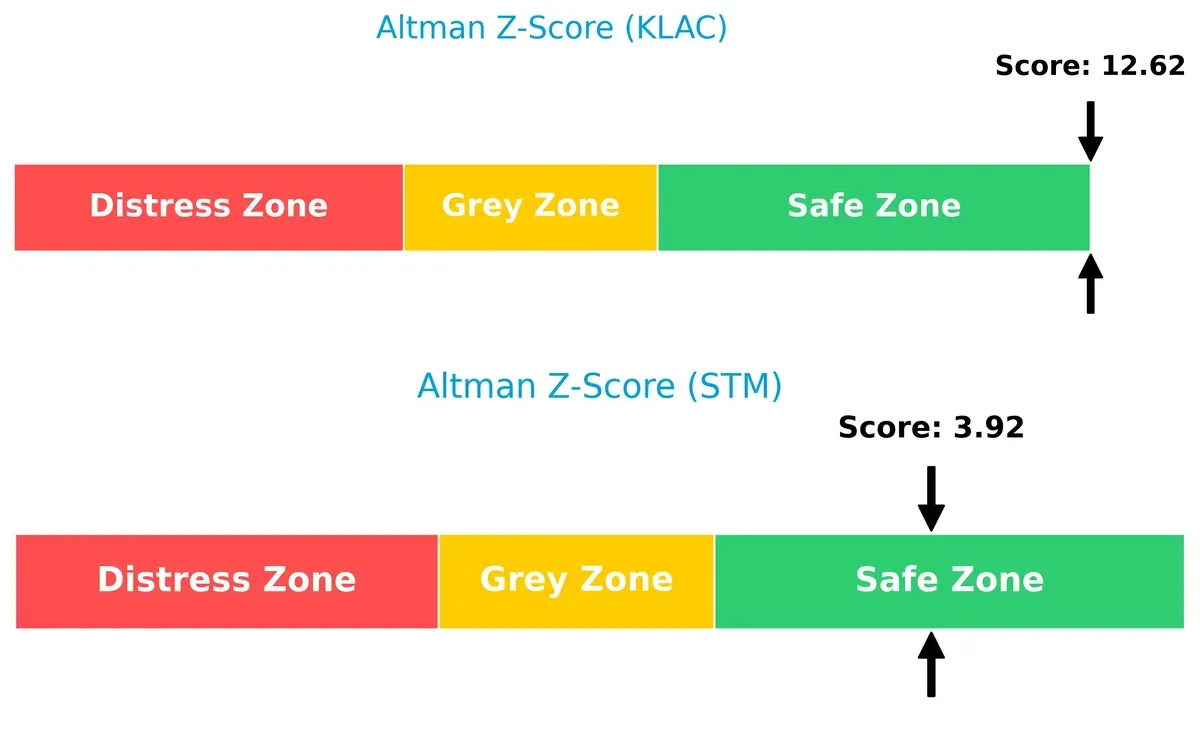
Bankruptcy Risk: Solvency Showdown
KLA’s Altman Z-Score of 12.6 vastly exceeds ST’s 3.9, placing both safely above distress levels but illustrating KLA’s superior solvency and resilience in this cycle:
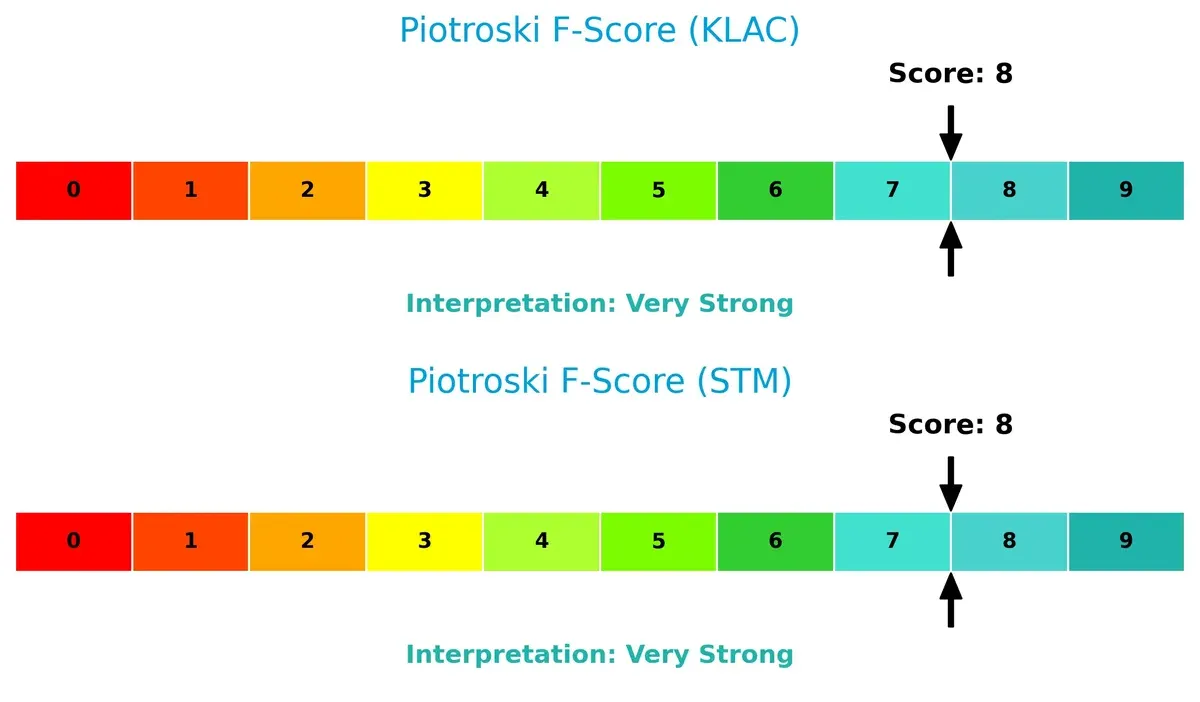
Financial Health: Quality of Operations
Both companies score a robust 8 on the Piotroski F-Score, signaling very strong financial health and operational quality. Neither shows red flags in internal metrics, indicating sound profitability, leverage, and liquidity positions:
How are the two companies positioned?
This section dissects KLAC and STM’s operational DNA by comparing revenue distribution and internal strengths and weaknesses. The goal is to confront their economic moats and identify which model offers the most resilient, sustainable competitive advantage.
Revenue Segmentation: The Strategic Mix
This visual comparison dissects how KLA Corporation and STMicroelectronics diversify their income streams and where their primary sector bets lie:
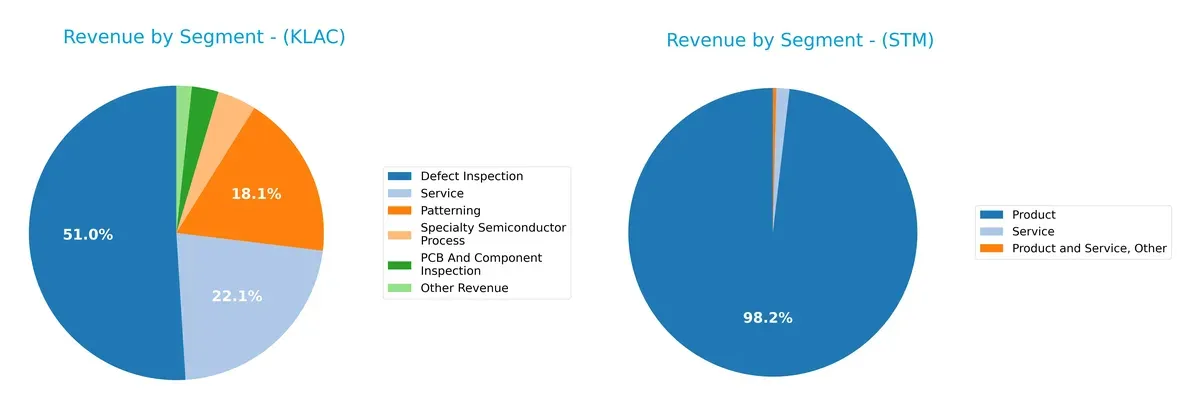
KLA leans heavily on Defect Inspection, which dwarfs other segments at $6.2B in 2025, anchoring its revenue with a strong infrastructure focus. STMicroelectronics relies predominantly on Product sales, totaling $13.2B in 2024, showing less diversification. KLA’s broader spread across Service ($2.7B) and Patterning ($2.2B) cushions against sector cyclicality. Meanwhile, ST’s concentration in Product sales exposes it to higher market volatility and less ecosystem lock-in.
Strengths and Weaknesses Comparison
This table compares the strengths and weaknesses of KLA Corporation and STMicroelectronics N.V.:
KLA Corporation Strengths
- High profitability with 33.41% net margin and 86.56% ROE
- Strong capital efficiency with 37.97% ROIC exceeding 10.42% WACC
- Robust liquidity with 2.62 current and 1.83 quick ratios
- Diversified revenue streams across defect inspection, patterning, and services
- Significant global presence with strong sales in China, Taiwan, and Korea
- High fixed asset turnover at 9.7
STMicroelectronics Strengths
- Favorable valuation metrics with P/E and P/B ratios at 0
- Low leverage with 0.12 debt-to-equity and 8.6% debt-to-assets
- Excellent interest coverage ratio indicating low financial risk
- Diversified product segments including automotive, microcontrollers, and analog
- Strong presence in Asia Pacific and Americas markets
- Quick ratio at 2.43 shows good short-term liquidity
KLA Corporation Weaknesses
- Elevated debt-to-equity ratio of 1.3 reflects higher leverage
- Unfavorable P/E of 29.34 and P/B of 25.39 suggest expensive stock
- WACC at 10.42% is higher than sector average, increasing capital costs
- Dividend yield low at 0.76% may limit income appeal
- Neutral asset turnover at 0.76 indicates moderate operational efficiency
STMicroelectronics Weaknesses
- Very low profitability with net margin 1.41%, ROE 0.93%, and ROIC 0.67%
- Unfavorable current ratio of 3.36 may indicate inefficient asset use
- Lower asset turnover at 0.48 suggests weaker revenue generation from assets
- Zero dividend yield removes income component for investors
- Neutral fixed asset turnover at 1.07 limits operational leverage
KLA exhibits strong profitability and global diversification but carries higher leverage and valuation risks. STM shows conservative balance sheet metrics and valuation strength but struggles with profitability and asset efficiency. These contrasts shape their respective strategic challenges and opportunities.
The Moat Duel: Analyzing Competitive Defensibility
A structural moat alone protects long-term profits from relentless competition erosion. Let’s dissect how these moats defend value in 2026:
KLA Corporation: Precision Process Control Moat
KLA’s moat stems from its specialized process control technology, yielding a strong 40.7% EBIT margin and 27.5% ROIC premium over WACC. Its expanding product suite and industry footprint deepen this moat.
STMicroelectronics N.V.: Broad Semiconductor Portfolio with Thin Margins
STM competes on diverse semiconductor products but shows a declining ROIC and razor-thin 3.4% EBIT margin. This signals a weakening moat relative to KLA’s focused advantage. Expansion in automotive and MEMS markets offers some upside.
Verdict: Precision Dominance vs. Portfolio Breadth
KLA holds a wider, more durable moat thanks to superior profitability and efficient capital use. STM’s value destruction and margin pressure leave it less equipped to defend market share long term.
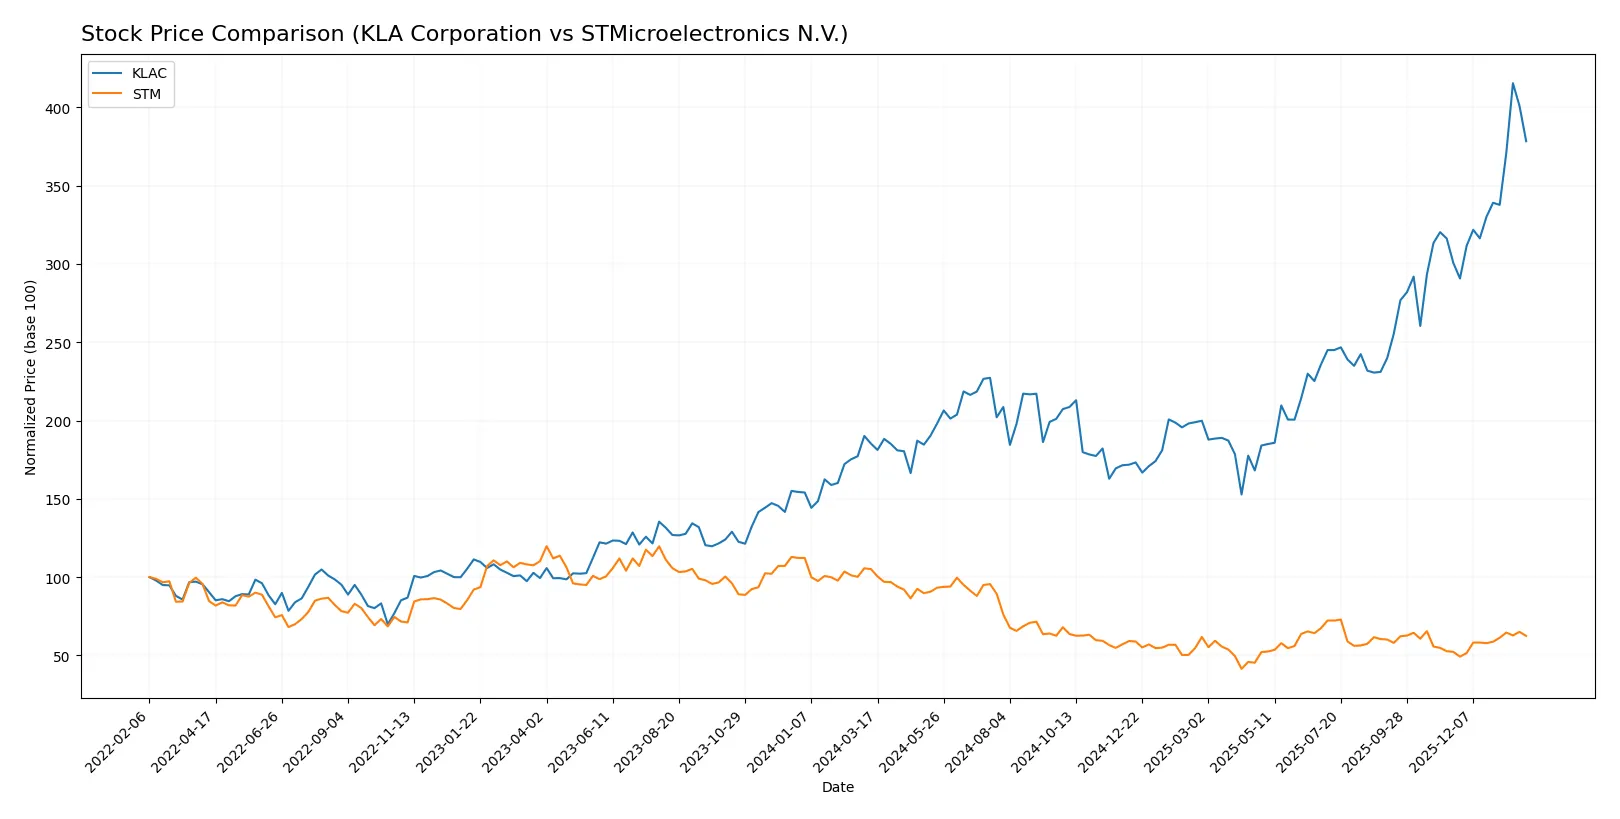
Which stock offers better returns?
Over the past year, KLA Corporation’s stock surged dramatically, while STMicroelectronics N.V. faced a significant decline despite recent modest gains.
Trend Comparison
KLA Corporation’s stock increased by 104.22% over the past 12 months, showing a strong bullish trend with accelerating price gains and high volatility. Its peak reached 1567.82, and the lowest was 576.53.
STMicroelectronics N.V. experienced a 40.6% decline over the same period, marking a bearish trend despite recent acceleration and a 19.49% recovery since November 2025. Volatility remained low, with prices ranging from 18.49 to 46.95.
KLA’s stock clearly outperformed STM, delivering the highest market returns with sustained acceleration and significantly greater price appreciation.
Target Prices
Analysts present a cautiously optimistic consensus on KLA Corporation and STMicroelectronics N.V.
| Company | Target Low | Target High | Consensus |
|---|---|---|---|
| KLA Corporation | 1400 | 1900 | 1672.25 |
| STMicroelectronics N.V. | 28 | 45 | 37.67 |
KLA’s target consensus of 1672.25 exceeds its current price of 1427.94, signaling upside potential. STM’s consensus at 37.67 also surpasses its current 27.89 price, indicating expected recovery and growth.

Don’t Let Luck Decide Your Entry Point
Optimize your entry points with our advanced ProRealTime indicators. You’ll get efficient buy signals with precise price targets for maximum performance. Start outperforming now!
How do institutions grade them?
KLA Corporation Grades
The following table summarizes recent grades issued by major institutions for KLA Corporation:
| Grading Company | Action | New Grade | Date |
|---|---|---|---|
| Oppenheimer | maintain | Outperform | 2026-01-30 |
| Barclays | maintain | Overweight | 2026-01-30 |
| Cantor Fitzgerald | maintain | Overweight | 2026-01-30 |
| Jefferies | maintain | Buy | 2026-01-30 |
| Stifel | maintain | Buy | 2026-01-30 |
| Wells Fargo | maintain | Overweight | 2026-01-30 |
| Needham | maintain | Buy | 2026-01-30 |
| RBC Capital | maintain | Sector Perform | 2026-01-30 |
| Deutsche Bank | maintain | Hold | 2026-01-21 |
| Needham | maintain | Buy | 2026-01-20 |
STMicroelectronics N.V. Grades
Below is a summary of recent grades from recognized institutions for STMicroelectronics N.V.:
| Grading Company | Action | New Grade | Date |
|---|---|---|---|
| TD Cowen | maintain | Buy | 2025-10-24 |
| Susquehanna | maintain | Positive | 2025-10-22 |
| Susquehanna | maintain | Positive | 2025-07-25 |
| Baird | upgrade | Outperform | 2025-07-22 |
| Susquehanna | maintain | Positive | 2025-07-22 |
| Jefferies | upgrade | Buy | 2025-02-19 |
| Bernstein | downgrade | Market Perform | 2025-02-05 |
| Susquehanna | maintain | Positive | 2025-01-31 |
| Barclays | downgrade | Underweight | 2025-01-22 |
| JP Morgan | downgrade | Neutral | 2024-12-09 |
Which company has the best grades?
KLA Corporation consistently receives strong buy and overweight ratings from multiple firms. STMicroelectronics shows mixed ratings with recent downgrades. KLA’s steadier, higher grades suggest stronger institutional confidence, potentially influencing investors toward perceived stability.
Risks specific to each company
The following categories identify the critical pressure points and systemic threats facing both firms in the 2026 market environment:
1. Market & Competition
KLA Corporation
- Dominates process control with strong market cap and tech moat but faces intense semiconductor cycle volatility.
STMicroelectronics N.V.
- Competes across diverse semiconductor segments but struggles with profitability and market share against larger rivals.
2. Capital Structure & Debt
KLA Corporation
- Elevated debt-to-equity ratio (1.3) signals higher leverage risk despite strong interest coverage.
STMicroelectronics N.V.
- Low leverage (0.12 debt-to-equity) supports financial stability and reduces refinancing risk.
3. Stock Volatility
KLA Corporation
- Beta of 1.44 reflects high sensitivity to market swings, increasing risk for traders.
STMicroelectronics N.V.
- Lower beta at 1.29 suggests somewhat less volatility relative to the market.
4. Regulatory & Legal
KLA Corporation
- US-based, exposed to tightening export controls on semiconductor tech.
STMicroelectronics N.V.
- Euro-centric firm faces complex EU regulations and geopolitical trade tensions.
5. Supply Chain & Operations
KLA Corporation
- Relies on advanced manufacturing for high-end semiconductor tools, vulnerable to supply disruptions.
STMicroelectronics N.V.
- Broader geographic footprint dilutes risk but complexity in multi-segment operations challenges agility.
6. ESG & Climate Transition
KLA Corporation
- Increasing pressure to reduce energy intensity in fabs; must invest in sustainable tech.
STMicroelectronics N.V.
- Faces rising ESG demands across Europe with stronger regulatory scrutiny on emissions.
7. Geopolitical Exposure
KLA Corporation
- Primary exposure to US-China tensions affecting semiconductor equipment exports.
STMicroelectronics N.V.
- Global footprint exposes STM to risks from EU, Asia, and US trade policies.
Which company shows a better risk-adjusted profile?
KLA Corporation’s largest risk is its high leverage amid cyclical semiconductor markets, threatening financial flexibility. STMicroelectronics’ biggest concern is persistently low profitability in a competitive environment. Despite KLA’s debt risk, its superior ROIC and strong Altman Z-score suggest a better risk-adjusted profile. Recent data reveal KLA’s debt-to-equity remains a red flag, while STM’s margin struggles highlight operational challenges. I judge KLA as the more resilient choice for risk-conscious investors.
Final Verdict: Which stock to choose?
KLA Corporation’s superpower lies in its robust capital efficiency and growing profitability, evidenced by a very favorable economic moat. Its main point of vigilance is the high valuation multiples, which could pressure returns if growth slows. This stock suits an aggressive growth portfolio seeking durable competitive advantages.
STMicroelectronics commands a strategic moat through diversified technology exposure and a strong balance sheet with low leverage. While its recent profitability struggles pose caution, its safety profile is superior to KLA’s. STM fits a GARP (Growth at a Reasonable Price) portfolio aiming for stability amid recovery potential.
If you prioritize consistent value creation and high returns on invested capital, KLA outshines with its proven efficiency and growth trajectory. However, if you seek financial stability and a more conservative risk profile, STM offers better stability despite weaker recent earnings. Each presents a distinct investment scenario tailored to different risk tolerances.
Disclaimer: Investment carries a risk of loss of initial capital. The past performance is not a reliable indicator of future results. Be sure to understand risks before making an investment decision.
Go Further
I encourage you to read the complete analyses of KLA Corporation and STMicroelectronics N.V. to enhance your investment decisions: