Home > Comparison > Technology > KLAC vs SWKS
The strategic rivalry between KLA Corporation and Skyworks Solutions defines the semiconductor sector’s innovation and market dynamics. KLA operates as a capital-intensive provider of process control and yield management solutions, whereas Skyworks excels as a diversified semiconductor manufacturer with a broad product portfolio. This comparison pits advanced manufacturing precision against integrated product versatility. This analysis will clarify which company presents a superior risk-adjusted profile for a diversified technology portfolio.
Table of contents
Companies Overview
KLA Corporation and Skyworks Solutions stand as pivotal players in the semiconductor industry, shaping global technology trends.
KLA Corporation: Semiconductor Process Control Specialist
KLA dominates the semiconductor process control market with its integrated circuit manufacturing products. Its revenue hinges on wafer inspection, metrology, defect analysis, and process management solutions. In 2026, KLA sharpened its focus on advanced semiconductor process control and specialty solutions to enhance yield and quality in IC manufacturing worldwide.
Skyworks Solutions, Inc.: Analog and Mixed-Signal Innovator
Skyworks leads with its broad portfolio of proprietary semiconductor products, including amplifiers, front-end modules, and voltage regulators. Its revenue stream flows from diverse markets such as aerospace, automotive, and smartphones. In 2026, Skyworks prioritized expanding its footprint across connected home and 5G infrastructure sectors, leveraging its IP-rich product lineup.
Strategic Collision: Similarities & Divergences
KLA emphasizes process control and yield management, while Skyworks focuses on analog and mixed-signal components. Both compete indirectly in semiconductor innovation but target different stages of the value chain. KLA’s high-margin, specialized equipment contrasts with Skyworks’ volume-driven component sales, shaping distinct risk and growth profiles for investors.
Income Statement Comparison
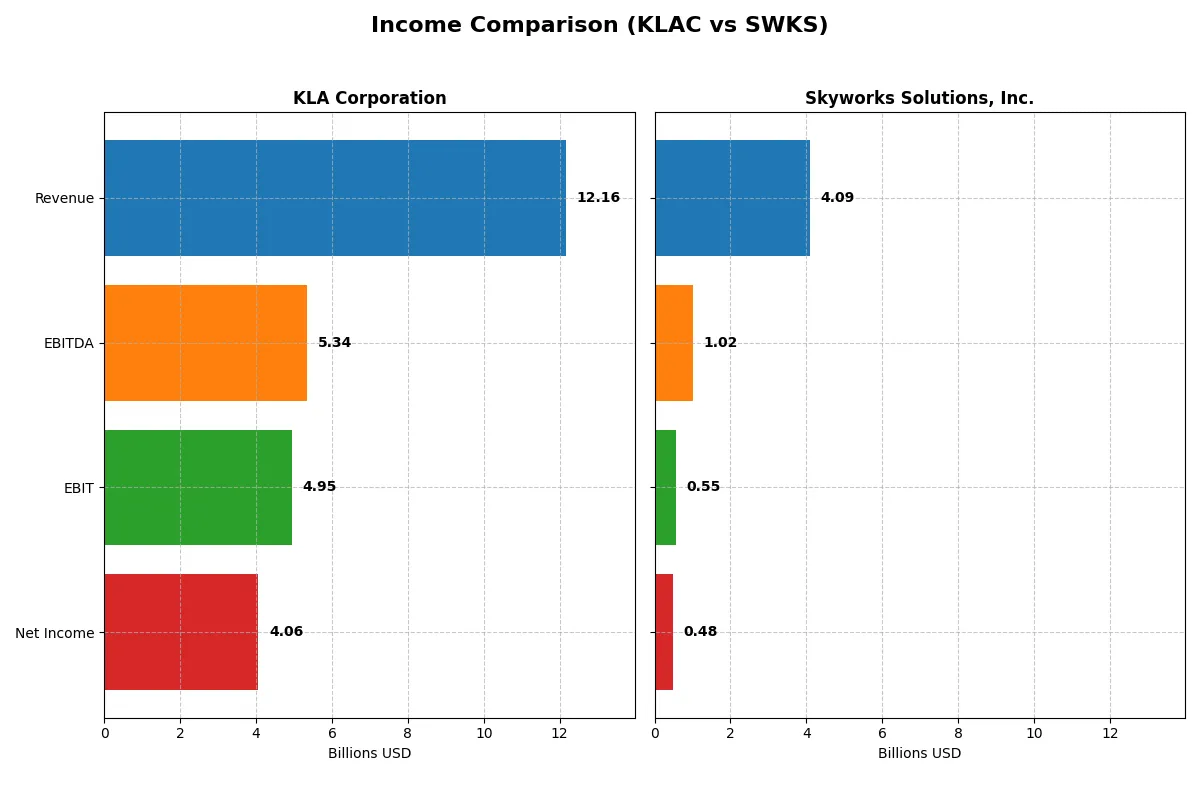
This data dissects the core profitability and scalability of both corporate engines to reveal who dominates the bottom line:
| Metric | KLA Corporation (KLAC) | Skyworks Solutions, Inc. (SWKS) |
|---|---|---|
| Revenue | 12.2B | 4.1B |
| Cost of Revenue | 4.6B | 2.4B |
| Operating Expenses | 2.3B | 1.2B |
| Gross Profit | 7.6B | 1.7B |
| EBITDA | 5.3B | 1.0B |
| EBIT | 4.9B | 554M |
| Interest Expense | 302M | 27M |
| Net Income | 4.1B | 477M |
| EPS | 30.53 | 3.09 |
| Fiscal Year | 2025 | 2025 |
Income Statement Analysis: The Bottom-Line Duel
This income statement comparison reveals which company runs a more efficient and profitable corporate engine through recent performance and margin analysis.
KLA Corporation Analysis
KLA’s revenue surged 23.9% to 12.2B in 2025, with net income climbing 47% to 4.1B, reflecting strong momentum. Its gross margin stands robust at 62.3%, and net margin impresses at 33.4%, highlighting exceptional cost control and operational efficiency in the latest year.
Skyworks Solutions, Inc. Analysis
Skyworks’ revenue declined 2.2% to 4.1B in 2025, with net income falling 20% to 477M, indicating weakening momentum. Gross margin sits at 41.2%, and net margin at a modest 11.7%, signaling tighter profitability and less effective expense management compared to its peer.
Margin Strength vs. Revenue Growth
KLA outperforms Skyworks decisively with superior revenue growth and significantly higher margins. KLA’s consistent margin expansion and nearly doubling net income over five years mark it as the fundamentally stronger operator. Investors seeking growth and efficiency will find KLA’s profile more compelling.
Financial Ratios Comparison
These vital ratios act as a diagnostic tool to expose the underlying fiscal health, valuation premiums, and capital efficiency of each company:
| Ratios | KLA Corporation (KLAC) | Skyworks Solutions, Inc. (SWKS) |
|---|---|---|
| ROE | 86.6% | 8.3% |
| ROIC | 38.0% | 6.4% |
| P/E | 29.3 | 25.0 |
| P/B | 25.4 | 2.1 |
| Current Ratio | 2.62 | 2.33 |
| Quick Ratio | 1.83 | 1.76 |
| D/E (Debt-to-Equity) | 1.30 | 0.21 |
| Debt-to-Assets | 37.9% | 15.2% |
| Interest Coverage | 17.3 | 18.5 |
| Asset Turnover | 0.76 | 0.52 |
| Fixed Asset Turnover | 9.70 | 2.95 |
| Payout ratio | 22.3% | 90.7% |
| Dividend yield | 0.76% | 3.63% |
| Fiscal Year | 2025 | 2025 |
Efficiency & Valuation Duel: The Vital Signs
Financial ratios serve as a company’s DNA, uncovering hidden risks and revealing operational strengths that define its investment profile.
KLA Corporation
KLA exhibits exceptional profitability with an 86.56% ROE and strong 33.41% net margin, signaling operational excellence. Its valuation appears stretched, with a high 29.34 P/E and 25.39 P/B, reflecting premium pricing. Dividend yield is low at 0.76%, indicating limited shareholder returns via dividends but potential reinvestment in growth or R&D.
Skyworks Solutions, Inc.
Skyworks shows moderate profitability with an 8.29% ROE and an 11.67% net margin, marking decent efficiency. Its valuation is more reasonable, with a 24.95 P/E and 2.07 P/B, suggesting less premium pressure. The company delivers a solid 3.63% dividend yield, providing tangible shareholder returns alongside stable operational metrics.
Premium Valuation vs. Operational Safety
KLA commands a premium valuation justified by superior profitability but faces risks from high leverage and stretched multiples. Skyworks balances moderate returns with lower valuation and stronger dividend yield, offering a more conservative profile. Investors seeking growth may lean toward KLA; those prioritizing income and stability may prefer Skyworks.
Which one offers the Superior Shareholder Reward?
I observe KLA Corporation maintains a modest 0.76% dividend yield with a conservative 22% payout ratio, supported by strong free cash flow of 28B. It pairs dividends with steady buybacks, ensuring sustainable returns. Skyworks Solutions offers a higher 3.63% yield but at a steep 91% payout ratio, signaling risk. Its buyback activity is less intense, and reinvestment leans more on dividends than growth. I conclude KLA’s balanced distribution and robust cash flow underpin superior, durable shareholder reward versus Skyworks in 2026.
Comparative Score Analysis: The Strategic Profile
The radar chart reveals the fundamental DNA and trade-offs of KLA Corporation and Skyworks Solutions, Inc., highlighting their core financial strengths and weaknesses:
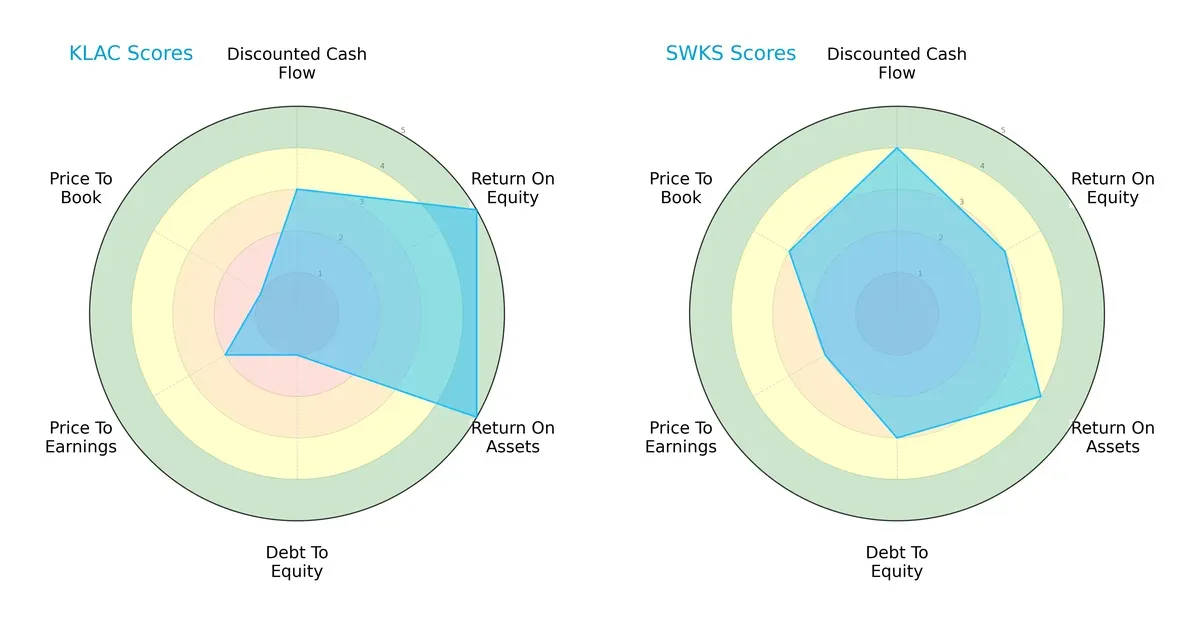
KLA excels in profitability with top ROE and ROA scores of 5, showing superior asset and equity efficiency. However, it carries significant financial risk, reflected by a very unfavorable debt-to-equity score of 1 and a weak price-to-book score. Skyworks displays a more balanced profile, boasting a favorable DCF score of 4 and moderate leverage with a debt-to-equity score of 3. Skyworks leans on steady valuation metrics, while KLA relies on high operational returns despite elevated financial risk.
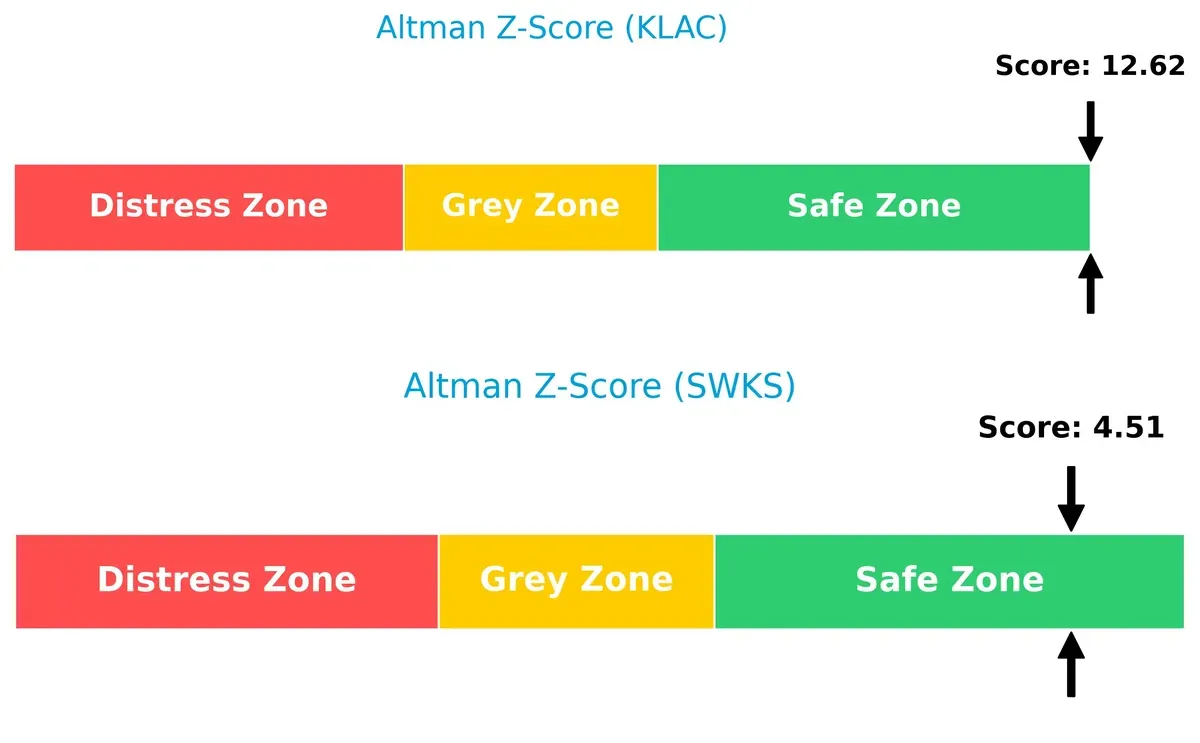
Bankruptcy Risk: Solvency Showdown
KLA’s Altman Z-Score of 12.6 far surpasses Skyworks’ 4.5, positioning both safely above distress thresholds but underscoring KLA’s stronger buffer against long-term bankruptcy risk in this cycle:
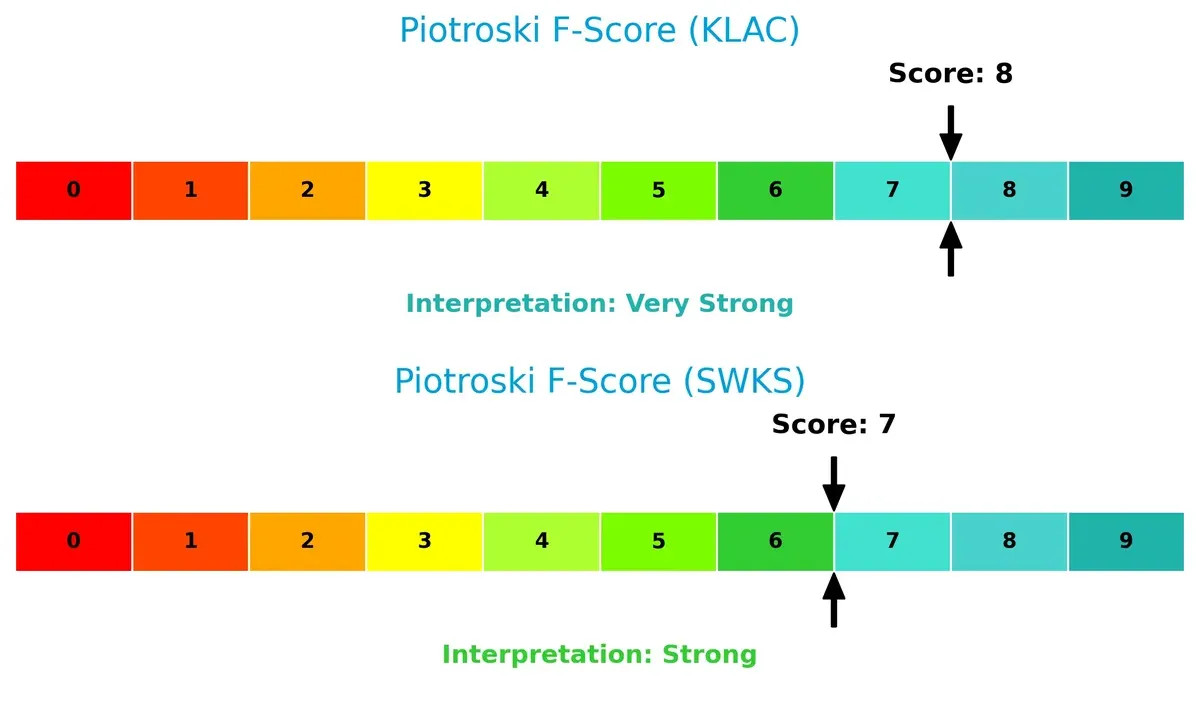
Financial Health: Quality of Operations
KLA’s Piotroski F-Score of 8 indicates very strong financial health, slightly edging out Skyworks’ strong score of 7. This suggests KLA maintains superior internal quality metrics, with fewer red flags in profitability, liquidity, and operational efficiency:
How are the two companies positioned?
This section dissects KLAC and SWKS’ operational DNA by comparing revenue distribution and internal dynamics. The goal is to confront their economic moats and identify which model offers the most resilient, sustainable competitive advantage today.
Revenue Segmentation: The Strategic Mix
This visual comparison dissects how KLA Corporation and Skyworks Solutions, Inc. diversify their income streams and where their primary sector bets lie:
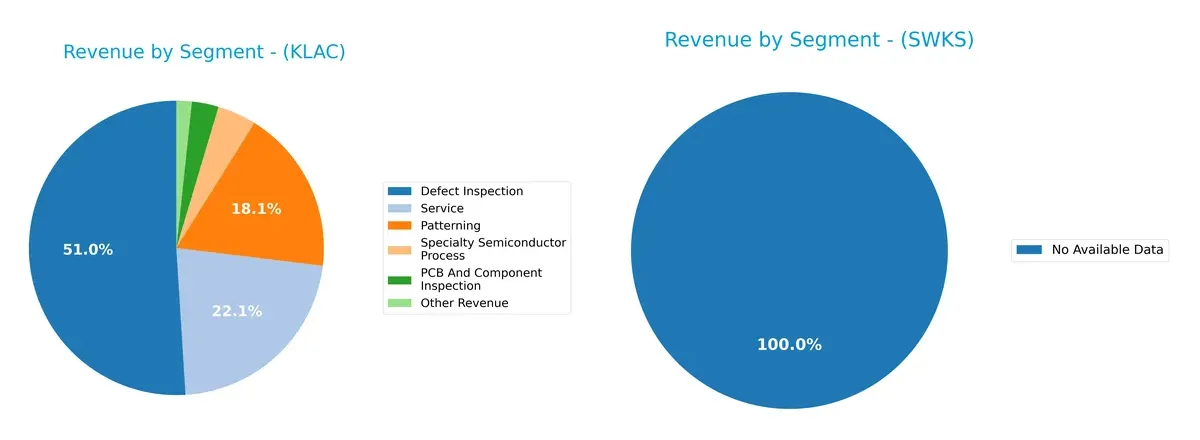
KLA Corporation anchors its revenue in Defect Inspection at $6.2B and Service at $2.7B, showing a strong focus on semiconductor process control. Its mix also includes Patterning ($2.2B) and Specialty Semiconductor Process ($517M), indicating moderate diversification. Skyworks Solutions lacks available segmentation data, preventing comparison. KLA’s dominance in inspection services suggests ecosystem lock-in but also exposes it to semiconductor cycle volatility, demanding cautious portfolio weighting.
Strengths and Weaknesses Comparison
This table compares the Strengths and Weaknesses of KLA Corporation and Skyworks Solutions, Inc.:
KLA Corporation Strengths
- High net margin of 33.41%
- Strong ROE at 86.56%
- Solid ROIC of 37.97%
- Favorable current and quick ratios
- High fixed asset turnover of 9.7
- Diverse global revenue across Asia, North America, and Europe
Skyworks Solutions Strengths
- Favorable net margin of 11.67%
- Strong current and quick ratios
- Low debt to equity at 0.21
- Excellent interest coverage at 20.44
- Favorable dividend yield at 3.63%
- Significant U.S. revenue dominance
KLA Corporation Weaknesses
- Unfavorable WACC at 10.42% above ROIC
- High PE and PB ratios indicating premium valuation
- Elevated debt to equity at 1.3
- Dividend yield low at 0.76%
- Moderate debt to assets at 37.89%
- ROE and asset turnover neutral or unfavorable in parts
Skyworks Solutions Weaknesses
- Low ROE at 8.29%
- Moderate ROIC at 6.35%
- PE and PB ratios neutral, no valuation advantage
- Asset turnover and fixed asset turnover neutral
- Smaller geographic diversification, heavy U.S. reliance
KLA shows strong profitability and global diversification but carries higher debt and valuation premiums. Skyworks maintains healthier leverage and income distribution but faces challenges in profitability and geographic concentration. These differences highlight contrasting strategic focuses in capital structure and market reach.
The Moat Duel: Analyzing Competitive Defensibility
A structural moat is the only barrier protecting long-term profits from relentless competitive pressure. Here’s how KLA and Skyworks stack up:
KLA Corporation: Precision Process Control Moat
KLA dominates with high switching costs and proprietary inspection tech, reflected in its 40.7% EBIT margin and 27.5% ROIC premium over WACC. Expansion in Asian markets and advanced semiconductor nodes could deepen this moat in 2026.
Skyworks Solutions, Inc.: Component Diversification with Weaker Moat
Skyworks relies on product breadth across wireless semiconductors but faces declining profitability and a negative ROIC versus WACC trend. Its U.S.-centric sales limit global reach, though 5G and IoT growth offer potential for disruption.
Verdict: Precision Control vs. Diversified Components
KLA’s moat is deeper and more durable, fueled by specialized tech and robust capital returns. Skyworks trails with a shrinking moat and profitability challenges. KLA is clearly better equipped to defend and grow its market share.
Which stock offers better returns?
The past year shows starkly contrasting price trajectories for KLA Corporation and Skyworks Solutions, marked by strong gains and sharp declines respectively.
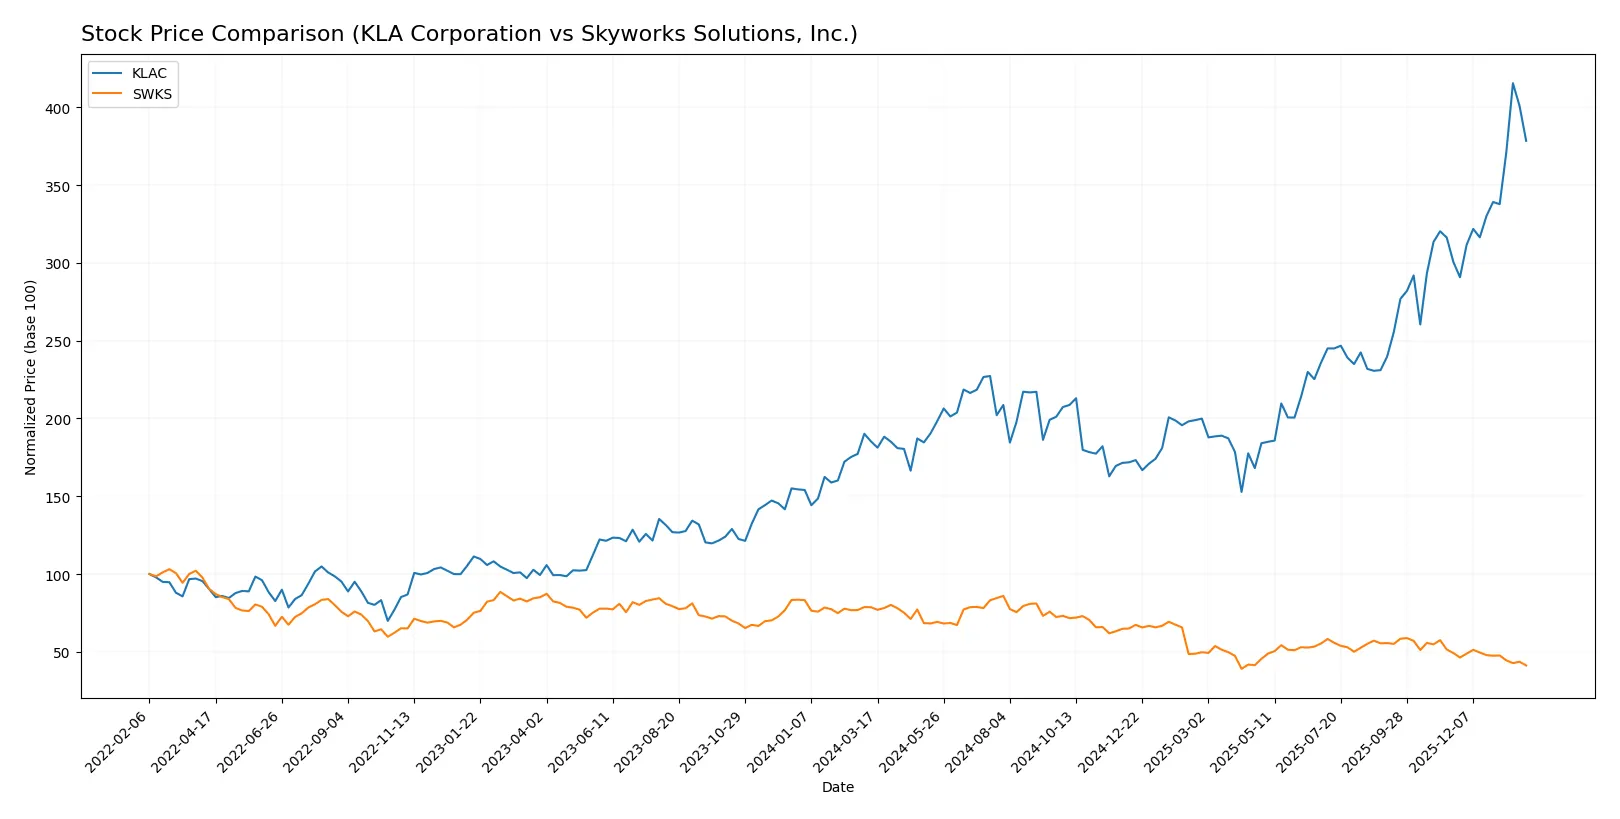
Trend Comparison
KLA Corporation’s stock gained 104.22% over the past 12 months, indicating a bullish trend with accelerating momentum. The price ranged between 577 and 1,568, showing high volatility.
Skyworks Solutions’ stock fell 47.55% over the past year, reflecting a bearish trend with decelerating losses. Price fluctuated narrowly from 53 to 116, exhibiting low volatility.
KLA Corporation outperformed Skyworks Solutions decisively, delivering the highest market returns with sustained upward acceleration. Skyworks showed persistent downward pressure and weaker volume support.
Target Prices
Analysts present a mixed but insightful target consensus for KLA Corporation and Skyworks Solutions, Inc.
| Company | Target Low | Target High | Consensus |
|---|---|---|---|
| KLA Corporation | 1400 | 1900 | 1672.25 |
| Skyworks Solutions, Inc. | 60 | 140 | 80.9 |
KLA’s consensus target at 1672.25 suggests upside from the current 1427.94, implying confidence in its semiconductor process control moat. Skyworks, with a consensus of 80.9 versus 55.76, indicates expectations of recovery but presents higher volatility risks.

Don’t Let Luck Decide Your Entry Point
Optimize your entry points with our advanced ProRealTime indicators. You’ll get efficient buy signals with precise price targets for maximum performance. Start outperforming now!
How do institutions grade them?
This section compares institutional grades for KLA Corporation and Skyworks Solutions, Inc.:
KLA Corporation Grades
Here are the most recent grades from reputable financial institutions for KLA Corporation:
| Grading Company | Action | New Grade | Date |
|---|---|---|---|
| Oppenheimer | Maintain | Outperform | 2026-01-30 |
| Barclays | Maintain | Overweight | 2026-01-30 |
| Cantor Fitzgerald | Maintain | Overweight | 2026-01-30 |
| Jefferies | Maintain | Buy | 2026-01-30 |
| Stifel | Maintain | Buy | 2026-01-30 |
| Wells Fargo | Maintain | Overweight | 2026-01-30 |
| Needham | Maintain | Buy | 2026-01-30 |
| RBC Capital | Maintain | Sector Perform | 2026-01-30 |
| Deutsche Bank | Maintain | Hold | 2026-01-21 |
| Needham | Maintain | Buy | 2026-01-20 |
Skyworks Solutions, Inc. Grades
Below are the recent ratings from recognized analysts for Skyworks Solutions, Inc.:
| Grading Company | Action | New Grade | Date |
|---|---|---|---|
| B. Riley Securities | Maintain | Neutral | 2026-01-26 |
| Mizuho | Maintain | Neutral | 2026-01-26 |
| Susquehanna | Maintain | Neutral | 2026-01-22 |
| UBS | Maintain | Neutral | 2026-01-20 |
| Mizuho | Upgrade | Neutral | 2025-11-11 |
| UBS | Maintain | Neutral | 2025-11-05 |
| JP Morgan | Maintain | Neutral | 2025-11-05 |
| UBS | Maintain | Neutral | 2025-10-29 |
| Piper Sandler | Upgrade | Overweight | 2025-10-29 |
| Citigroup | Upgrade | Neutral | 2025-10-29 |
Which company has the best grades?
KLA Corporation consistently receives buy or outperform ratings, signaling stronger analyst confidence. Skyworks Solutions, Inc. holds mainly neutral grades with fewer upgrades, indicating a more cautious outlook. This disparity may influence investor sentiment and portfolio positioning.
Risks specific to each company
The following categories identify the critical pressure points and systemic threats facing both firms in the 2026 market environment:
1. Market & Competition
KLA Corporation
- Dominates semiconductor process control with high ROIC but faces premium valuation risks.
Skyworks Solutions, Inc.
- Competes in diverse semiconductor niches with moderate margins and lower market cap.
2. Capital Structure & Debt
KLA Corporation
- High debt-to-equity ratio (1.3) raises leverage concerns despite strong interest coverage.
Skyworks Solutions, Inc.
- Conservative leverage with debt-to-equity at 0.21, enhancing financial stability.
3. Stock Volatility
KLA Corporation
- Beta of 1.44 indicates higher market sensitivity and stock price swings.
Skyworks Solutions, Inc.
- Slightly lower beta at 1.32, suggesting moderate volatility.
4. Regulatory & Legal
KLA Corporation
- Global operations expose it to complex semiconductor export controls and IP risks.
Skyworks Solutions, Inc.
- Broad geographic footprint increases regulatory compliance costs and legal exposure.
5. Supply Chain & Operations
KLA Corporation
- Relies on advanced supply chain for wafer inspection tech, sensitive to component shortages.
Skyworks Solutions, Inc.
- Faces supply risks in analog and mixed-signal component sourcing amid global constraints.
6. ESG & Climate Transition
KLA Corporation
- Growing pressure to reduce emissions in energy-intensive semiconductor manufacturing.
Skyworks Solutions, Inc.
- Must address ESG risks in diverse product lines and global manufacturing sites.
7. Geopolitical Exposure
KLA Corporation
- Significant exposure to US-China tensions impacting semiconductor equipment sales.
Skyworks Solutions, Inc.
- Dependency on Asian markets creates vulnerability to regional trade and political disruptions.
Which company shows a better risk-adjusted profile?
KLA Corporation’s most impactful risk is its high leverage, which contradicts its strong operational metrics. Skyworks Solutions faces its largest threat from geopolitical exposure due to its broad Asia-Pacific footprint. Despite higher volatility, KLA’s industry leadership and financial strength suggest a resilient risk-adjusted profile. However, Skyworks’ conservative debt levels and safer valuation provide a steadier risk balance. Recent data confirm KLA’s elevated debt-to-equity ratio as a critical red flag, while Skyworks’ lower leverage and diversified markets support a more balanced risk stance.
Final Verdict: Which stock to choose?
KLA Corporation’s superpower lies in its durable competitive moat, evidenced by a strong, growing ROIC well above its cost of capital. It operates as a cash-generating machine with robust profitability and efficiency. The point of vigilance is its elevated debt-to-equity ratio, which calls for monitoring financial leverage. KLAC suits aggressive growth investors seeking high returns amid manageable risk.
Skyworks Solutions, Inc. offers a strategic moat rooted in financial stability and conservative leverage, providing a safer profile than KLAC. Its recurring revenue and solid cash flow yield support a defensive stance. However, its declining ROIC and negative earnings growth present caution. SWKS fits well in GARP portfolios seeking stability with moderate growth potential.
If you prioritize aggressive growth and value creation through operational excellence, KLA outshines with strong profitability and rising market momentum. However, if you seek a more stable income and capital preservation with moderate upside, Skyworks offers better stability despite weaker growth metrics. Each stock appeals to distinct investor profiles balancing growth versus safety.
Disclaimer: Investment carries a risk of loss of initial capital. The past performance is not a reliable indicator of future results. Be sure to understand risks before making an investment decision.
Go Further
I encourage you to read the complete analyses of KLA Corporation and Skyworks Solutions, Inc. to enhance your investment decisions: