Home > Comparison > Technology > KLAC vs SKYT
The strategic rivalry between KLA Corporation and SkyWater Technology defines the semiconductor sector’s competitive landscape. KLA, a capital-intensive technology leader, excels in process control and yield management solutions. SkyWater, a nimble semiconductor manufacturer, focuses on specialized development and production services. This analysis pits scale and integration against agility and innovation to determine which trajectory offers superior risk-adjusted returns for a diversified portfolio.
Table of contents
Companies Overview
KLA Corporation and SkyWater Technology, Inc. stand as pivotal players in the semiconductor industry with contrasting scales and strategies.
KLA Corporation: Global Leader in Semiconductor Process Control
KLA dominates by designing and marketing process control and yield management solutions worldwide. Its revenue stems from wafer and defect inspection, metrology, and process-enabling technologies crucial for integrated circuit manufacturing. In 2026, KLA focuses on expanding advanced semiconductor process control systems to sustain its competitive advantage in precision and scale.
SkyWater Technology, Inc.: Agile Semiconductor Manufacturing Partner
SkyWater specializes in semiconductor development and manufacturing services with a focus on co-creating technologies with clients. It generates revenue by producing silicon-based analog, mixed-signal, and rad-hard integrated circuits across aerospace, automotive, and industrial markets. The company’s 2026 strategy emphasizes engineering collaboration and niche process development to carve out specialized market segments.
Strategic Collision: Similarities & Divergences
While KLA excels in closed-loop semiconductor process control systems, SkyWater pushes an open, service-oriented model emphasizing customer collaboration. Their primary battleground lies in advanced semiconductor manufacturing solutions, where KLA leads in scale and technology breadth, and SkyWater competes on agility and customization. Investors will find KLA a large-cap growth stalwart, whereas SkyWater offers a high-beta, emerging player profile with distinct risk-reward dynamics.
Income Statement Comparison
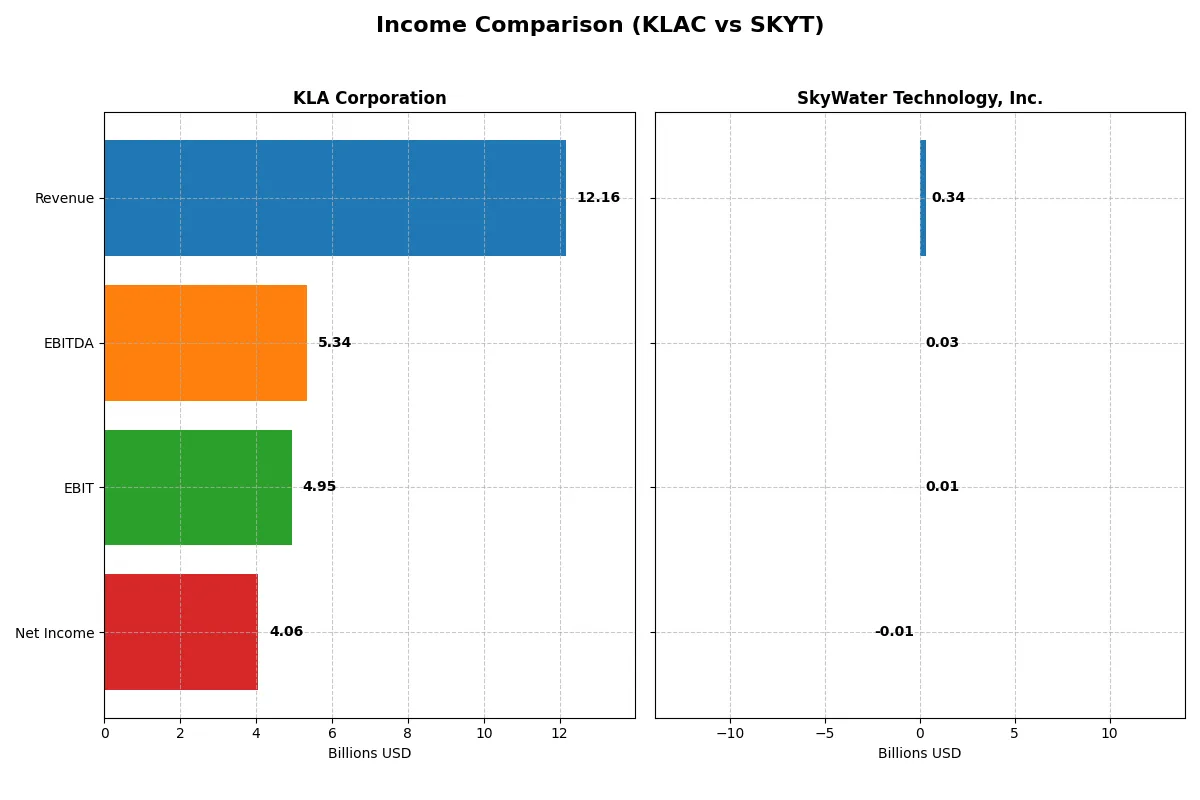
This data dissects the core profitability and scalability of both corporate engines to reveal who dominates the bottom line:
| Metric | KLA Corporation (KLAC) | SkyWater Technology, Inc. (SKYT) |
|---|---|---|
| Revenue | 12.2B | 342M |
| Cost of Revenue | 4.58B | 273M |
| Operating Expenses | 2.33B | 63.1M |
| Gross Profit | 7.58B | 69.6M |
| EBITDA | 5.34B | 25.3M |
| EBIT | 4.95B | 6.56M |
| Interest Expense | 302M | 8.84M |
| Net Income | 4.06B | -6.79M |
| EPS | 30.53 | -0.14 |
| Fiscal Year | 2025 | 2024 |
Income Statement Analysis: The Bottom-Line Duel
The coming income statement comparison reveals the true efficiency and profitability of two distinct corporate engines over recent years.
KLA Corporation Analysis
KLA’s revenue surged from 6.9B in 2021 to 12.2B in 2025, nearly doubling its net income from 2.1B to 4.1B. Its gross margin holds strong above 60%, with a net margin rising to 33.4%, signaling robust cost control and operational leverage. The latest fiscal year shows impressive momentum, driven by a 24% revenue jump and a 42% EBIT increase.
SkyWater Technology, Inc. Analysis
SkyWater grew revenue from 140M in 2020 to 342M in 2024, but it still operates at a net loss, though losses have narrowed from -51M to -6.8M. Gross margin improved to 20.3%, but net margin remains negative at -2%. Despite recent improvements in EBIT and EPS growth, profitability remains elusive, reflecting early-stage scale challenges.
Margin Dominance vs. Growth Struggles
KLA dominates with industry-leading margins and consistent net income growth, reflecting a mature, efficient business model. SkyWater shows promising top-line momentum but struggles to convert scale into profit. For investors, KLA’s profile offers proven profitability and margin power, while SkyWater presents higher risk and growth potential typical of a developing firm.
Financial Ratios Comparison
These vital ratios act as a diagnostic tool to expose the underlying fiscal health, valuation premiums, and capital efficiency of the companies compared below:
| Ratios | KLA Corporation (KLAC) | SkyWater Technology, Inc. (SKYT) |
|---|---|---|
| ROE | 87% | -12% |
| ROIC | 38% | 3% |
| P/E | 29.3 | -100.3 |
| P/B | 25.4 | 11.8 |
| Current Ratio | 2.62 | 0.86 |
| Quick Ratio | 1.83 | 0.76 |
| D/E (Debt to Equity) | 1.30 | 1.33 |
| Debt-to-Assets | 38% | 24% |
| Interest Coverage | 17.3 | 0.74 |
| Asset Turnover | 0.76 | 1.09 |
| Fixed Asset Turnover | 9.70 | 2.07 |
| Payout Ratio | 22% | 0% |
| Dividend Yield | 0.76% | 0% |
| Fiscal Year | 2025 | 2024 |
Efficiency & Valuation Duel: The Vital Signs
Financial ratios serve as a company’s DNA, uncovering hidden risks and operational excellence beyond surface-level figures.
KLA Corporation
KLA exhibits robust profitability with an 86.56% ROE and a strong 33.41% net margin, signaling operational strength. However, its valuation appears stretched with a P/E of 29.34 and P/B of 25.39. Shareholders receive modest dividends at 0.76%, reflecting a balance between returns and reinvestment in R&D, which stands at 11.15% of revenue.
SkyWater Technology, Inc.
SkyWater shows weak profitability, marked by a negative ROE of -11.79% and a net margin of -1.98%, underscoring operational challenges. The stock’s P/E is negative but labeled favorable due to loss status, while P/B at 11.82 remains high. Lack of dividends highlights reinvestment focus, though current and quick ratios below 1 signal liquidity risks.
Premium Valuation vs. Operational Safety
KLA balances high profitability and operational efficiency despite stretched valuation metrics. SkyWater grapples with weak profitability and liquidity concerns but trades at a lower sales multiple. Investors seeking stable returns may prefer KLA’s profile, while those tolerating risk might consider SkyWater’s growth potential.
Which one offers the Superior Shareholder Reward?
I see KLA Corporation (KLAC) offers a balanced, consistent distribution model with a 0.76% dividend yield and a conservative 22% payout ratio supported by strong FCF coverage (dividend paid and capex coverage ratio at 3.28x). KLAC’s buyback program is robust, enhancing total shareholder returns sustainably. Conversely, SkyWater Technology (SKYT) pays no dividends, reinvesting cash into growth and capex, but suffers weak cash flow (operating cash flow ratio at 0.12) and no buybacks, limiting immediate shareholder reward. I conclude KLAC offers the superior total return profile for 2026 investors, combining reliable income with disciplined capital allocation.
Comparative Score Analysis: The Strategic Profile
The radar chart reveals the fundamental DNA and trade-offs of KLA Corporation and SkyWater Technology, highlighting their strategic strengths and vulnerabilities:
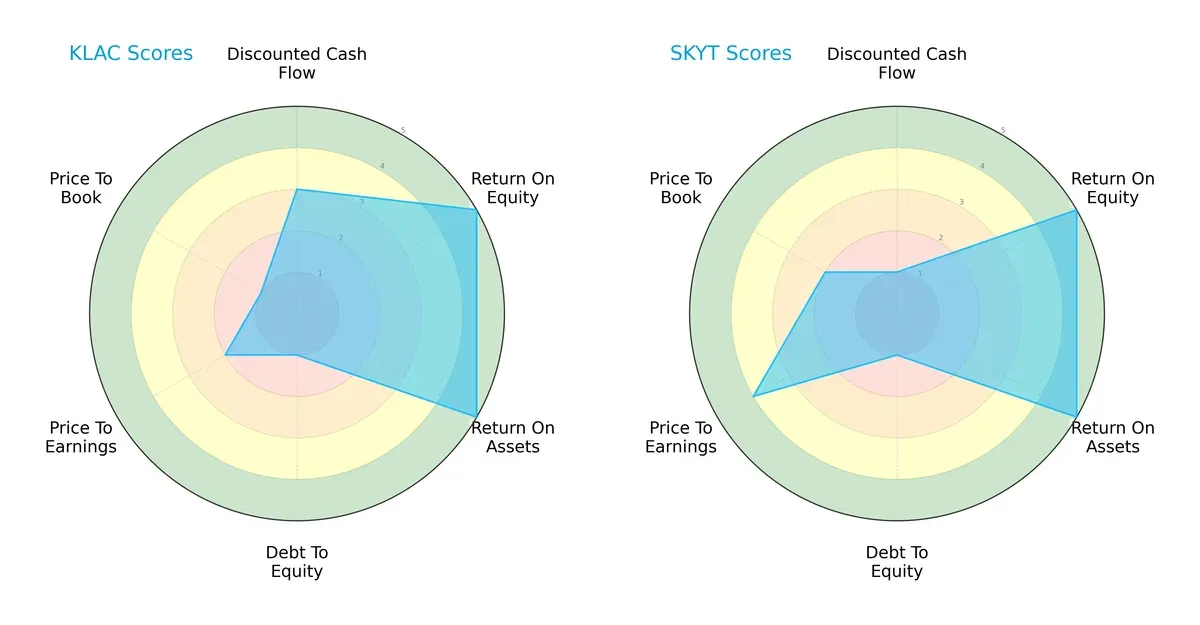
KLA shows a more balanced profile with strong returns (ROE and ROA scores of 5) but suffers from weak financial leverage (debt-to-equity score of 1) and valuation metrics (PE/PB scores of 2 and 1). SkyWater matches KLA in profitability but lags significantly on discounted cash flow (DCF score of 1 versus 3) while offering better valuation scores (PE 4, PB 2). KLA relies on operational excellence; SkyWater leans on favorable market pricing.
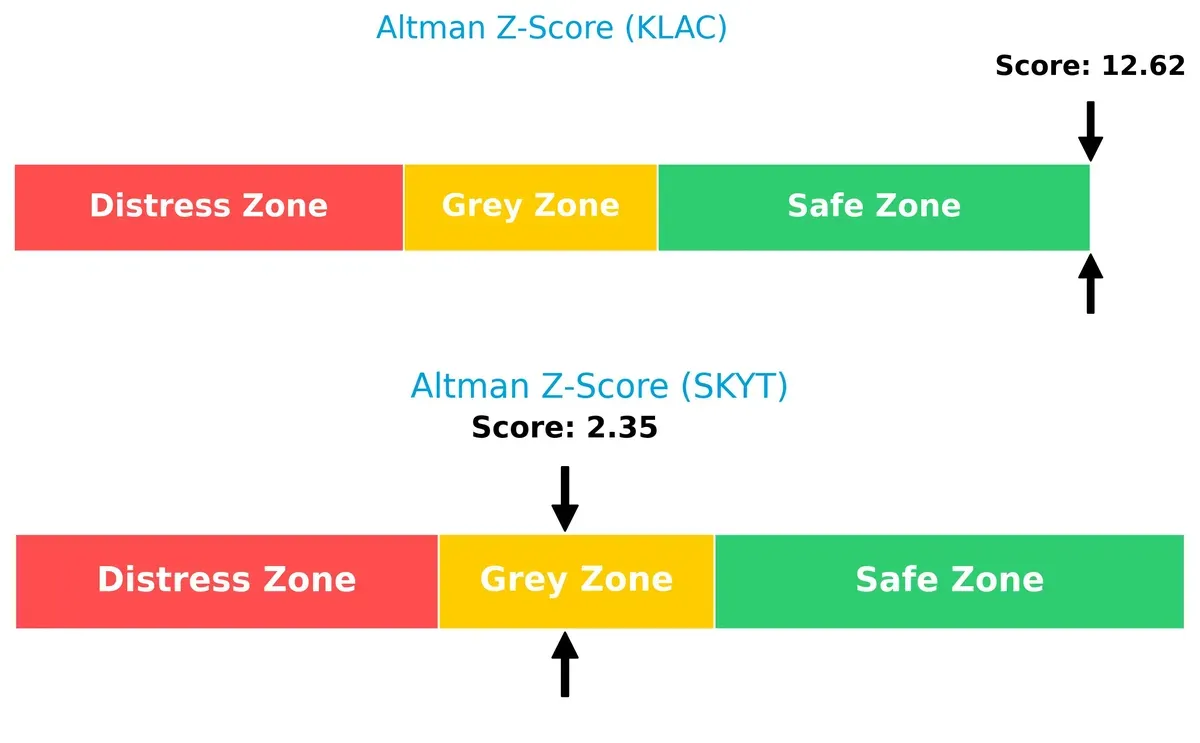
Bankruptcy Risk: Solvency Showdown
KLA’s Altman Z-Score of 12.6 places it firmly in the safe zone, signaling robust long-term survival potential. SkyWater’s score of 2.35 sits in the grey zone, indicating moderate bankruptcy risk in this cycle:
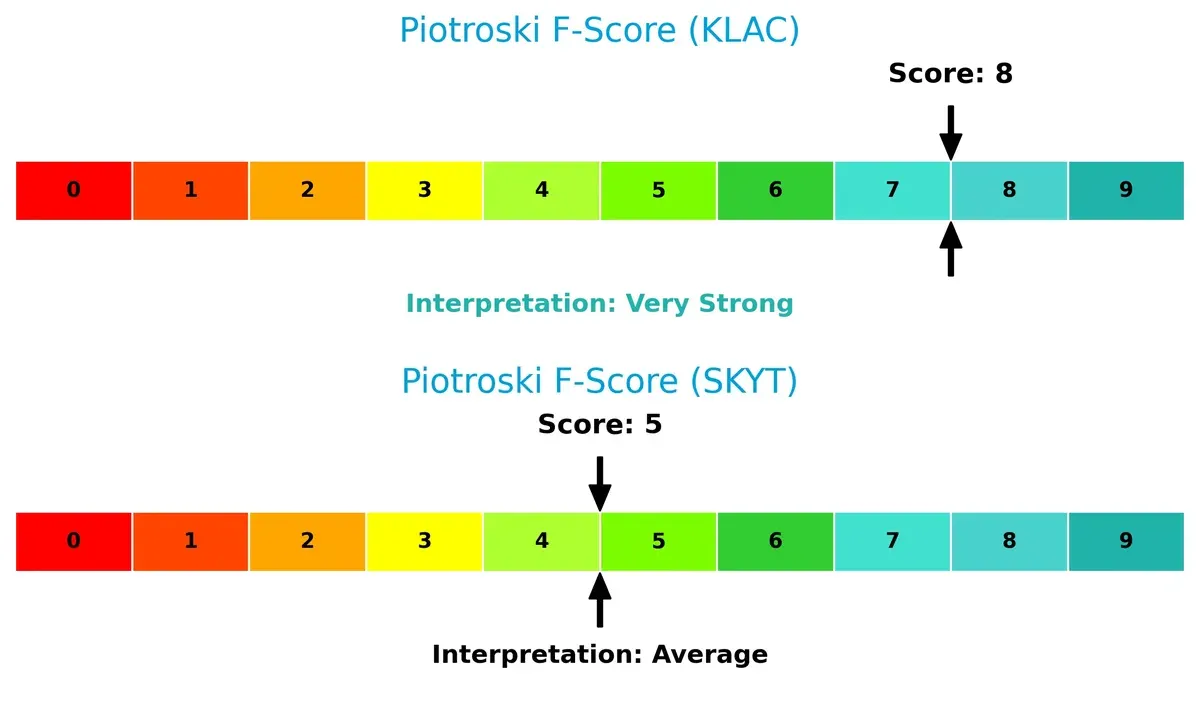
Financial Health: Quality of Operations
KLA’s Piotroski F-Score of 8 denotes very strong financial health, reflecting sound profitability, liquidity, and operational efficiency. SkyWater’s score of 5 is average, raising caution about weaker internal financial controls:
How are the two companies positioned?
This section dissects KLAC and SKYT’s operational DNA by comparing revenue distribution and internal strengths and weaknesses. The goal is to confront their economic moats to reveal which model delivers the most durable competitive advantage today.
Revenue Segmentation: The Strategic Mix
The following comparison dissects how KLA Corporation and SkyWater Technology diversify their income streams and where their primary sector bets lie:
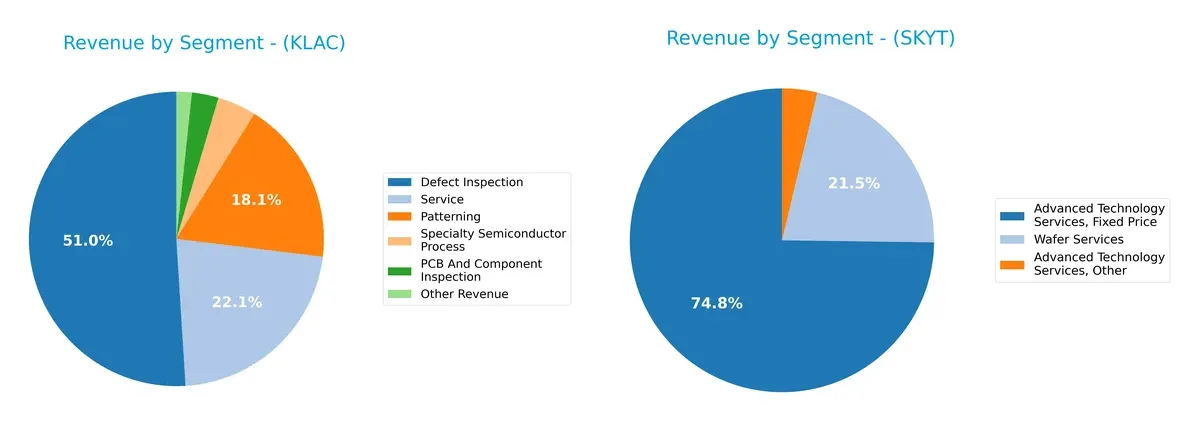
KLA dominates with a broad portfolio, led by Defect Inspection at $6.2B and Service at $2.7B, showcasing ecosystem lock-in and infrastructure dominance. SkyWater pivots around Advanced Technology Services, totaling roughly $260M, with Wafer Services at $27M-$73M, revealing a narrower focus and higher concentration risk. KLA’s diversified revenue mix cushions cyclicality, while SkyWater’s reliance on a few segments intensifies vulnerability to market shifts.
Strengths and Weaknesses Comparison
This table compares the strengths and weaknesses of KLA Corporation and SkyWater Technology, Inc.:
KLA Corporation Strengths
- High profitability with net margin of 33%
- Strong ROE at 87%
- Favorable current and quick ratios indicating liquidity
- Diverse revenue streams across semiconductor inspection and services
- Global presence with significant sales in China, Taiwan, and North America
SkyWater Technology Strengths
- Lower debt to assets ratio at 24%
- Favorable price-to-earnings ratio reflecting market expectations
- Positive asset turnover indicating efficient use of assets
- Concentrated revenue focus in advanced technology and wafer services
- Significant U.S. market sales supporting domestic operations
KLA Corporation Weaknesses
- High debt-to-equity ratio at 1.3
- Elevated WACC at 10.4% increasing capital costs
- Unfavorable valuation multiples (PE and PB ratios)
- Moderate dividend yield at 0.76%
- Some revenue segments less diversified compared to total portfolio
SkyWater Technology Weaknesses
- Negative profitability metrics with net margin and ROE below zero
- Unfavorable liquidity ratios with current ratio below 1
- High WACC at 19.9% signaling costly capital
- Low interest coverage ratio at 0.74, risking debt servicing
- Limited geographic diversification heavily reliant on U.S. market
KLA Corporation demonstrates robust profitability and global diversification, but faces challenges with capital costs and leverage. SkyWater Technology shows operational efficiency in asset use but struggles with profitability, liquidity, and geographic concentration. Both companies’ financial profiles suggest distinct strategic priorities amid their sector dynamics.
The Moat Duel: Analyzing Competitive Defensibility
A structural moat protects long-term profits from competition’s relentless erosion. Only durable advantages ensure sustainable earnings in the semiconductor sector:
KLA Corporation: Precision Process Control Moat
KLA’s moat stems from specialized process control technology, driving high ROIC well above WACC at 27.5%. Margin stability and 40% EBIT margin reflect pricing power. Expansion into advanced metrology deepens this moat in 2026.
SkyWater Technology, Inc.: Emerging Niche Manufacturer Moat
SkyWater leverages bespoke manufacturing services tailored for aerospace and defense, contrasting KLA’s scale. Despite a negative ROIC gap, rapid ROIC growth signals improving capital efficiency. Innovation in rad-hard ICs may widen its niche moat.
Moat Battle: Precision Control vs. Niche Customization
KLA holds a wider, more durable moat with superior value creation and margin strength. SkyWater’s improving profitability is promising but remains a smaller, vulnerable player. KLA is better equipped to defend its market share long term.
Which stock offers better returns?
Over the past year, both KLA Corporation and SkyWater Technology, Inc. displayed strong upward momentum, with notable acceleration and distinct trading volume patterns shaping their trends.
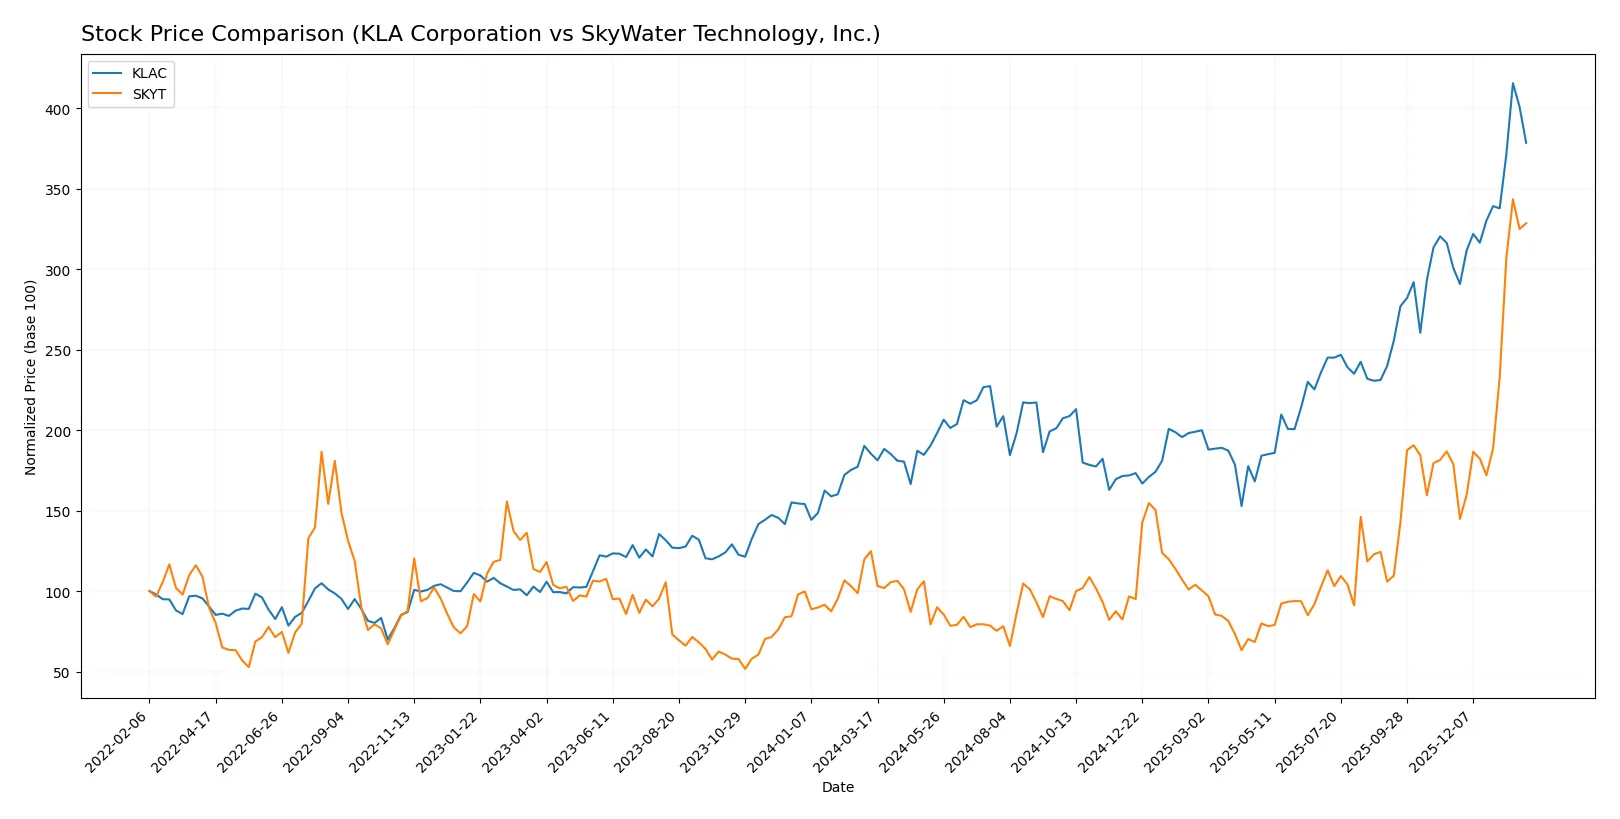
Trend Comparison
KLA Corporation’s stock surged 104.22% over the last 12 months, confirming a bullish trend with accelerating gains. Its price range spanned from 576.53 to 1567.82, showing significant volatility (std dev 213.25).
SkyWater Technology, Inc. outperformed with a 163.18% gain over the same period, also bullish with acceleration. Its volatility remained low (std dev 5.3), trading between 6.1 and 33.1.
SkyWater Technology delivered higher market performance compared to KLA, with a more pronounced price increase and steadier volatility during the analyzed year.
Target Prices
Analysts present a clear consensus on target prices for KLA Corporation and SkyWater Technology, Inc.
| Company | Target Low | Target High | Consensus |
|---|---|---|---|
| KLA Corporation | 1400 | 1900 | 1672.25 |
| SkyWater Technology, Inc. | 35 | 35 | 35 |
KLA’s consensus target of 1672.25 suggests upside from its current 1427.94 price, signaling moderate confidence. SkyWater’s target matches its current price of 31.66, indicating stable expectations.

Don’t Let Luck Decide Your Entry Point
Optimize your entry points with our advanced ProRealTime indicators. You’ll get efficient buy signals with precise price targets for maximum performance. Start outperforming now!
How do institutions grade them?
The following tables summarize the latest institutional grades for KLA Corporation and SkyWater Technology, Inc.:
KLA Corporation Grades
This table lists recent grades assigned by reputable financial institutions to KLA Corporation.
| Grading Company | Action | New Grade | Date |
|---|---|---|---|
| Oppenheimer | Maintain | Outperform | 2026-01-30 |
| Barclays | Maintain | Overweight | 2026-01-30 |
| Cantor Fitzgerald | Maintain | Overweight | 2026-01-30 |
| Jefferies | Maintain | Buy | 2026-01-30 |
| Stifel | Maintain | Buy | 2026-01-30 |
| Wells Fargo | Maintain | Overweight | 2026-01-30 |
| Needham | Maintain | Buy | 2026-01-30 |
| RBC Capital | Maintain | Sector Perform | 2026-01-30 |
| Deutsche Bank | Maintain | Hold | 2026-01-21 |
| Needham | Maintain | Buy | 2026-01-20 |
SkyWater Technology, Inc. Grades
This table includes recent institutional grades for SkyWater Technology, Inc. from recognized analysts.
| Grading Company | Action | New Grade | Date |
|---|---|---|---|
| TD Cowen | Downgrade | Hold | 2026-01-27 |
| Piper Sandler | Downgrade | Neutral | 2026-01-27 |
| Needham | Downgrade | Hold | 2026-01-27 |
| TD Cowen | Maintain | Buy | 2025-11-06 |
| Needham | Maintain | Buy | 2025-11-06 |
| Piper Sandler | Maintain | Overweight | 2025-11-06 |
| Needham | Maintain | Buy | 2025-08-07 |
| Needham | Maintain | Buy | 2025-05-08 |
| Needham | Maintain | Buy | 2025-02-27 |
| Needham | Maintain | Buy | 2024-11-11 |
Which company has the best grades?
KLA Corporation holds predominantly strong ratings such as Outperform and Buy, with no recent downgrades. SkyWater Technology experienced multiple downgrades to Hold and Neutral in early 2026. Investors may interpret KLA’s consistent positive grades as a signal of stronger institutional confidence compared to SkyWater’s recent cautious stance.
Risks specific to each company
The following categories identify critical pressure points and systemic threats facing both firms in the 2026 market environment:
1. Market & Competition
KLA Corporation
- Dominates semiconductor process control with a 187B market cap but faces intense innovation pressure.
SkyWater Technology, Inc.
- Smaller player with 1.5B market cap, competing in niche semiconductor manufacturing, vulnerable to larger incumbents.
2. Capital Structure & Debt
KLA Corporation
- Debt-to-equity at 1.3 is high, raising financial risk despite strong interest coverage of 16.4x.
SkyWater Technology, Inc.
- Also high debt-to-equity at 1.33, but weak interest coverage below 1x signals distress in servicing debt.
3. Stock Volatility
KLA Corporation
- Beta of 1.44 shows moderate sensitivity to market swings, typical for tech sector leaders.
SkyWater Technology, Inc.
- Extremely volatile with beta of 3.51, reflecting speculative trading and higher risk profile.
4. Regulatory & Legal
KLA Corporation
- Operates globally with exposure to export controls and IP regulations, a standard sector risk.
SkyWater Technology, Inc.
- Faces similar regulatory risks but less diversified, increasing sensitivity to regulatory changes.
5. Supply Chain & Operations
KLA Corporation
- Extensive supply chain with strong operational metrics but exposed to semiconductor cycle downturns.
SkyWater Technology, Inc.
- Smaller scale operations with less supply chain resilience, vulnerable to component shortages and disruptions.
6. ESG & Climate Transition
KLA Corporation
- Increasing focus on sustainability may require costly investments but supports long-term compliance.
SkyWater Technology, Inc.
- ESG initiatives less mature, risking reputational and regulatory impacts as climate policies tighten.
7. Geopolitical Exposure
KLA Corporation
- Global footprint exposes it to US-China tensions affecting supply and sales channels.
SkyWater Technology, Inc.
- More US-centric but still exposed to geopolitical risks in defense and aerospace segments.
Which company shows a better risk-adjusted profile?
KLA Corporation’s dominant market position and strong financial health, reflected in a safe Altman Z-score and very strong Piotroski score, outweigh its elevated debt levels. SkyWater’s higher volatility, weak interest coverage, and grey zone Altman Z-score signal significant financial stress. KLA’s moderate market volatility and operational scale provide a superior risk-adjusted profile. The critical risk for KLA is its high leverage; for SkyWater, it is its financial distress and poor liquidity. The 15% share price drop in KLA contrasts with SkyWater’s persistent negative margins and low liquidity, underscoring KLA’s greater resilience.
Final Verdict: Which stock to choose?
KLA Corporation’s superpower lies in its durable competitive advantage, demonstrated by a rising ROIC well above its cost of capital. It generates robust cash flow with exceptional operational efficiency, making it a value creator in the semiconductor equipment sector. A point of vigilance is its elevated leverage, which might amplify risks in downturns. KLAC suits investors targeting aggressive growth with a tolerance for cyclical industry swings.
SkyWater Technology’s strategic moat is its niche position in semiconductor manufacturing, supported by improving profitability and rapid revenue growth. While SKYT shows signs of financial strain and a weaker balance sheet, its operational momentum and market acceleration offer upside potential. This stock fits better within a Growth at a Reasonable Price (GARP) portfolio that can stomach early-stage volatility.
If you prioritize durable value creation and consistent cash generation, KLAC is the compelling choice due to its proven moat and operational strength. However, if you seek higher growth potential with a tolerance for financial risk, SKYT offers better upside in a niche segment. Both stocks command investor attention, but their profiles cater to distinctly different risk appetites and investment strategies.
Disclaimer: Investment carries a risk of loss of initial capital. The past performance is not a reliable indicator of future results. Be sure to understand risks before making an investment decision.
Go Further
I encourage you to read the complete analyses of KLA Corporation and SkyWater Technology, Inc. to enhance your investment decisions: