Home > Comparison > Technology > KLAC vs SLAB
The strategic rivalry between KLA Corporation and Silicon Laboratories Inc. shapes the semiconductor sector’s innovation frontiers. KLA operates as a capital-intensive leader in semiconductor process control and inspection solutions, while Silicon Labs excels as a nimble fabless provider of mixed-signal and IoT-focused components. This faceoff highlights a contest between established industrial complexity and agile product specialization. This analysis will reveal which strategy delivers superior risk-adjusted returns for a diversified portfolio in 2026.
Table of contents
Companies Overview
KLA Corporation and Silicon Laboratories Inc. shape critical segments of the semiconductor industry with distinct market roles.
KLA Corporation: Semiconductor Process Control Leader
KLA Corporation dominates the semiconductor process control market. It generates revenue from advanced inspection, metrology, and yield management tools critical to IC manufacturing. In 2026, KLA’s strategic focus remains on enhancing integrated circuit yield through cutting-edge process-enabling solutions that address defect detection and process optimization worldwide.
Silicon Laboratories Inc.: Fabless IoT Solutions Specialist
Silicon Laboratories Inc. excels as a fabless semiconductor provider of analog-intensive mixed-signal products. Its core revenue stems from wireless microcontrollers and sensors embedded in IoT applications across diverse sectors. The company centers its 2026 strategy on expanding IoT adoption through innovative, energy-efficient connectivity and sensor solutions for smart homes, industrial automation, and medical devices.
Strategic Collision: Similarities & Divergences
Both companies operate in semiconductors but embrace contrasting philosophies—KLA focuses on equipment and software ecosystem control for manufacturing precision, while Silicon Labs prioritizes an open, fabless design model for IoT innovation. Their primary battleground lies in enabling next-generation electronics, with KLA targeting manufacturing efficiency and Silicon Labs driving device-level connectivity. This divergence creates distinct investment profiles: one anchored in capital-intensive process control, the other in agile, software-driven product development.
Income Statement Comparison
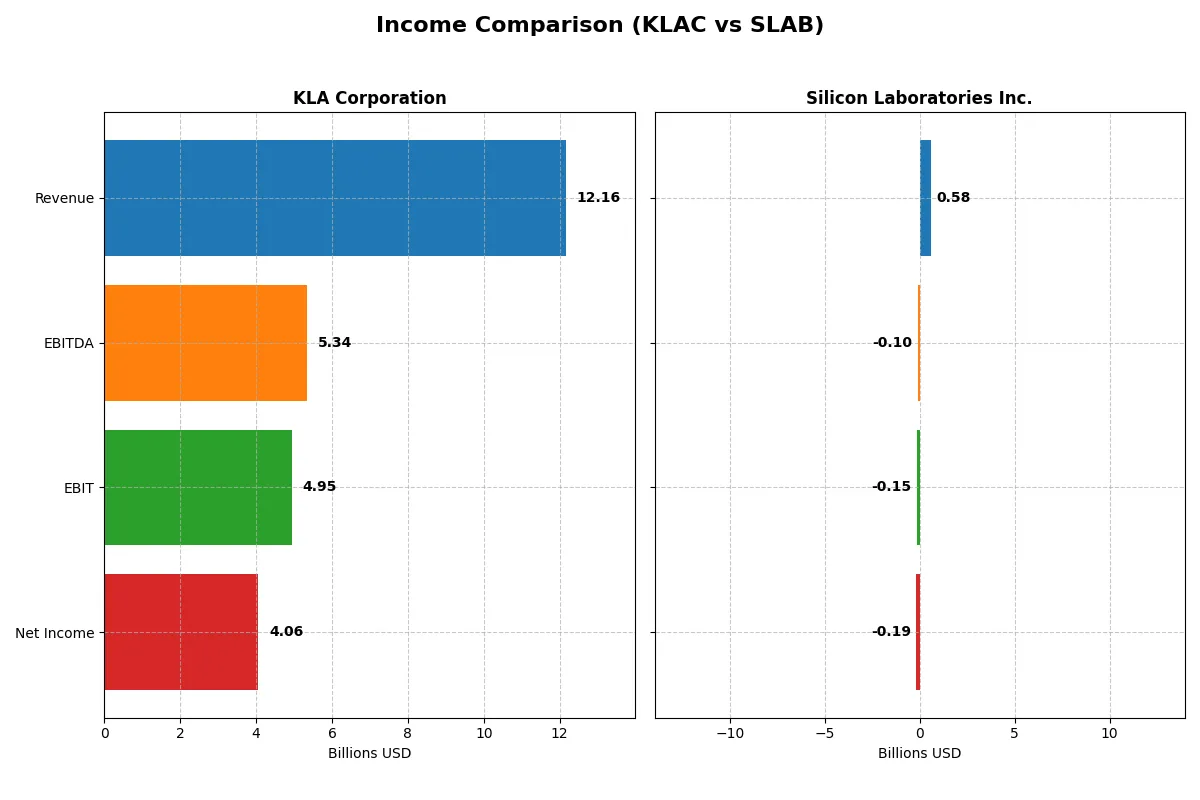
This data dissects the core profitability and scalability of both corporate engines to reveal who dominates the bottom line:
| Metric | KLA Corporation (KLAC) | Silicon Laboratories Inc. (SLAB) |
|---|---|---|
| Revenue | 12.2B | 584M |
| Cost of Revenue | 4.58B | 272M |
| Operating Expenses | 2.33B | 478M |
| Gross Profit | 7.58B | 312M |
| EBITDA | 5.34B | -105M |
| EBIT | 4.95B | -153M |
| Interest Expense | 302M | 1.31M |
| Net Income | 4.06B | -191M |
| EPS | 30.53 | -5.93 |
| Fiscal Year | 2025 | 2024 |
Income Statement Analysis: The Bottom-Line Duel
This income statement comparison reveals which company runs a more efficient, profitable corporate engine through recent revenue and profit performances.
KLA Corporation Analysis
KLA’s revenue surged from $6.9B in 2021 to $12.2B in 2025, with net income growing from $2.1B to $4.1B. Its gross margin stands strong at 62.3%, reflecting efficient cost management. The 2025 net margin of 33.4% highlights robust profitability and momentum, fueled by favorable operating leverage and disciplined expenses.
Silicon Laboratories Inc. Analysis
Silicon Labs saw revenue peak at $1B in 2022 but slipped to $584M in 2024, with net income turning deeply negative at -$191M last year. Although it maintains a decent gross margin of 53.4%, the net margin is negative at -32.7%, signaling operational struggles. The declining revenue and widening losses in 2024 underscore weakening efficiency and margin pressure.
Margin Dominance vs. Profitability Challenges
KLA demonstrates strong, consistent revenue growth paired with expanding margins and solid profits. Silicon Labs faces shrinking revenue and persistent losses, despite maintaining a respectable gross margin. KLA’s profile clearly wins on fundamental profitability and operational efficiency, making it a more compelling model for investors seeking stable earnings growth.
Financial Ratios Comparison
These vital ratios act as a diagnostic tool to expose the underlying fiscal health, valuation premiums, and capital efficiency of each company:
| Ratios | KLA Corporation (KLAC) | Silicon Laboratories Inc. (SLAB) |
|---|---|---|
| ROE | 86.6% | -17.7% |
| ROIC | 38.0% | -14.7% |
| P/E | 29.3 | -21.5 |
| P/B | 25.4 | 3.81 |
| Current Ratio | 2.62 | 6.15 |
| Quick Ratio | 1.83 | 5.07 |
| D/E | 1.30 | 0.014 |
| Debt-to-Assets | 37.9% | 1.3% |
| Interest Coverage | 17.3 | -126.3 |
| Asset Turnover | 0.76 | 0.48 |
| Fixed Asset Turnover | 9.70 | 4.42 |
| Payout ratio | 22.3% | 0% |
| Dividend yield | 0.76% | 0% |
| Fiscal Year | 2025 | 2024 |
Efficiency & Valuation Duel: The Vital Signs
Financial ratios serve as a company’s DNA, uncovering hidden risks and operational strengths that drive investment decisions.
KLA Corporation
KLA demonstrates outstanding profitability with an 86.6% ROE and a robust 33.4% net margin, signaling operational excellence. Despite a stretched P/E of 29.3 and a high P/B of 25.4, the stock reflects investor confidence in growth. Shareholders receive modest dividends (0.76%), balanced by steady reinvestment in R&D, fueling innovation.
Silicon Laboratories Inc.
Silicon Labs shows weak core profitability with negative ROE (-17.7%) and net margin (-32.7%), reflecting operational challenges. Its negative P/E contrasts with a modest P/B of 3.8, suggesting valuation concerns. The company pays no dividend, focusing heavily on R&D (over 56% of revenue) to drive future growth despite current financial strain.
Premium Valuation vs. Operational Safety
KLA offers a superior balance of high profitability and clear operational efficiency, albeit at a premium valuation. Silicon Labs carries significant risks with negative returns and high R&D spend but offers potential upside if growth materializes. KLA suits risk-averse investors; Silicon Labs fits those seeking speculative growth.
Which one offers the Superior Shareholder Reward?
I see KLA Corporation (KLAC) provides a balanced distribution with a 0.76% dividend yield and a modest 22% payout ratio, ensuring dividends are well-covered by free cash flow (FCF/Capex ratio ~3.3). KLAC also executes consistent share buybacks, enhancing total return. Silicon Laboratories Inc. (SLAB) pays no dividends and reports negative margins, reflecting operational struggles. SLAB reinvests heavily in R&D and growth but lacks buyback activity. Historically, KLAC’s sustainable dividend combined with steady buybacks offers a stronger total return profile. I conclude KLAC outperforms SLAB in shareholder reward for 2026.
Comparative Score Analysis: The Strategic Profile
The radar chart reveals the fundamental DNA and trade-offs of both firms, highlighting their financial strengths and valuation profiles:
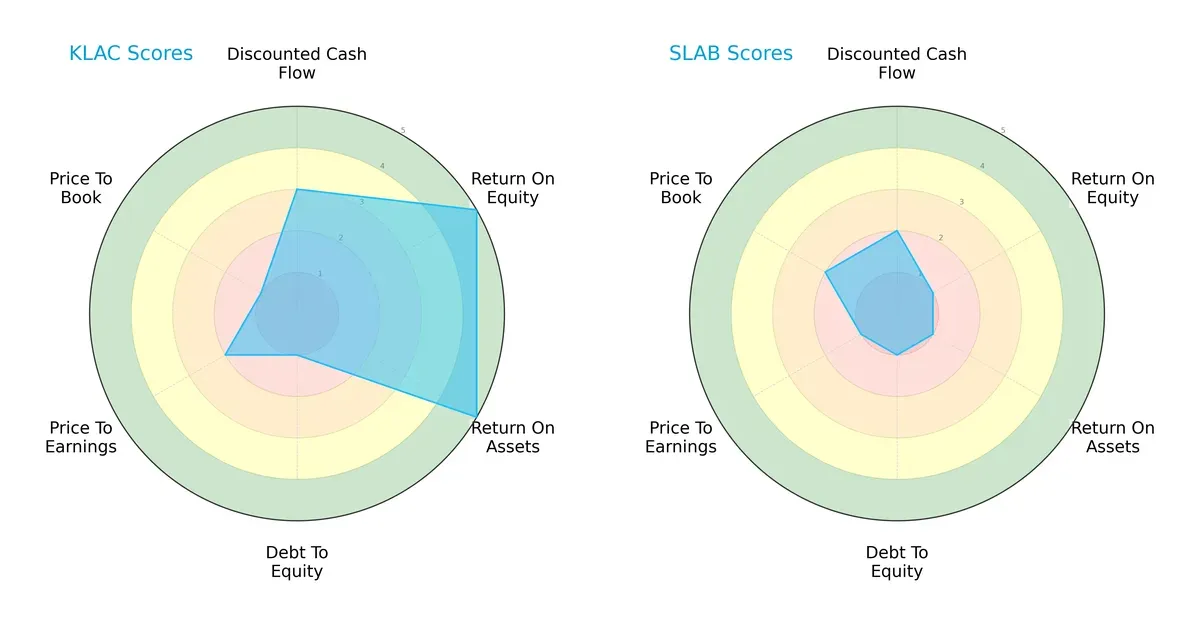
KLA Corporation boasts a more balanced profile with very favorable ROE and ROA scores (5 each), signaling efficient profit generation and asset utilization. However, it carries notable financial risk, reflected in its very unfavorable debt-to-equity (1) and price-to-book (1) scores. Silicon Laboratories Inc. shows broad weaknesses, scoring very unfavorable (1) across most metrics except a slightly better price-to-book score (2). KLA relies on operational excellence but must manage leverage risks, while Silicon Laboratories lacks a clear competitive edge.
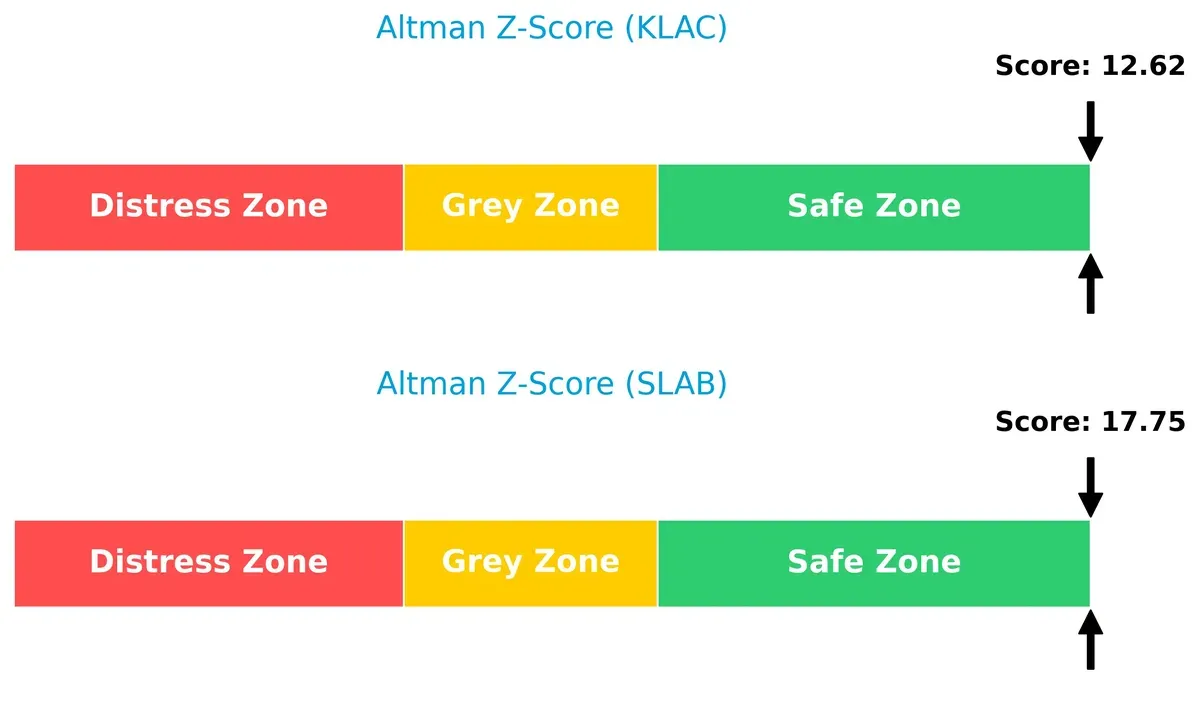
Bankruptcy Risk: Solvency Showdown
The Altman Z-Score gap indicates both firms are in the safe zone, but Silicon Laboratories’ higher score (17.75 vs. 12.62) suggests superior solvency and lower bankruptcy risk in this cycle:
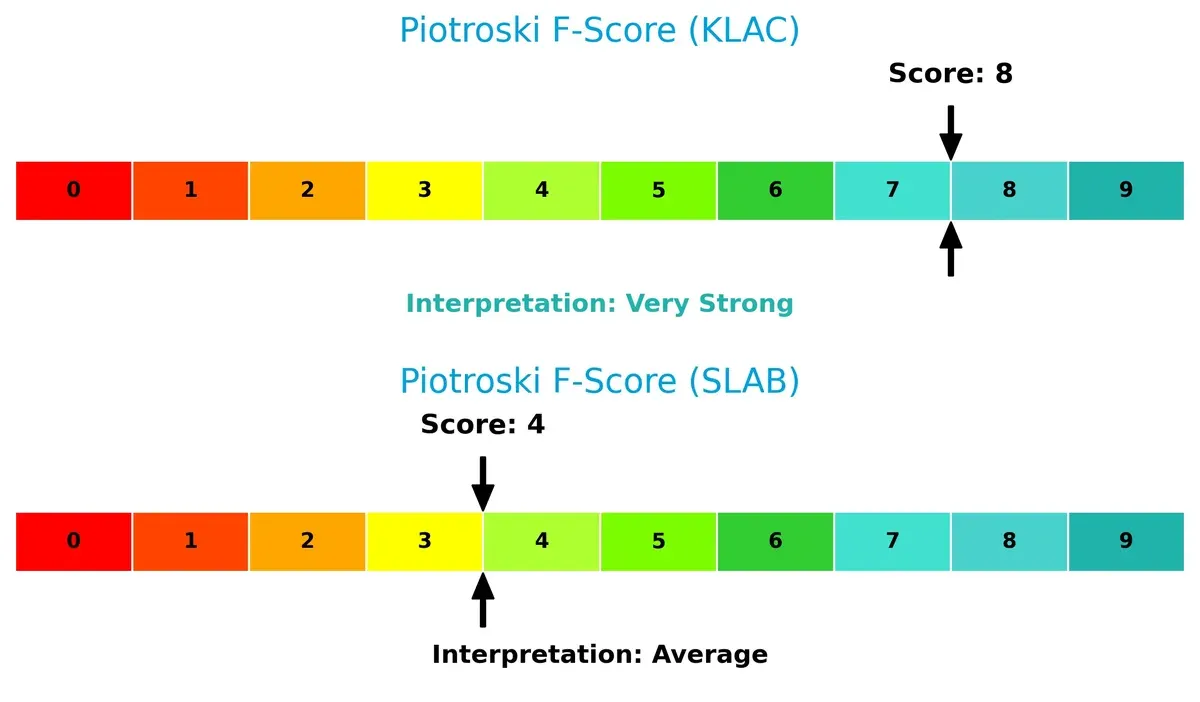
Financial Health: Quality of Operations
KLA leads with a very strong Piotroski F-Score of 8, demonstrating robust profitability, liquidity, and operational efficiency. Silicon Laboratories’ average score of 4 raises red flags about its internal financial health and operational consistency:
How are the two companies positioned?
This section dissects KLAC and SLAB’s operational DNA by comparing revenue distribution and internal strengths and weaknesses. The goal is to confront their economic moats to reveal which model offers the most resilient competitive advantage today.
Revenue Segmentation: The Strategic Mix
This visual comparison dissects how KLA Corporation and Silicon Laboratories diversify their income streams and reveals their primary sector bets:
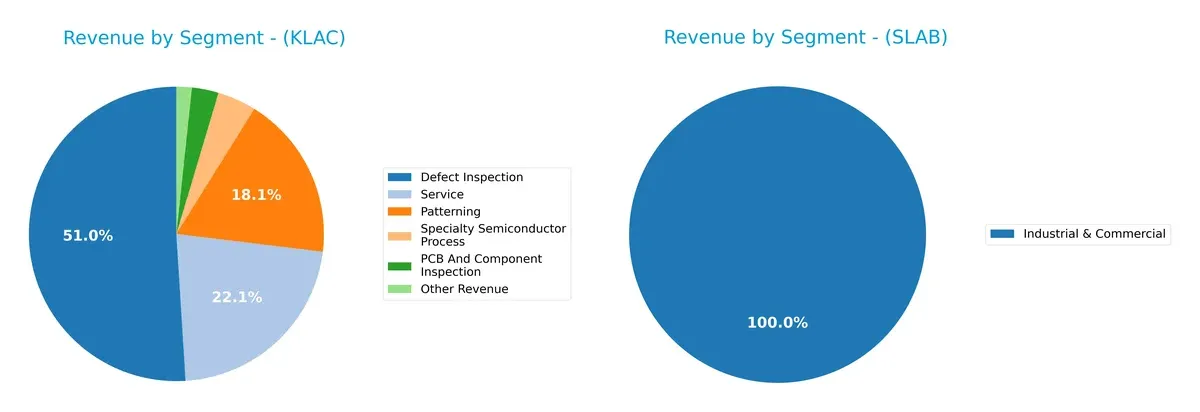
KLA dominates with a broad portfolio, led by Defect Inspection at $6.2B and strong contributions from Service ($2.7B) and Patterning ($2.2B). This mix anchors KLA’s ecosystem lock-in in semiconductor equipment. In contrast, Silicon Labs relies heavily on a single segment, Industrial & Commercial, at $497M in 2023, signaling concentration risk. KLA’s diversified segments mitigate cyclicality; Silicon Labs must deepen its footprint to reduce vulnerability.
Strengths and Weaknesses Comparison
This table compares the Strengths and Weaknesses of KLA Corporation and Silicon Laboratories Inc.:
KLA Corporation Strengths
- Strong profitability with 33.4% net margin and 86.6% ROE
- Favorable liquidity ratios with 2.62 current and 1.83 quick ratios
- High fixed asset turnover at 9.7 indicates efficient use of assets
- Diverse product segments including defect inspection and patterning
- Substantial global presence, notably in China and Taiwan
Silicon Laboratories Strengths
- Favorable price-to-earnings ratio despite losses
- Very low debt-to-equity and debt-to-assets ratios support financial stability
- Quick ratio at 5.07 indicates strong short-term liquidity
- Product focus on industrial and commercial markets with IoT exposure
- Geographic diversification including China, US, and rest of world
KLA Corporation Weaknesses
- High valuation multiples with P/E at 29.3 and P/B at 25.4 may indicate overvaluation
- Elevated debt-to-equity ratio at 1.3 suggests leverage risk
- WACC at 10.4% exceeds ROIC benchmark
- Dividend yield low at 0.76%
- Moderate asset turnover at 0.76
Silicon Laboratories Weaknesses
- Negative profitability metrics: -32.7% net margin and -17.7% ROE
- Negative interest coverage ratio at -117 signals financial distress
- Unfavorable asset turnover at 0.48 limits operational efficiency
- Declining revenues and concentration in fewer product segments
- Current ratio unusually high at 6.15 may reflect inefficient asset use
KLA shows robust profitability and operational efficiency across diverse markets, tempered by high valuation and leverage. Silicon Labs faces significant profitability and operational challenges despite strong liquidity and low debt, impacting its strategic positioning.
The Moat Duel: Analyzing Competitive Defensibility
A structural moat is the only reliable shield protecting long-term profits from relentless competition erosion. Let’s analyze the moats of two semiconductor firms:
KLA Corporation: Precision Process Control Moat
KLA’s moat stems from its advanced process control technology, reflected in a high ROIC well above WACC (27.5%) and stable 62% gross margins. Its expanding footprint in Asia and innovation in semiconductor inspection deepen this moat in 2026.
Silicon Laboratories Inc.: Niche Mixed-Signal Innovation Moat
Silicon Labs relies on specialized analog and mixed-signal solutions for IoT, but its negative ROIC and shrinking margins reveal a weak moat. Its niche focus contrasts with KLA’s broader process control dominance, yet growth remains challenged in 2026.
Verdict: Process Control Dominance vs. Niche Innovation Fragility
KLA’s wide and durable moat, driven by superior capital efficiency and global scale, outmatches Silicon Labs’ narrow and eroding moat. KLA is clearly better equipped to defend and grow its market share.
Which stock offers better returns?
Over the past 12 months, KLA Corporation’s stock soared with accelerating gains, while Silicon Laboratories Inc. faced a slight overall decline despite recent recovery signs.
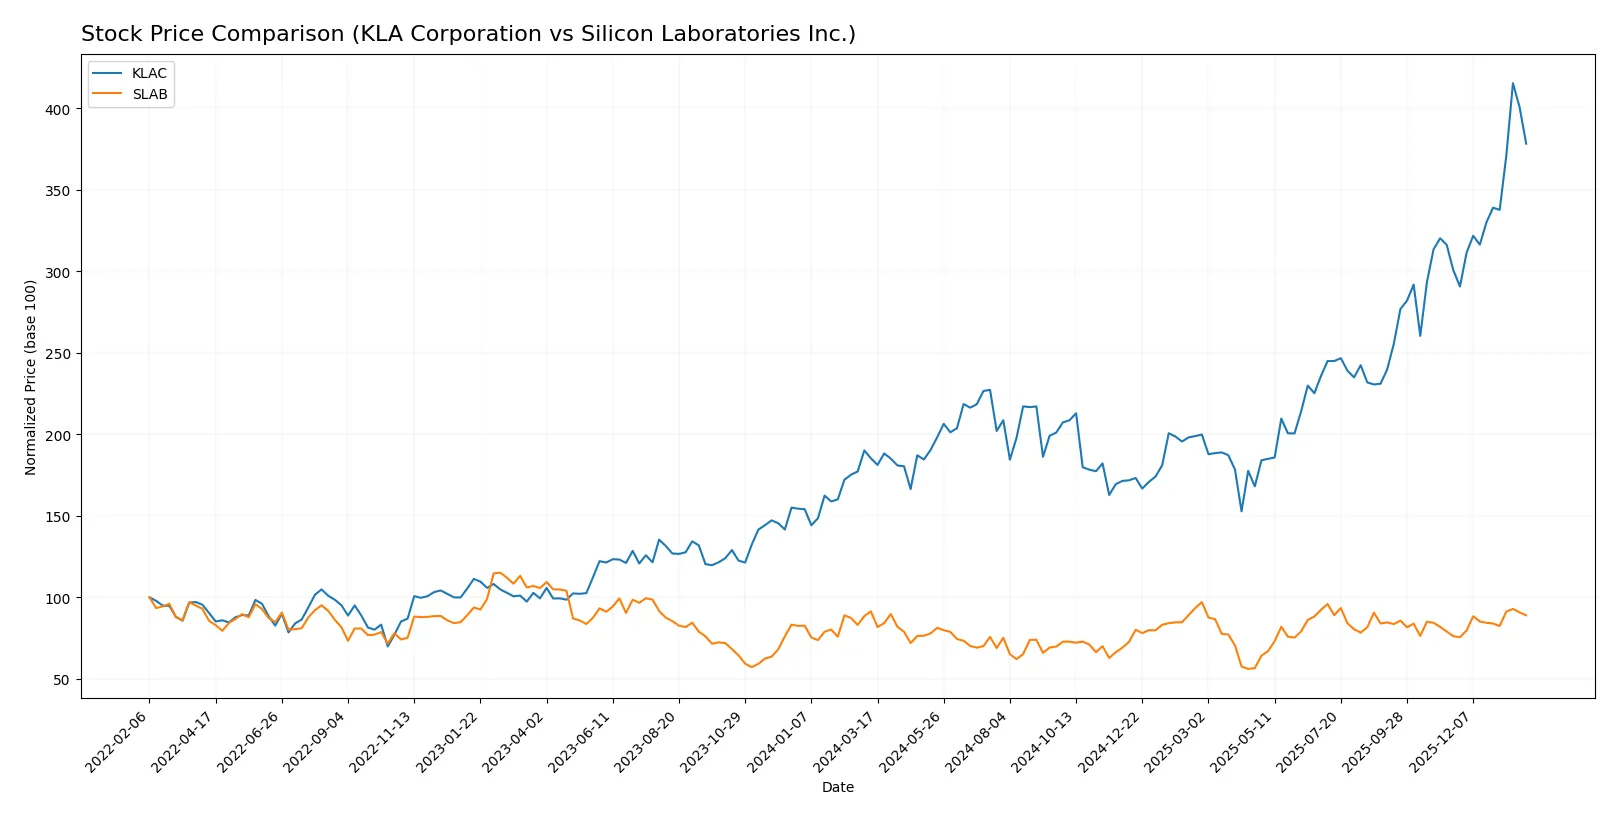
Trend Comparison
KLA Corporation’s stock gained 104.22% over the past year, showing a bullish trend with accelerating momentum and high volatility between 577 and 1,568.
Silicon Laboratories Inc. dropped 2.65% in the same period, marking a bearish trend despite a recent 16.87% rebound and moderate volatility between 90 and 155.
KLA Corporation clearly outperformed Silicon Laboratories, delivering the highest market performance with strong upward acceleration.
Target Prices
Analysts present a clear consensus on target prices for KLA Corporation and Silicon Laboratories Inc.
| Company | Target Low | Target High | Consensus |
|---|---|---|---|
| KLA Corporation | 1400 | 1900 | 1672.25 |
| Silicon Laboratories Inc. | 130 | 165 | 151.67 |
KLA’s target consensus at 1672.25 exceeds its current 1427.94 price, signaling upside potential. Silicon Laboratories’ consensus of 151.67 also sits above its 142.45 price, indicating moderate analyst optimism.

Don’t Let Luck Decide Your Entry Point
Optimize your entry points with our advanced ProRealTime indicators. You’ll get efficient buy signals with precise price targets for maximum performance. Start outperforming now!
How do institutions grade them?
The following tables summarize recent institutional grades for KLA Corporation and Silicon Laboratories Inc.:
KLA Corporation Grades
This table shows KLA Corporation’s current grades from notable investment firms.
| Grading Company | Action | New Grade | Date |
|---|---|---|---|
| Oppenheimer | Maintain | Outperform | 2026-01-30 |
| Barclays | Maintain | Overweight | 2026-01-30 |
| Cantor Fitzgerald | Maintain | Overweight | 2026-01-30 |
| Jefferies | Maintain | Buy | 2026-01-30 |
| Stifel | Maintain | Buy | 2026-01-30 |
| Wells Fargo | Maintain | Overweight | 2026-01-30 |
| Needham | Maintain | Buy | 2026-01-30 |
| RBC Capital | Maintain | Sector Perform | 2026-01-30 |
| Deutsche Bank | Maintain | Hold | 2026-01-21 |
| Needham | Maintain | Buy | 2026-01-20 |
Silicon Laboratories Inc. Grades
This table lists Silicon Laboratories Inc.’s most recent institutional grades.
| Grading Company | Action | New Grade | Date |
|---|---|---|---|
| Susquehanna | Maintain | Neutral | 2025-08-06 |
| Morgan Stanley | Maintain | Equal Weight | 2025-08-06 |
| Barclays | Maintain | Equal Weight | 2025-08-05 |
| Susquehanna | Maintain | Neutral | 2025-07-22 |
| Stifel | Maintain | Buy | 2025-07-18 |
| Keybanc | Maintain | Overweight | 2025-07-08 |
| Benchmark | Maintain | Buy | 2025-05-27 |
| Benchmark | Maintain | Buy | 2025-05-14 |
| Needham | Maintain | Buy | 2025-05-14 |
| Susquehanna | Maintain | Neutral | 2025-05-14 |
Which company has the best grades?
KLA Corporation holds consistently higher ratings, including multiple “Buy” and “Outperform” grades. Silicon Laboratories’ ratings cluster around “Neutral” and “Equal Weight” with fewer “Buy” endorsements. KLA’s stronger grades may attract more investor confidence and imply better perceived growth or stability.
Risks specific to each company
The following categories identify the critical pressure points and systemic threats facing both firms in the 2026 market environment:
1. Market & Competition
KLA Corporation
- Dominates semiconductor process control with strong market cap but faces high competition in advanced tech.
Silicon Laboratories Inc.
- Operates in niche mixed-signal IoT markets but struggles with negative margins and smaller scale.
2. Capital Structure & Debt
KLA Corporation
- High debt-to-equity ratio (1.3) signals leverage risk despite strong interest coverage.
Silicon Laboratories Inc.
- Minimal debt (D/E 0.01) limits financial risk but poor interest coverage and negative profitability raise concerns.
3. Stock Volatility
KLA Corporation
- Beta 1.44 indicates moderate volatility typical for semiconductor sector.
Silicon Laboratories Inc.
- Higher beta 1.54 suggests greater stock price swings, increasing investment risk.
4. Regulatory & Legal
KLA Corporation
- Operates globally with exposure to evolving semiconductor regulations and export controls.
Silicon Laboratories Inc.
- Faces regulatory scrutiny in multiple IoT markets, potentially impacting product certifications.
5. Supply Chain & Operations
KLA Corporation
- Complex global supply chain with risk from semiconductor material shortages.
Silicon Laboratories Inc.
- Fabless model reduces capital intensity but increases dependence on third-party foundries.
6. ESG & Climate Transition
KLA Corporation
- Large operations require active ESG management; pressure to reduce carbon footprint.
Silicon Laboratories Inc.
- Smaller scale eases transition but less resource to invest in ESG initiatives.
7. Geopolitical Exposure
KLA Corporation
- Significant exposure to US-China tensions affecting semiconductor supply and sales.
Silicon Laboratories Inc.
- Similarly exposed, but scale and product focus may limit direct geopolitical impact.
Which company shows a better risk-adjusted profile?
KLA’s primary risk is its high leverage amid a challenging semiconductor cycle. Silicon Labs struggles with profitability and operational efficiency, heightening financial distress risk. Despite some leverage concerns, KLA’s robust profitability and strong Altman Z-score position it as the safer, better risk-adjusted choice. Silicon Labs’ persistent losses and volatile margins justify caution.
Final Verdict: Which stock to choose?
KLA Corporation’s superpower lies in its durable competitive moat, demonstrated by a robust and growing return on invested capital far exceeding its cost of capital. Its disciplined capital allocation and strong cash generation underpin sustained profitability. The key point of vigilance remains its relatively high valuation multiples, which could limit upside. KLAC suits portfolios aiming for aggressive growth backed by operational excellence.
Silicon Laboratories Inc. offers a strategic moat in specialized semiconductor niches with significant R&D investment fueling innovation and potential future breakthroughs. It presents a safer balance sheet profile with low debt, but ongoing negative returns and declining profitability signal caution. SLAB fits investors who prefer GARP—growth at a reasonable price—but with a higher tolerance for operational risk.
If you prioritize consistent value creation and strong profitability, KLAC outshines with superior financial health and operational momentum despite its premium valuation. However, if you seek speculative growth with a focus on innovation potential and balance sheet safety, SLAB offers better stability but carries notable execution risks. Each stock appeals to distinctly different investor avatars depending on risk appetite and investment horizon.
Disclaimer: Investment carries a risk of loss of initial capital. The past performance is not a reliable indicator of future results. Be sure to understand risks before making an investment decision.
Go Further
I encourage you to read the complete analyses of KLA Corporation and Silicon Laboratories Inc. to enhance your investment decisions: