Home > Comparison > Technology > KLAC vs Q
The strategic rivalry between KLA Corporation and Qnity Electronics defines the current trajectory of the semiconductor sector. KLA, a capital-intensive process control and yield management leader, contrasts sharply with Qnity’s emerging role as a specialized electronic materials provider. This head-to-head pits a market-dominant incumbent against a nimble challenger. This analysis will determine which corporate trajectory delivers superior risk-adjusted returns for a diversified portfolio in today’s evolving tech landscape.
Table of contents
Companies Overview
KLA Corporation and Qnity Electronics shape critical segments of the semiconductor supply chain.
KLA Corporation: Semiconductor Process Control Leader
KLA Corporation commands a dominant market position in semiconductor process control. It generates revenue by selling advanced inspection, metrology, and yield management solutions globally. In 2026, KLA focuses on enhancing integrated circuit manufacturing through software-driven process control and expanding specialty semiconductor and PCB inspection technologies.
Qnity Electronics, Inc.: Advanced Materials Innovator
Qnity Electronics emerges as a specialist supplier of electronic solutions and advanced materials for semiconductor chip manufacturing. Its revenue stems from providing critical materials that enable chip fabrication. Since its 2025 rebranding, Qnity concentrates on scaling its presence in electronic materials, targeting the growing demand for semiconductor production inputs.
Strategic Collision: Similarities & Divergences
KLA emphasizes a technology-driven ecosystem with integrated hardware and software for yield enhancement. Qnity opts for a materials-centric approach, supplying essential inputs rather than finished tools. They compete indirectly within semiconductor manufacturing, with KLA controlling process quality and Qnity enabling fabrication. Investors face distinct profiles: KLA offers mature, diversified exposure; Qnity represents an emerging, niche growth opportunity.
Income Statement Comparison
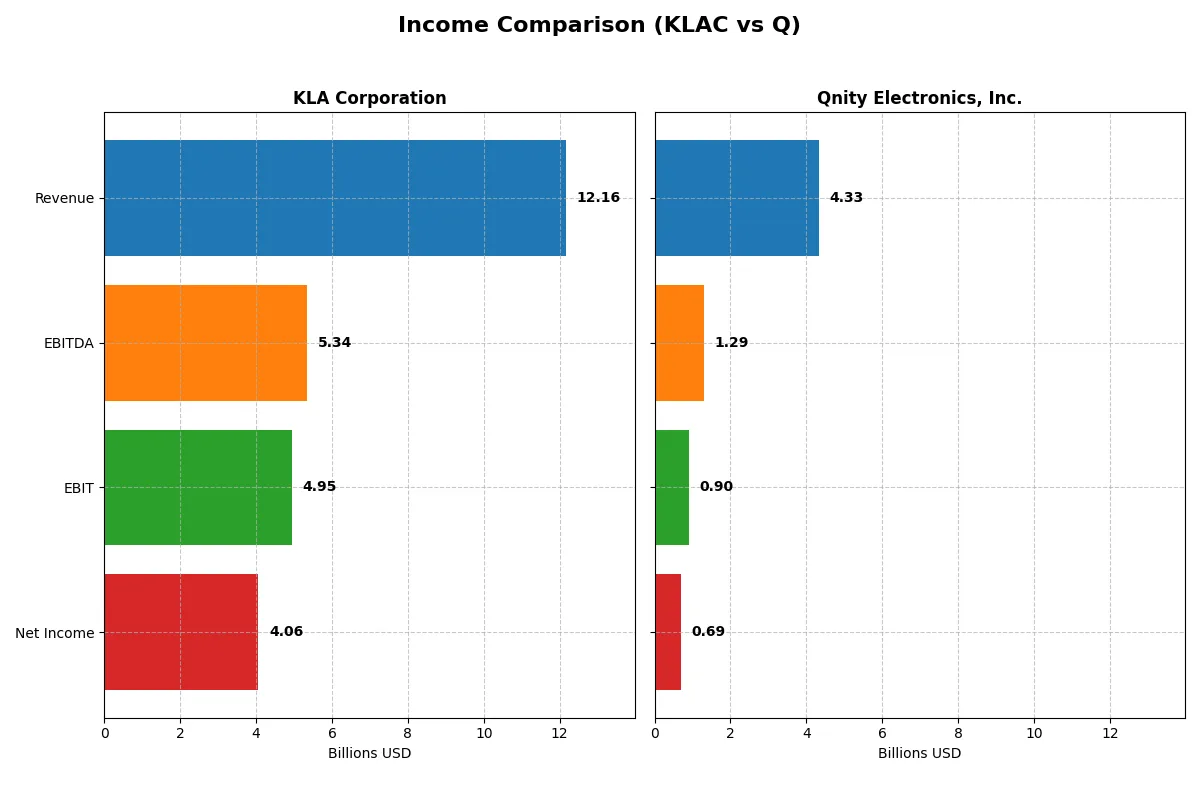
This data dissects the core profitability and scalability of both corporate engines to reveal who dominates the bottom line:
| Metric | KLA Corporation (KLAC) | Qnity Electronics, Inc. (Q) |
|---|---|---|
| Revenue | 12.2B | 4.3B |
| Cost of Revenue | 4.6B | 2.3B |
| Operating Expenses | 2.3B | 1.2B |
| Gross Profit | 7.6B | 2.0B |
| EBITDA | 5.3B | 1.3B |
| EBIT | 4.9B | 898M |
| Interest Expense | 302M | 280M |
| Net Income | 4.1B | 693M |
| EPS | 30.53 | 3.31 |
| Fiscal Year | 2025 | 2024 |
Income Statement Analysis: The Bottom-Line Duel
This income statement comparison reveals which company drives greater efficiency and profitability through its core operations and margin management.
KLA Corporation Analysis
KLA’s revenue surged from $6.9B in 2021 to $12.2B in 2025, nearly doubling net income from $2.1B to $4.1B. Its gross margin remains robust at 62.3%, while net margin expanded to 33.4%, reflecting superior cost control and scaling benefits. The latest fiscal year shows strong momentum with 24% revenue growth and a 50% EPS jump, indicating exceptional operational efficiency.
Qnity Electronics, Inc. Analysis
Qnity’s revenue fluctuated, declining 9% overall to $4.3B in 2024, with net income falling 10% to $693M. Despite a favorable gross margin of 46.1%, its net margin lags at 16%, constrained by higher interest costs and operating expenses. The most recent year shows moderate revenue growth of 7.4% and a solid 37% EPS increase, signaling improving profitability but weaker top-line expansion.
Margin Leadership vs. Growth Stability
KLA clearly outperforms with superior margin expansion and nearly doubling revenue and net income over five years. Qnity’s profile shows weaker revenue traction and compressed margins, despite recent EPS growth. For investors prioritizing efficiency and scale, KLA’s consistent margin leadership offers a more compelling fundamental foundation.
Financial Ratios Comparison
These vital ratios act as a diagnostic tool to expose underlying fiscal health, valuation premiums, and capital efficiency of the companies compared below:
| Ratios | KLA Corporation (KLAC) | Qnity Electronics, Inc. (Q) |
|---|---|---|
| ROE | 86.6% | 6.5% |
| ROIC | 38.0% | 5.9% |
| P/E | 29.3 | 28.8 |
| P/B | 25.4 | 1.88 |
| Current Ratio | 2.62 | 1.77 |
| Quick Ratio | 1.83 | 1.06 |
| D/E | 1.30 | 0.018 |
| Debt-to-Assets | 37.9% | 1.56% |
| Interest Coverage | 17.3 | 3.03 |
| Asset Turnover | 0.76 | 0.35 |
| Fixed Asset Turnover | 9.70 | 2.59 |
| Payout ratio | 22.3% | 0% |
| Dividend yield | 0.76% | 0% |
| Fiscal Year | 2025 | 2024 |
Efficiency & Valuation Duel: The Vital Signs
Ratios act as a company’s DNA, revealing hidden risks and operational excellence that shape its financial health and market stance.
KLA Corporation
KLA dominates with an exceptional 87% ROE and a strong 33% net margin, signaling robust profitability. However, its 29.3 P/E and 25.4 P/B ratios mark it as expensive and stretched. Dividend yield is modest at 0.76%, reflecting a cautious shareholder return approach balanced with heavy R&D reinvestment above 11%.
Qnity Electronics, Inc.
Qnity posts a modest 6.5% ROE and a 16% net margin, showing moderate profitability but less efficiency than KLA. Its P/E of 28.8 appears stretched relative to returns, though a low 1.88 P/B ratio tempers valuation concerns. Qnity pays no dividend, focusing on reinvestment for growth with a 7% R&D-to-revenue spend.
Premium Valuation vs. Operational Safety
KLA offers superior profitability and operational efficiency but trades at a premium, exposing investors to valuation risk. Qnity shows more conservative leverage and valuation but delivers weaker returns. KLA suits investors seeking growth and operational strength; Qnity fits those prioritizing balance sheet safety and reinvestment potential.
Which one offers the Superior Shareholder Reward?
I observe that KLA Corporation (KLAC) pays a modest dividend yield near 0.76% with a sustainable payout ratio around 22%. Its free cash flow coverage of dividends exceeds 3x, signaling strong capacity for distributions. KLAC also runs a robust buyback program, enhancing total shareholder return. Qnity Electronics (Q) offers no dividends but reinvests heavily in growth, as seen in its solid free cash flow and capex coverage. However, Q’s weaker profit margins and absence of buybacks limit immediate shareholder rewards. I conclude KLAC delivers a superior total return profile in 2026 due to balanced dividends, aggressive buybacks, and sustainable cash flow generation.
Comparative Score Analysis: The Strategic Profile
The radar chart reveals the fundamental DNA and trade-offs of both firms, highlighting their financial strengths and valuation nuances:
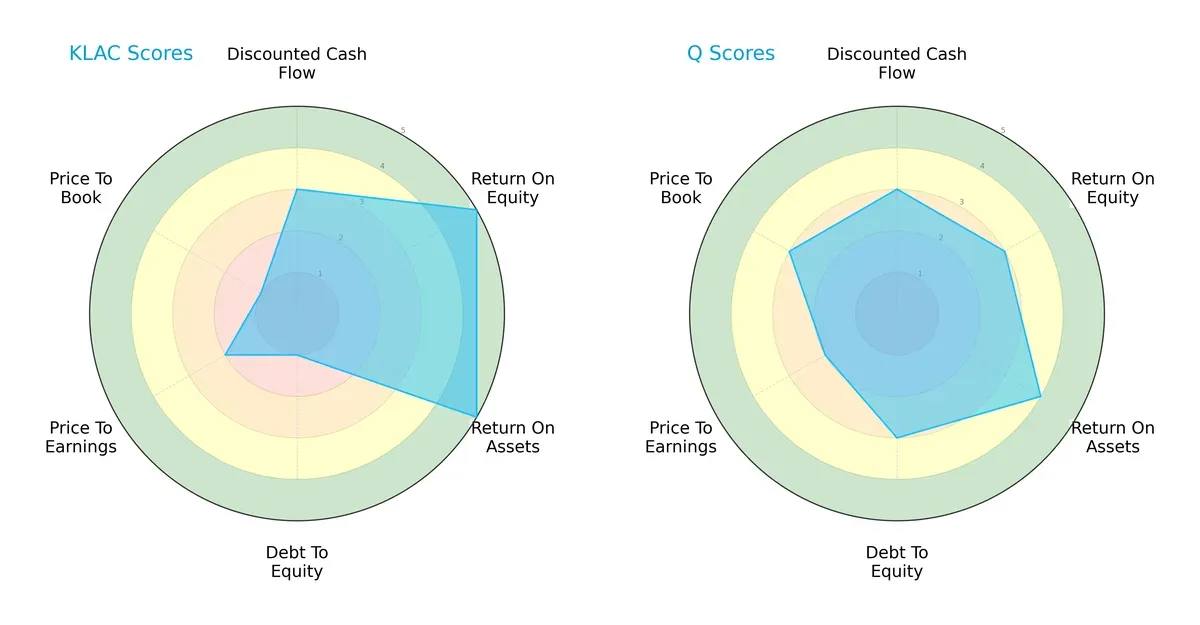
KLA Corporation excels in profitability with top-tier ROE and ROA scores (5 each), signaling efficient capital use. However, it bears significant financial risk, reflected in its very unfavorable debt-to-equity and price-to-book scores (1 each). Qnity Electronics offers a more balanced profile, with moderate profitability (ROE 3, ROA 4) and a healthier leverage position (debt-to-equity 3). Its valuation metrics also appear less stretched, suggesting Qnity relies less on margin dominance and more on stable financial footing.
Bankruptcy Risk: Solvency Showdown
KLA’s Altman Z-Score stands at a robust 12.6, placing it firmly in the safe zone, which implies strong solvency and resilience against bankruptcy risk in this cycle:

Financial Health: Quality of Operations
KLA’s Piotroski F-Score of 8 signals very strong financial health, indicating solid profitability, liquidity, and operational efficiency compared to typical industry peers:

How are the two companies positioned?
This section dissects the operational DNA of KLA and Q by comparing their revenue distribution and internal dynamics. The goal is to confront their economic moats to identify which model offers the most resilient competitive advantage today.
Revenue Segmentation: The Strategic Mix
The following visual comparison dissects how KLA Corporation and Qnity Electronics, Inc. diversify their income streams and reveals their primary sector bets:
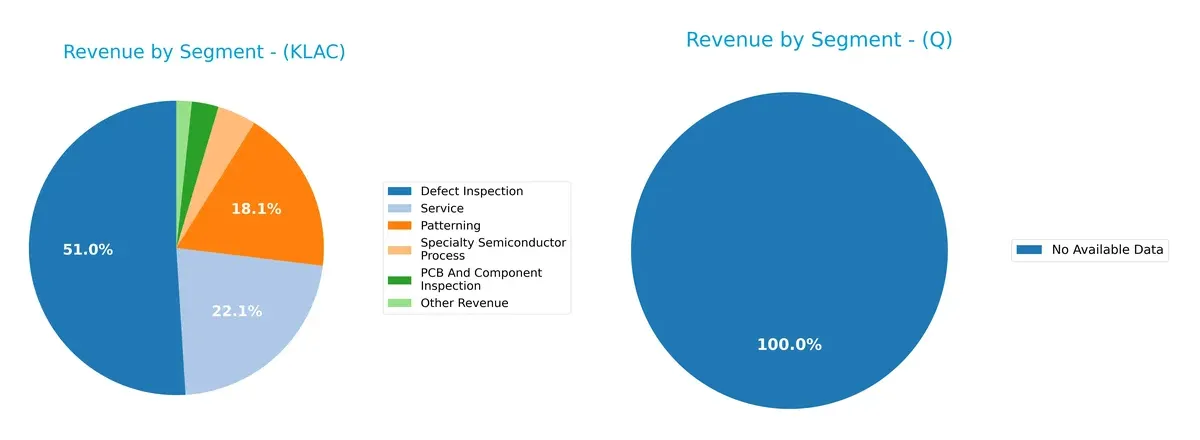
KLA Corporation shows a diversified revenue mix with significant contributions from Defect Inspection ($6.2B), Service ($2.7B), and Patterning ($2.2B). This spread anchors its ecosystem lock-in, reducing concentration risk. Qnity Electronics lacks available data, so I cannot assess its revenue segmentation or strategic positioning. KLA’s broad base supports infrastructure dominance in semiconductor process control, a clear competitive moat.
Strengths and Weaknesses Comparison
This table compares the strengths and weaknesses of KLA Corporation and Qnity Electronics, Inc.:
KLA Corporation Strengths
- High net margin at 33.41%
- ROE of 86.56% indicating strong profitability
- ROIC at 37.97% well above WACC
- Strong current and quick ratios indicating liquidity
- Diverse product segments spanning inspection and service
- Significant global presence with large revenues from China and Taiwan
Qnity Electronics, Inc. Strengths
- Favorable net margin at 15.99%
- Low debt-to-equity and debt-to-assets ratios indicating low leverage
- Favorable WACC at 5.78%
- Positive current and quick ratios supporting liquidity
- Neutral PB ratio suggests reasonable valuation
- Maintains some profitability despite smaller scale
KLA Corporation Weaknesses
- High WACC at 10.42%, raising capital costs
- Unfavorable PE and PB ratios may indicate overvaluation
- Debt-to-equity of 1.3 suggests higher leverage
- Dividend yield low at 0.76%
- Asset turnover moderate at 0.76
- Heavy reliance on defect inspection segment
Qnity Electronics, Inc. Weaknesses
- Low ROE at 6.51% reflects weak profitability
- ROIC near WACC at 5.92% limits value creation
- Unfavorable PE ratio at 28.8
- Lower asset turnover at 0.35 signals inefficient use of assets
- No dividend yield can deter income investors
- Limited product and geographic diversification
KLA shows strong profitability and global reach but carries valuation and leverage risks. Qnity presents a conservative financial structure but struggles with profitability and scale. These contrasts reflect differing strategic positions and operational efficiencies.
The Moat Duel: Analyzing Competitive Defensibility
A structural moat protects long-term profits from relentless competition erosion. Without it, sustainable value quickly disappears. Let’s dissect the moats of two semiconductor players:
KLA Corporation: Precision Process Control Moat
KLA dominates through switching costs and proprietary inspection technology. Its 27.5% ROIC above WACC confirms strong value creation and margin stability. New semiconductor markets in 2026 should deepen this moat.
Qnity Electronics, Inc.: Emerging Materials Innovation Moat
Qnity’s moat hinges on specialized electronic materials, less entrenched than KLA’s. Its near-zero ROIC premium signals weak value creation, but recent product launches could spark future market disruption.
Moat Strength Showdown: Precision Control vs. Materials Innovation
KLA’s moat is wider and deeper, backed by robust financials and a rising ROIC trend. Qnity remains a neutral player with an unproven moat. KLA is better equipped to defend and expand market share in 2026.
Which stock offers better returns?
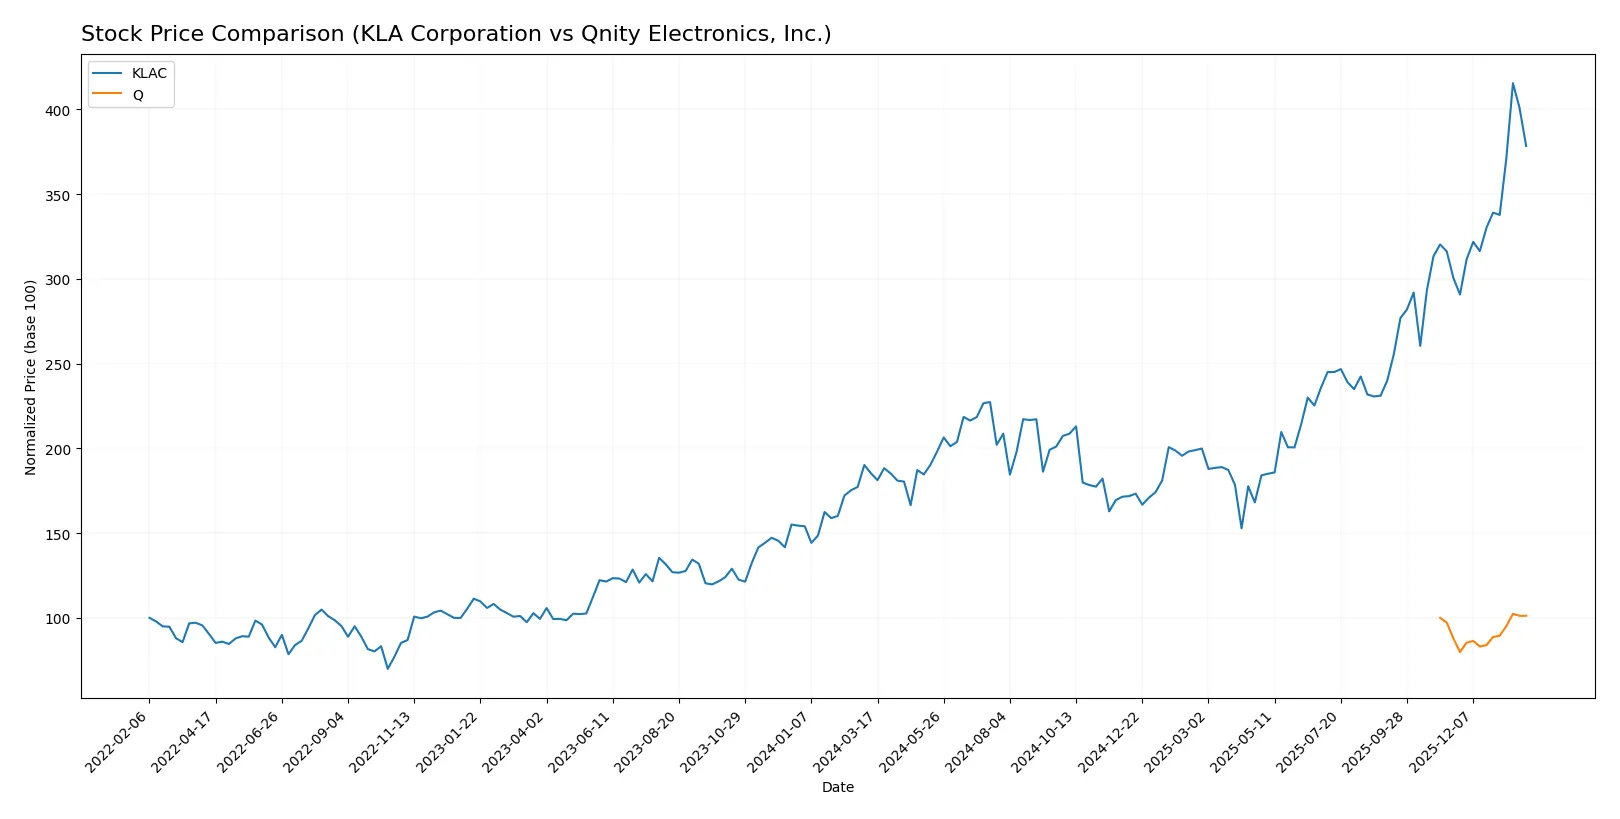
Over the past year, KLA Corporation’s stock price surged sharply, showing strong acceleration, while Qnity Electronics, Inc. displayed a modest upward move with steady gains.
Trend Comparison
KLA Corporation’s stock rose 104.22% over the past 12 months, indicating a bullish trend with accelerating momentum and high volatility. The price ranged from 577 to 1,568.
Qnity Electronics, Inc.’s stock increased 1.24% over the same period, showing a neutral trend despite acceleration signs and much lower volatility, with prices between 75.8 and 97.3.
KLA’s stock delivered the highest market performance with a strong double-digit gain, markedly outperforming Qnity’s modest price increase.
Target Prices
Analysts see upside potential in both KLA Corporation and Qnity Electronics, with target prices well above current levels.
| Company | Target Low | Target High | Consensus |
|---|---|---|---|
| KLA Corporation | 1400 | 1900 | 1672.25 |
| Qnity Electronics, Inc. | 92 | 118 | 106.78 |
The consensus target for KLA exceeds its current price of 1427.94 by roughly 17%, signaling moderate upside potential. Qnity’s consensus target stands about 11% above its current 96.18 price, reflecting cautious optimism among analysts.

Don’t Let Luck Decide Your Entry Point
Optimize your entry points with our advanced ProRealTime indicators. You’ll get efficient buy signals with precise price targets for maximum performance. Start outperforming now!
How do institutions grade them?
The following tables summarize recent institutional grades for KLA Corporation and Qnity Electronics, Inc.:
KLA Corporation Grades
This table presents the latest grades from major financial institutions for KLA Corporation.
| Grading Company | Action | New Grade | Date |
|---|---|---|---|
| Oppenheimer | Maintain | Outperform | 2026-01-30 |
| Barclays | Maintain | Overweight | 2026-01-30 |
| Cantor Fitzgerald | Maintain | Overweight | 2026-01-30 |
| Jefferies | Maintain | Buy | 2026-01-30 |
| Stifel | Maintain | Buy | 2026-01-30 |
| Wells Fargo | Maintain | Overweight | 2026-01-30 |
| Needham | Maintain | Buy | 2026-01-30 |
| RBC Capital | Maintain | Sector Perform | 2026-01-30 |
| Deutsche Bank | Maintain | Hold | 2026-01-21 |
| Needham | Maintain | Buy | 2026-01-20 |
Qnity Electronics, Inc. Grades
Here are the most recent institutional grades available for Qnity Electronics, Inc.
| Grading Company | Action | New Grade | Date |
|---|---|---|---|
| RBC Capital | Maintain | Outperform | 2025-11-25 |
| Mizuho | Maintain | Outperform | 2025-11-20 |
Which company has the best grades?
KLA Corporation exhibits predominantly positive grades ranging from Buy to Outperform, with a few Hold and Sector Perform ratings. Qnity Electronics holds consistent Outperform grades from two institutions. KLA’s broader coverage and higher-grade diversity suggest more nuanced analyst confidence, potentially impacting investor perception of stability and growth prospects.
Risks specific to each company
The following categories identify the critical pressure points and systemic threats facing both firms in the 2026 market environment:
1. Market & Competition
KLA Corporation
- Dominates semiconductor process control with strong market share but faces fierce innovation from peers.
Qnity Electronics, Inc.
- New entrant with limited market presence and high competition in advanced electronic materials.
2. Capital Structure & Debt
KLA Corporation
- High debt-to-equity ratio (1.3) signals leverage risk despite strong interest coverage (16.37x).
Qnity Electronics, Inc.
- Very low debt (D/E 0.02) minimizes financial risk but may limit capital for growth.
3. Stock Volatility
KLA Corporation
- Beta of 1.444 indicates above-market volatility, increasing risk in turbulent markets.
Qnity Electronics, Inc.
- Beta of 0 suggests minimal correlation with market swings, offering stability.
4. Regulatory & Legal
KLA Corporation
- Exposure to global semiconductor regulations and intellectual property disputes.
Qnity Electronics, Inc.
- Faces regulatory scrutiny as a recent IPO with evolving compliance requirements.
5. Supply Chain & Operations
KLA Corporation
- Complex global supply chains vulnerable to semiconductor cycle shocks and component shortages.
Qnity Electronics, Inc.
- Supply chain less mature; risks from scaling production and vendor reliability.
6. ESG & Climate Transition
KLA Corporation
- Increasing pressure to align with ESG standards amid semiconductor energy-intensive processes.
Qnity Electronics, Inc.
- ESG initiatives nascent; risks from regulatory shifts and investor demands.
7. Geopolitical Exposure
KLA Corporation
- Significant exposure to US-China tech tensions affecting supply and sales.
Qnity Electronics, Inc.
- Limited international footprint currently reduces geopolitical risks.
Which company shows a better risk-adjusted profile?
KLA Corporation’s most impactful risk is elevated financial leverage amid market volatility. Qnity Electronics faces significant market competition as a young player with limited scale. Despite KLA’s leverage, its robust profitability and operating scale provide a cushion. Qnity’s low debt and stable beta reduce financial risk but its unproven market position and operational infancy heighten uncertainty. Recent data showing KLA’s beta above 1.4 and high D/E ratio justify caution. Overall, KLA offers a better risk-adjusted profile due to scale and profitability, but investors must monitor leverage risks carefully.
Final Verdict: Which stock to choose?
KLA Corporation’s superpower lies in its durable competitive advantage, evident from a strong and growing ROIC well above its cost of capital. It excels in capital efficiency and profitability, driving robust cash flow generation. A point of vigilance is its elevated debt-to-equity ratio, which may pressure financial flexibility. It suits portfolios aiming for aggressive growth with a tolerance for leverage risks.
Qnity Electronics stands out for its conservative financial structure and low leverage, providing a safety cushion uncommon in its peer group. Its strategic moat is less pronounced, reflecting stable but modest returns. This company could appeal to investors prioritizing capital preservation and steady income, fitting well within a GARP (Growth at a Reasonable Price) approach.
If you prioritize high return on invested capital and are comfortable with leverage, KLA Corporation outshines as a compelling choice due to its proven value creation and growth trajectory. However, if you seek better financial stability and lower risk, Qnity Electronics offers superior balance sheet strength and steadier cash flow, albeit with less dynamic growth prospects.
Disclaimer: Investment carries a risk of loss of initial capital. The past performance is not a reliable indicator of future results. Be sure to understand risks before making an investment decision.
Go Further
I encourage you to read the complete analyses of KLA Corporation and Qnity Electronics, Inc. to enhance your investment decisions: