Home > Comparison > Technology > KLAC vs ONTO
The strategic rivalry between KLA Corporation and Onto Innovation Inc. shapes the semiconductor sector’s evolution. KLA operates as a capital-intensive giant, offering comprehensive process control and yield management solutions. Onto Innovation, smaller and specialized, focuses on niche metrology and inspection tools. This analysis pits scale and breadth against agility and innovation. I aim to identify which trajectory delivers superior risk-adjusted returns for a diversified technology portfolio.
Table of contents
Companies Overview
KLA Corporation and Onto Innovation Inc. shape critical segments of the semiconductor process control market.
KLA Corporation: Semiconductor Process Control Leader
KLA Corporation dominates semiconductor process control with integrated defect inspection and metrology solutions. It earns revenue mainly from wafer inspection, reticle defect metrology, and software for yield management. In 2026, KLA focused on expanding advanced process control capabilities and enhancing software-driven process corrections, reinforcing its leadership in semiconductor yield optimization.
Onto Innovation Inc.: Specialized Process Control Innovator
Onto Innovation Inc. specializes in macro defect inspection, optical metrology, and lithography tools for semiconductor and device packaging manufacturers. Its revenue stems from standalone systems and process control software for various advanced packaging and test applications. The company’s 2026 strategy emphasized integrating analytical software with hardware to boost yield management across device fabrication.
Strategic Collision: Similarities & Divergences
Both firms prioritize process control and yield management but diverge in scope and scale. KLA offers a comprehensive, integrated ecosystem, while Onto focuses on modular, specialized tools and software. Their primary battleground lies in wafer inspection and advanced packaging process control. KLA’s broad market dominance contrasts with Onto’s nimble innovation, framing distinct investment profiles in semiconductor equipment.
Income Statement Comparison
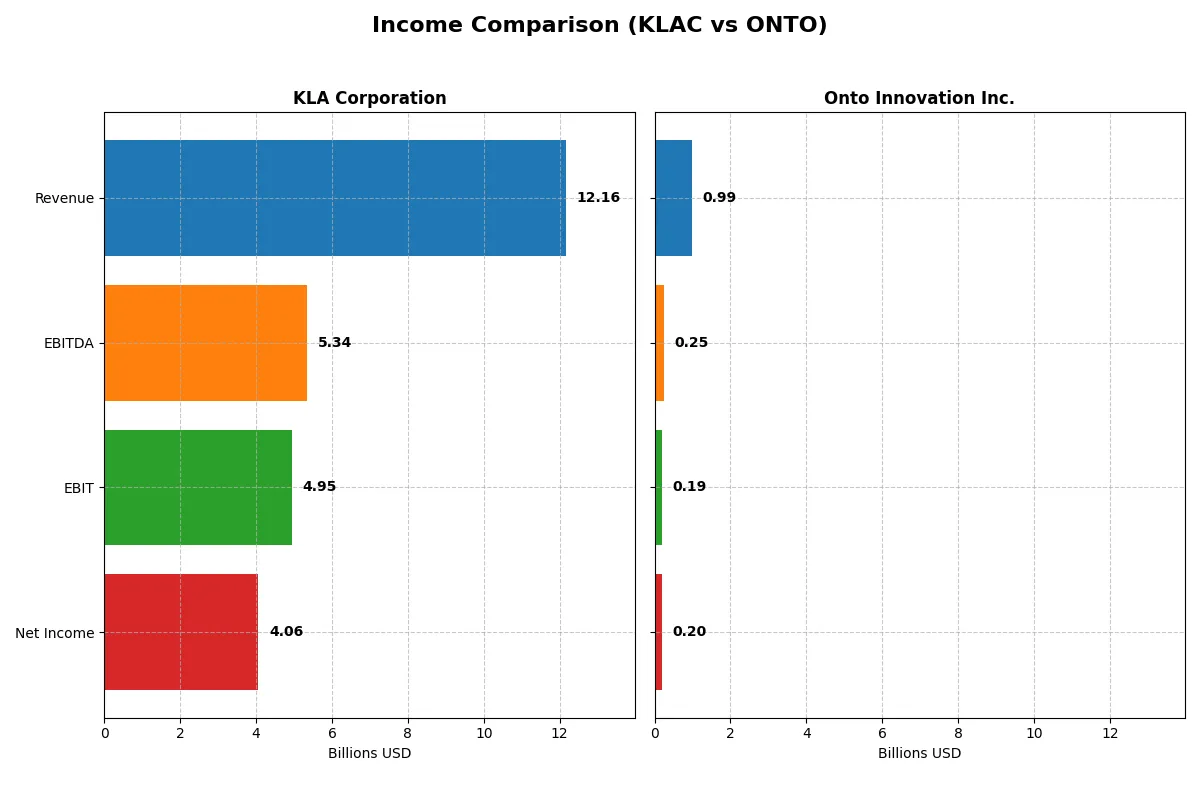
This data dissects the core profitability and scalability of both corporate engines to reveal who dominates the bottom line:
| Metric | KLA Corporation (KLAC) | Onto Innovation Inc. (ONTO) |
|---|---|---|
| Revenue | 12.2B | 987M |
| Cost of Revenue | 4.58B | 472M |
| Operating Expenses | 2.33B | 328M |
| Gross Profit | 7.58B | 515M |
| EBITDA | 5.34B | 249M |
| EBIT | 4.95B | 187M |
| Interest Expense | 302M | 0 |
| Net Income | 4.06B | 202M |
| EPS | 30.53 | 4.09 |
| Fiscal Year | 2025 | 2024 |
Income Statement Analysis: The Bottom-Line Duel
This income statement comparison exposes the true operational efficiency and profit-generating power of two semiconductor equipment firms.
KLA Corporation Analysis
KLA’s revenue surged 24% in 2025 to $12.2B, fueling a 33% net income margin and $4.1B bottom line. Its gross margin stands at a robust 62%, while net margin grew 11% over five years. The company reveals accelerating profitability and efficient cost control, with EBIT margin hitting a strong 41% in the latest year.
Onto Innovation Inc. Analysis
Onto Innovation posted $987M revenue in 2024, up 21% year-over-year, with net income rising 38% to $202M. The firm maintains a respectable gross margin of 52% and net margin of 20%, showing solid operational leverage. Its EBIT margin nearly doubled over one year to 19%, reflecting improved cost discipline and growing bottom-line momentum.
Margin Dominance vs. High Growth Momentum
KLA dominates in scale and margin quality, delivering superior profitability with a 33% net margin versus Onto’s 20%. Onto, however, outpaces KLA in net income growth (550% over five years) and EPS expansion, signaling rapid momentum. Investors seeking established margin strength may favor KLA, while growth-focused profiles may find Onto’s accelerating profit gains compelling.
Financial Ratios Comparison
These vital ratios act as a diagnostic tool to expose the underlying fiscal health, valuation premiums, and capital efficiency of the companies compared below:
| Ratios | KLA Corporation (KLAC) | Onto Innovation Inc. (ONTO) |
|---|---|---|
| ROE | 86.6% | 10.5% |
| ROIC | 38.0% | 8.8% |
| P/E | 29.3 | 41.8 |
| P/B | 25.4 | 4.37 |
| Current Ratio | 2.62 | 8.69 |
| Quick Ratio | 1.83 | 7.00 |
| D/E (Debt-to-Equity) | 1.30 | 0.008 |
| Debt-to-Assets | 37.9% | 0.72% |
| Interest Coverage | 17.3 | 0 |
| Asset Turnover | 0.76 | 0.47 |
| Fixed Asset Turnover | 9.70 | 7.16 |
| Payout Ratio | 22.3% | 0% |
| Dividend Yield | 0.76% | 0% |
| Fiscal Year | 2025 | 2024 |
Efficiency & Valuation Duel: The Vital Signs
Financial ratios serve as a company’s DNA, unveiling hidden risks and signaling operational strength or weakness.
KLA Corporation
KLA delivers exceptional profitability with an 86.6% ROE and a 33.4% net margin, showcasing operational excellence. However, its valuation appears stretched, with a P/E of 29.3 and a P/B of 25.4, indicating premium pricing. Dividend yield is modest at 0.76%, reflecting limited shareholder payouts amid strong reinvestment in R&D.
Onto Innovation Inc.
Onto Innovation posts a modest 10.5% ROE and a 20.4% net margin, indicating moderate efficiency. The stock is expensive with a high P/E of 41.8 and a lower P/B of 4.4, reflecting growth expectations. It pays no dividends, focusing instead on capital allocation towards growth and R&D, consistent with its evolving business model.
Premium Valuation vs. Operational Safety
KLA offers superior profitability and operational efficiency despite a premium valuation, while Onto Innovation trades at a higher P/E but with weaker returns. Investors seeking operational safety might favor KLA’s dominant margins; growth-focused profiles may tolerate Onto’s valuation stretch.
Which one offers the Superior Shareholder Reward?
I observe that KLA Corporation delivers a balanced distribution approach with a 0.76% dividend yield supported by a sustainable 22% payout ratio and robust buybacks. Onto Innovation forgoes dividends, reinvesting heavily in growth, but its free cash flow yield remains modest. KLA’s mix of dividends and buybacks offers a more reliable total return in 2026.
Comparative Score Analysis: The Strategic Profile
The radar chart reveals the fundamental DNA and trade-offs of KLA Corporation and Onto Innovation Inc., highlighting their financial strengths and valuation nuances:
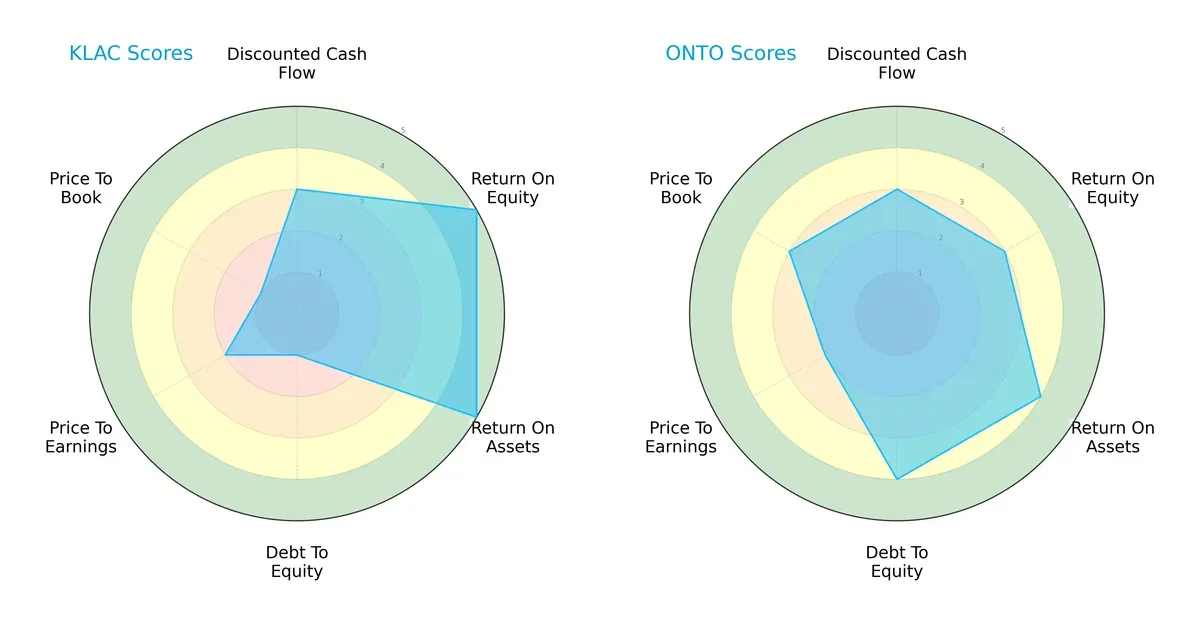
KLA leads with superior ROE and ROA scores, demonstrating exceptional profitability and asset efficiency. Onto Innovation shows a stronger balance sheet with a favorable debt-to-equity score but lags in return metrics. KLA’s profile is less balanced due to heavy leverage and weaker valuation scores, while Onto presents a more moderate, risk-conscious stance.
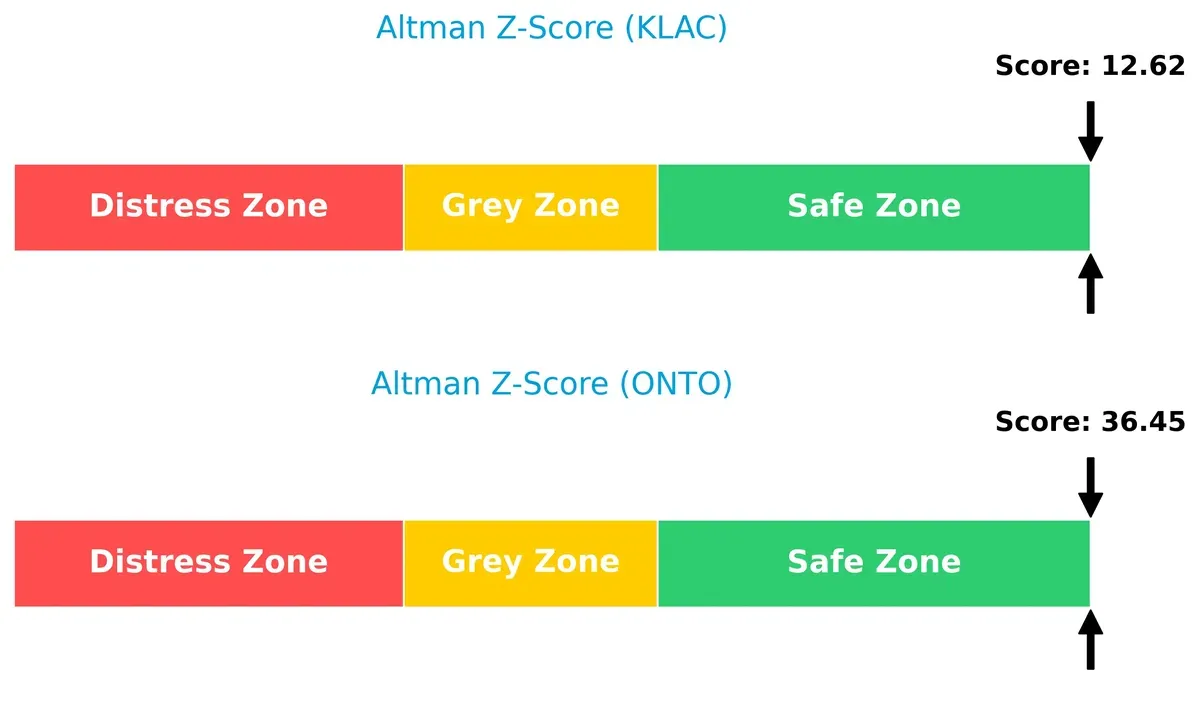
Bankruptcy Risk: Solvency Showdown
The Altman Z-Score gap signals both firms sit comfortably in the safe zone, with Onto Innovation’s score significantly higher, implying greater resilience in adverse cycles:
Financial Health: Quality of Operations
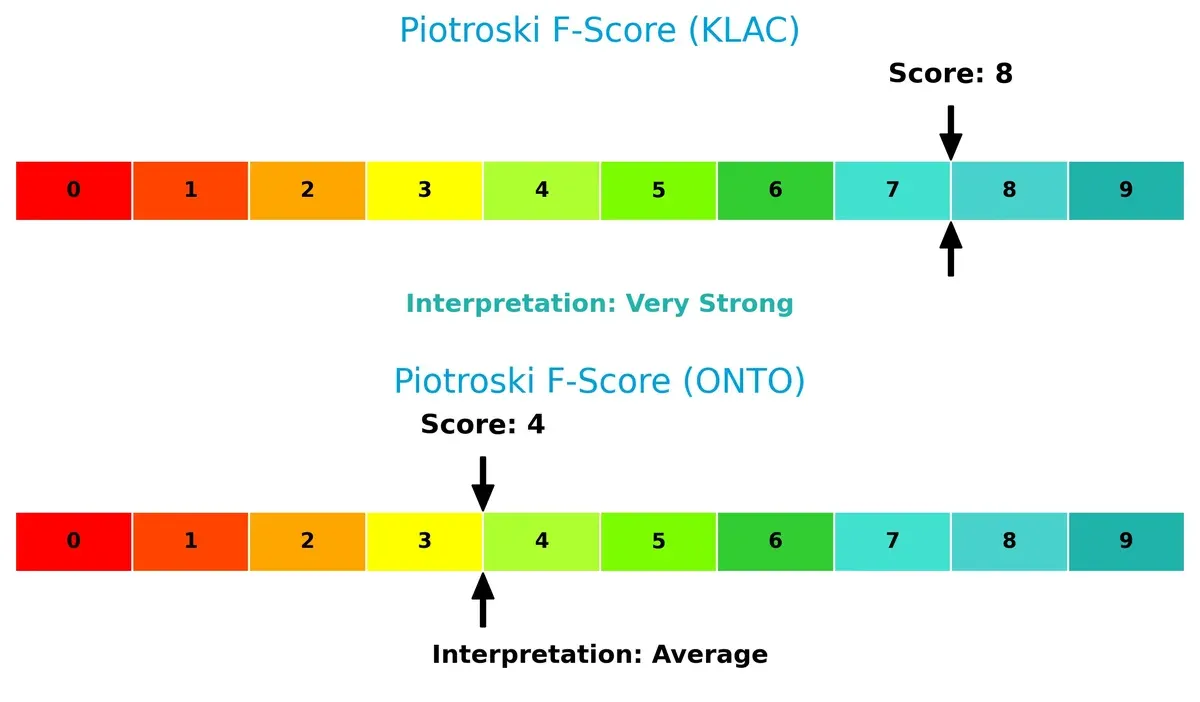
KLA’s Piotroski F-Score of 8 reflects robust financial health and operational strength. Onto’s moderate score of 4 raises caution about underlying internal risks relative to its peer:
How are the two companies positioned?
This section dissects the operational DNA of KLAC and ONTO by comparing their revenue distribution and internal dynamics. The goal is to confront their economic moats to identify which model offers the most resilient competitive advantage today.
Revenue Segmentation: The Strategic Mix
This visual comparison dissects how KLA Corporation and Onto Innovation Inc. diversify their income streams and where their primary sector bets lie:
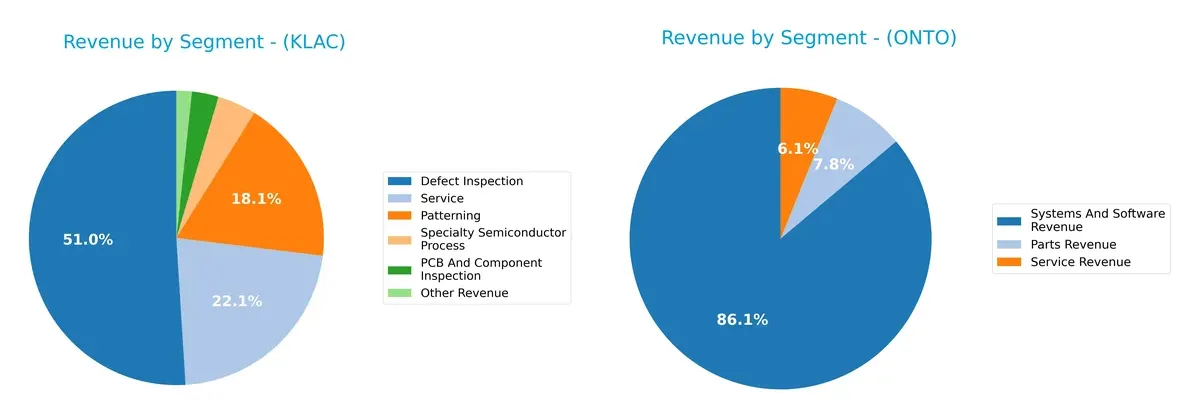
KLA leans heavily on Defect Inspection, which dwarfs all other segments at $6.2B, anchoring its revenue. Onto Innovation pivots around Systems and Software Revenue at $850M, while Parts and Service revenues remain modest. KLA’s focused dominance suggests strong ecosystem lock-in and infrastructure control but introduces concentration risk. Onto’s more balanced mix indicates diversification, potentially cushioning it against sector-specific downturns.
Strengths and Weaknesses Comparison
This table compares the strengths and weaknesses of KLA Corporation and Onto Innovation Inc.:
KLA Corporation Strengths
- High net margin at 33.41%
- Strong ROE at 86.56%
- ROIC well above WACC at 37.97%
- Robust current and quick ratios
- Significant fixed asset turnover
- Diverse revenue streams across multiple semiconductor segments
Onto Innovation Inc. Strengths
- Favorable net margin at 20.43%
- Low debt-to-equity ratio at 0.01
- Strong debt-to-assets at 0.72%
- Infinite interest coverage ratio
- Favorable quick ratio
- Solid fixed asset turnover
KLA Corporation Weaknesses
- WACC higher than ROIC at 10.42%
- Unfavorable high PE and PB ratios
- Elevated debt-to-equity at 1.3
- Dividend yield low at 0.76%
- Moderate asset turnover at 0.76
- Some unfavorable valuation metrics
Onto Innovation Inc. Weaknesses
- WACC above ROIC at 10.68%
- High PE and PB ratios
- Unfavorable current ratio at 8.69
- Lower ROE and ROIC (neutral)
- Subpar asset turnover at 0.47
- Zero dividend yield
KLA shows superior profitability and efficient capital use but carries valuation and leverage concerns. Onto exhibits conservative leverage and strong coverage but faces challenges in asset efficiency and valuation. Each company’s financial profile points to distinct strategic priorities.
The Moat Duel: Analyzing Competitive Defensibility
A structural moat is the only thing protecting long-term profits from competitive erosion in a dynamic industry like semiconductors:
KLA Corporation: Dominant Process Control Moat
KLA’s moat stems from intangible assets and switching costs embedded in its advanced yield management tools. Its 27.5% ROIC above WACC and 40.7% EBIT margin prove margin stability. Expanding wafer inspection in Asia deepens this moat through 2026.
Onto Innovation Inc.: Emerging Metrology Contender
Onto relies on specialized process control software and niche packaging lithography. Unlike KLA, it currently sheds value with ROIC below WACC but shows rapid ROIC growth. Its 61% EBIT growth hints at potential to disrupt through innovation and market penetration.
The Moat Battle: Established Process Control vs. Rising Innovation
KLA possesses a wider, durable moat with strong value creation and global scale. Onto’s improving metrics signal promise, but it remains less equipped to defend market share against entrenched leaders like KLA.
Which stock offers better returns?
Over the past year, KLA Corporation and Onto Innovation Inc. showed strong price movements with notable acceleration in their stock trends, reflecting dynamic trading activity and evolving investor sentiment.
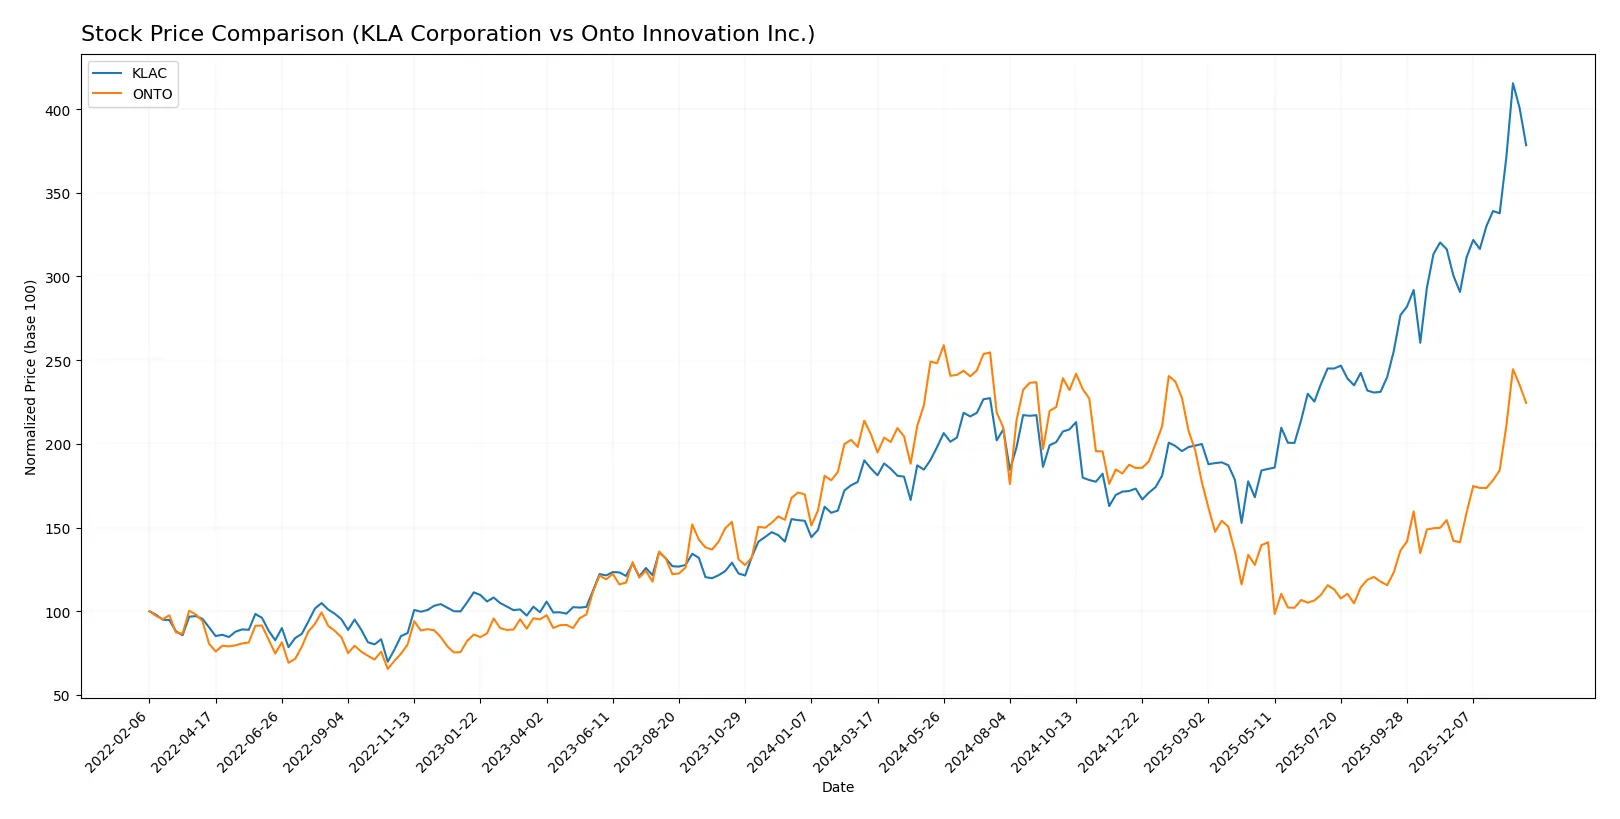
Trend Comparison
KLA Corporation’s stock price surged 104.22% over the past 12 months, exhibiting a bullish trend with accelerating momentum and a high volatility level indicated by a 213.25 std deviation.
Onto Innovation Inc. posted a 9.1% price increase over the same period, also bullish with accelerating gains but lower volatility, reflected in a 42.99 std deviation compared to KLA.
KLA Corporation delivered the highest market performance with a significantly larger price gain and stronger trend acceleration compared to Onto Innovation Inc.
Target Prices
Analysts present a cautiously optimistic consensus for both KLA Corporation and Onto Innovation Inc.
| Company | Target Low | Target High | Consensus |
|---|---|---|---|
| KLA Corporation | 1400 | 1900 | 1672.25 |
| Onto Innovation Inc. | 160 | 260 | 191.67 |
KLA’s consensus target of 1672.25 exceeds its current 1427.94 price, signaling expected upside. Onto Innovation’s target consensus of 191.67 sits slightly below its current 202.05 price, indicating moderate downside risk.

Don’t Let Luck Decide Your Entry Point
Optimize your entry points with our advanced ProRealTime indicators. You’ll get efficient buy signals with precise price targets for maximum performance. Start outperforming now!
How do institutions grade them?
This section compares institutional grades for KLA Corporation and Onto Innovation Inc.:
KLA Corporation Grades
Below is a summary of recent grades assigned to KLA Corporation by major institutions.
| Grading Company | Action | New Grade | Date |
|---|---|---|---|
| Oppenheimer | Maintain | Outperform | 2026-01-30 |
| Barclays | Maintain | Overweight | 2026-01-30 |
| Cantor Fitzgerald | Maintain | Overweight | 2026-01-30 |
| Jefferies | Maintain | Buy | 2026-01-30 |
| Stifel | Maintain | Buy | 2026-01-30 |
| Wells Fargo | Maintain | Overweight | 2026-01-30 |
| Needham | Maintain | Buy | 2026-01-30 |
| RBC Capital | Maintain | Sector Perform | 2026-01-30 |
| Deutsche Bank | Maintain | Hold | 2026-01-21 |
| Needham | Maintain | Buy | 2026-01-20 |
Onto Innovation Inc. Grades
This table summarizes recent grades assigned to Onto Innovation Inc. by reputable institutions.
| Grading Company | Action | New Grade | Date |
|---|---|---|---|
| Needham | Maintain | Buy | 2026-01-20 |
| B. Riley Securities | Maintain | Buy | 2026-01-15 |
| Stifel | Maintain | Hold | 2026-01-14 |
| Needham | Maintain | Buy | 2026-01-06 |
| Jefferies | Maintain | Buy | 2025-12-15 |
| Needham | Maintain | Buy | 2025-11-18 |
| B. Riley Securities | Maintain | Buy | 2025-11-18 |
| Evercore ISI Group | Maintain | Outperform | 2025-11-05 |
| Oppenheimer | Maintain | Outperform | 2025-10-14 |
| Stifel | Maintain | Hold | 2025-10-13 |
Which company has the best grades?
KLA Corporation has a broader consensus of buy and outperform ratings across recent dates. Onto Innovation also holds multiple buy and outperform grades but features more hold ratings. Investors might perceive KLA’s consistent positive grades as stronger institutional confidence.
Risks specific to each company
The following categories identify the critical pressure points and systemic threats facing both firms in the 2026 market environment:
1. Market & Competition
KLA Corporation
- Dominates semiconductor process control with strong market cap and scale advantage. Faces pressure from rapid innovation cycles.
Onto Innovation Inc.
- Smaller scale limits competitive reach. Faces intense competition in niche semiconductor metrology markets.
2. Capital Structure & Debt
KLA Corporation
- High debt-to-equity ratio (1.3) is a red flag, increasing financial risk despite strong coverage ratios.
Onto Innovation Inc.
- Extremely low debt (0.01 D/E) signals conservative capital structure and financial stability.
3. Stock Volatility
KLA Corporation
- Beta at 1.444 suggests notable sensitivity to market swings, reflecting sector cyclicality.
Onto Innovation Inc.
- Beta slightly higher at 1.461, indicating similar volatility risk relative to market.
4. Regulatory & Legal
KLA Corporation
- Subject to stringent global semiconductor regulations; potential exposure to export controls.
Onto Innovation Inc.
- Also exposed to semiconductor regulations but smaller footprint may limit regulatory complexity.
5. Supply Chain & Operations
KLA Corporation
- Large, complex supply chain is vulnerable to global disruptions affecting semiconductor production.
Onto Innovation Inc.
- Smaller operation may absorb shocks better but lacks scale to mitigate supply chain risks.
6. ESG & Climate Transition
KLA Corporation
- Industry pressure to reduce carbon footprint; advanced manufacturing processes may increase energy use.
Onto Innovation Inc.
- ESG efforts less documented; potential risk if lagging peers in sustainability commitments.
7. Geopolitical Exposure
KLA Corporation
- Significant exposure to US-China tensions impacting semiconductor supply chains and sales.
Onto Innovation Inc.
- Similar geopolitical risks but smaller global footprint may reduce overall impact.
Which company shows a better risk-adjusted profile?
KLA’s biggest risk lies in its leveraged capital structure, which could amplify downturns despite strong profitability. Onto’s primary risk is weaker market position, limiting scale advantages. Onto’s conservative debt and stable balance sheet offer a better risk-adjusted profile. Notably, KLA’s 37.9% debt-to-assets ratio sharply contrasts with Onto’s 0.7%, underscoring divergent financial risk levels.
Final Verdict: Which stock to choose?
KLA Corporation’s superpower lies in its robust capital efficiency and durable competitive advantage. It consistently delivers high returns well above its cost of capital, signaling strong value creation. A point of vigilance is its elevated leverage, which could amplify risks in volatile markets. KLA fits well in aggressive growth portfolios seeking quality and scale.
Onto Innovation Inc. boasts a strategic moat through its pristine balance sheet and negligible debt, offering a safer harbor amid uncertainty. Its rapid profitability growth hints at an emerging competitive position, though it currently sheds value relative to its cost of capital. Onto suits GARP investors who value steady improvement with lower financial risk.
If you prioritize capital efficiency and proven economic moats, KLA outshines as the compelling choice due to its strong value creation and market leadership. However, if you seek a less leveraged profile with accelerating profitability growth, Onto offers better stability and an attractive risk-reward balance. Both present distinct analytical scenarios for different investor appetites.
Disclaimer: Investment carries a risk of loss of initial capital. The past performance is not a reliable indicator of future results. Be sure to understand risks before making an investment decision.
Go Further
I encourage you to read the complete analyses of KLA Corporation and Onto Innovation Inc. to enhance your investment decisions: