Home > Comparison > Technology > KLAC vs ON
The strategic rivalry between KLA Corporation and ON Semiconductor Corporation shapes the semiconductor sector’s evolution. KLA leads as a capital-intensive process control and yield management specialist. ON Semiconductor focuses on high-volume intelligent sensing and power solutions, driving electrification trends. This contrast sets a compelling growth-versus-value dynamic. This analysis aims to identify which company’s trajectory offers superior risk-adjusted returns for a diversified portfolio in the fast-evolving technology landscape.
Table of contents
Companies Overview
KLA Corporation and ON Semiconductor shape critical niches in the semiconductor industry, driving innovation and industrial growth globally.
KLA Corporation: Precision Yield Management Leader
KLA dominates the semiconductor process control market. Its core revenue comes from advanced inspection and metrology tools that enhance chip manufacturing yields. In 2026, the company focuses on expanding integrated circuit process control solutions, reinforcing its technological edge in wafer inspection and defect analysis.
ON Semiconductor Corporation: Intelligent Power Innovator
ON Semiconductor excels in intelligent sensing and power solutions. It generates revenue by supplying analog and mixed-signal semiconductors for electric vehicles and sustainable energy markets. The 2026 strategy emphasizes electrification technologies, including power management systems that support automotive electrification and renewable energy infrastructure.
Strategic Collision: Similarities & Divergences
Both companies serve semiconductor markets but contrast in approach: KLA offers a closed ecosystem of inspection tools, while ON Semiconductor promotes an open infrastructure of power and sensing components. Their primary battleground lies in automotive and industrial semiconductor applications. KLA appeals to precision-driven manufacturing investors; ON targets growth through electrification and sustainability trends.
Income Statement Comparison
This data dissects the core profitability and scalability of both corporate engines to reveal who dominates the bottom line:
| Metric | KLA Corporation (KLAC) | ON Semiconductor Corporation (ON) |
|---|---|---|
| Revenue | 12.2B | 7.1B |
| Cost of Revenue | 4.6B | 3.9B |
| Operating Expenses | 2.3B | 1.4B |
| Gross Profit | 7.6B | 3.2B |
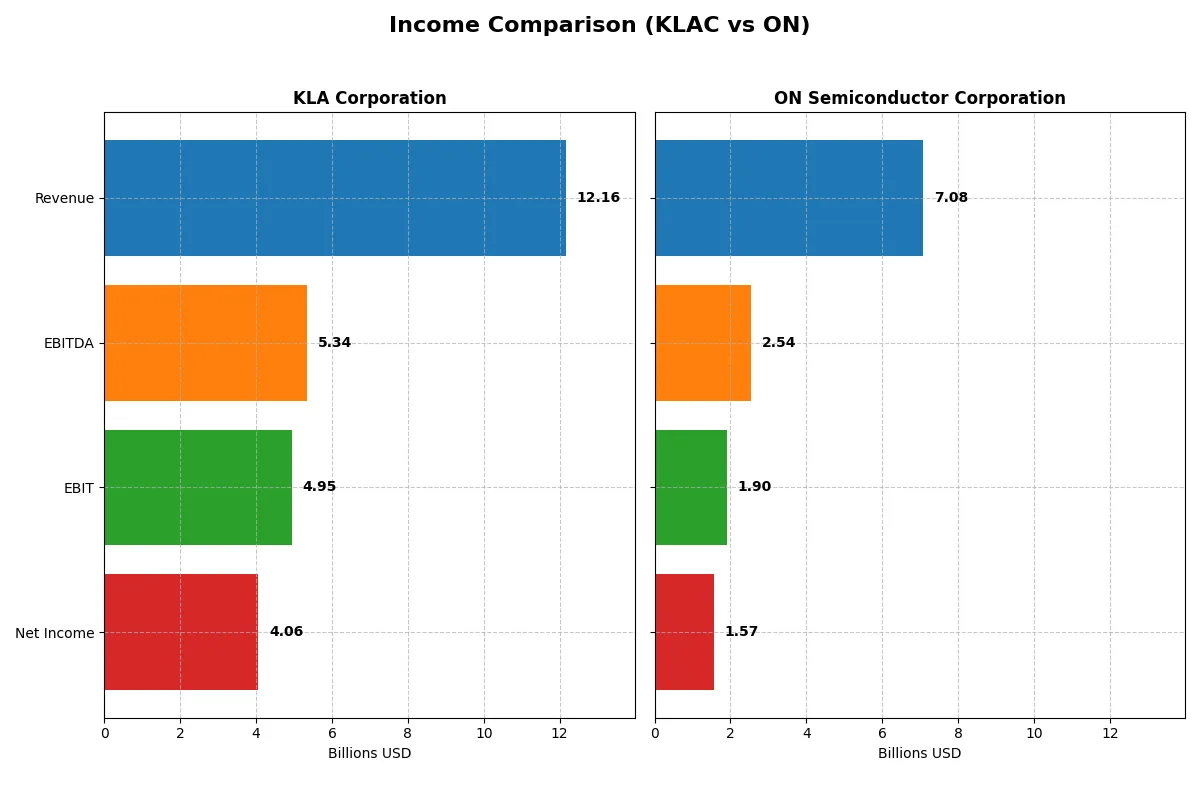
| EBITDA | 5.3B | 2.5B |
| EBIT | 4.9B | 1.9B |
| Interest Expense | 302M | 62M |
| Net Income | 4.1B | 1.6B |
| EPS | 30.53 | 3.68 |
| Fiscal Year | 2025 | 2024 |
Income Statement Analysis: The Bottom-Line Duel
This income statement comparison unveils which company runs the more efficient and profitable corporate engine through recent financial performance.
KLA Corporation Analysis
KLA’s revenue surged 24% in 2025 to $12.2B, driving net income up 47% to $4.1B. Its gross margin stands strong at 62%, and net margin at 33%, reflecting robust profitability. The latest year highlights exceptional operating leverage, with EBIT soaring 41% and EPS nearly 50% higher, signaling accelerating momentum and tight cost control.
ON Semiconductor Corporation Analysis
ON’s revenue declined 14% in 2024 to $7.1B, dragging net income down 28% to $1.57B. Despite lower top-line, its gross margin holds at a respectable 45%, with a net margin of 22%. However, the latest year reveals margin compression and reduced operating profits, indicating efficiency challenges amid a shrinking revenue base and rising expenses.
Margin Dominance vs. Revenue Resilience
KLA outpaces ON clearly on revenue growth and margin strength, with a 33% net margin nearly 1.5x ON’s 22%. KLA’s earnings and EPS growth demonstrate superior capital allocation and scalability. For investors prioritizing consistent profitability and operational efficiency, KLA’s profile is more compelling despite ON’s long-term income growth.
Financial Ratios Comparison
These vital ratios act as a diagnostic tool to expose the underlying fiscal health, valuation premiums, and capital efficiency of each company:
| Ratios | KLA Corporation (KLAC) | ON Semiconductor Corporation (ON) |
|---|---|---|
| ROE | 86.6% | 17.9% |
| ROIC | 38.0% | 11.9% |
| P/E | 29.3 | 17.1 |
| P/B | 25.4 | 3.06 |
| Current Ratio | 2.62 | 5.06 |
| Quick Ratio | 1.83 | 3.38 |
| D/E | 1.30 | 0.38 |
| Debt-to-Assets | 37.9% | 23.9% |
| Interest Coverage | 17.3 | 28.4 |
| Asset Turnover | 0.76 | 0.50 |
| Fixed Asset Turnover | 9.70 | 1.61 |
| Payout ratio | 22.3% | 0% |
| Dividend yield | 0.76% | 0% |
| Fiscal Year | 2025 | 2024 |
Efficiency & Valuation Duel: The Vital Signs
Financial ratios act as a company’s DNA, exposing hidden risks and operational strengths vital for investment decisions.
KLA Corporation
KLA shows exceptional profitability with an 86.56% ROE and a robust 33.41% net margin, signaling operational dominance. Its valuation appears stretched, trading at a P/E of 29.34 and a high P/B of 25.39. Shareholders receive a modest 0.76% dividend yield, reflecting a cautious capital return alongside significant R&D reinvestment.
ON Semiconductor Corporation
ON Semiconductor delivers solid profitability with a 17.88% ROE and a 22.21% net margin, indicating efficient operations but less dominance than KLA. The stock trades at a reasonable P/E of 17.13, suggesting fair valuation. It offers no dividend, instead allocating capital to growth and innovation, supported by a strong interest coverage ratio.
Premium Valuation vs. Operational Safety
KLA commands a premium valuation backed by superior profitability, while ON trades more conservatively with balanced financial health. Investors seeking high operational efficiency may favor KLA. Those prioritizing valuation discipline and growth potential without dividend income may find ON’s profile more fitting.
Which one offers the Superior Shareholder Reward?
KLA Corporation delivers a disciplined distribution strategy with a 0.76% yield and a conservative 22% payout ratio, supported by robust free cash flow coverage near 92%. KLA’s aggressive buyback program amplifies total returns. ON Semiconductor pays no dividends but reinvests heavily in growth, showing a modest free cash flow conversion of 64% and moderate buybacks. Historically, I’ve seen dividend payments paired with strong buybacks create more predictable shareholder value. KLA’s balanced yield and buybacks offer a more sustainable and attractive total return profile for 2026 investors.
Comparative Score Analysis: The Strategic Profile
The radar chart reveals the fundamental DNA and trade-offs of KLA Corporation and ON Semiconductor Corporation, highlighting their core financial strengths and weaknesses:
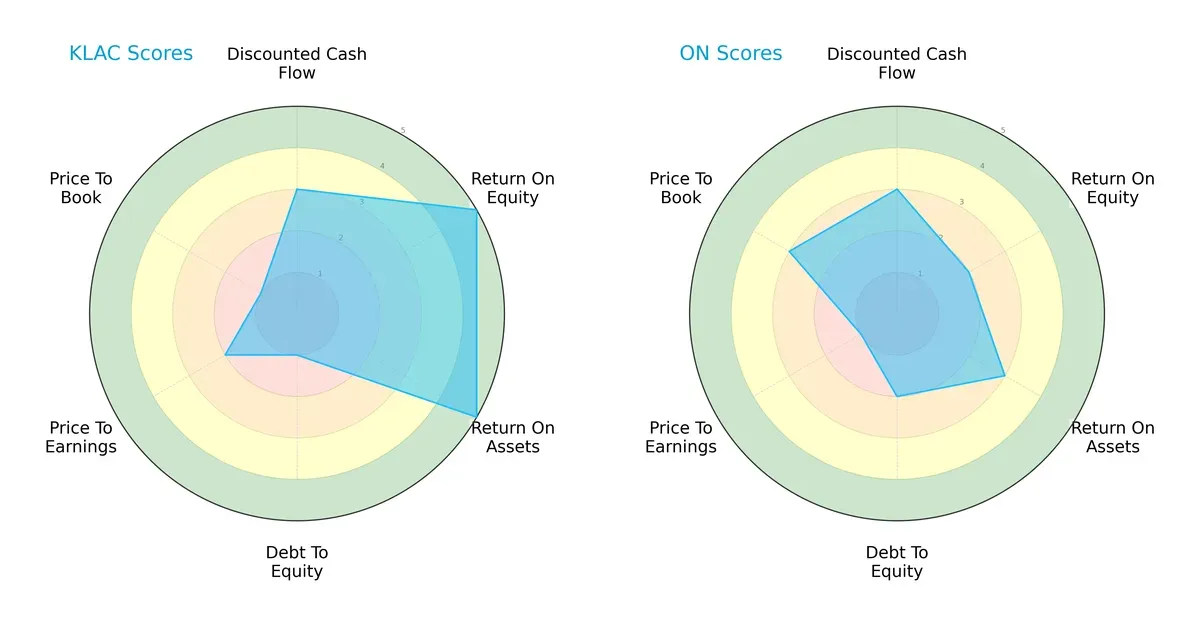
KLA displays a more balanced profile with strong ROE and ROA scores (5 each), signaling efficient profit generation and asset utilization. However, its debt-to-equity and price-to-book scores are very unfavorable, indicating higher leverage risk and potential overvaluation. ON Semiconductor relies on moderate scores across the board, with better debt management but weaker profitability and valuation metrics. KLA’s edge lies in operational efficiency, while ON’s strength is financial prudence.
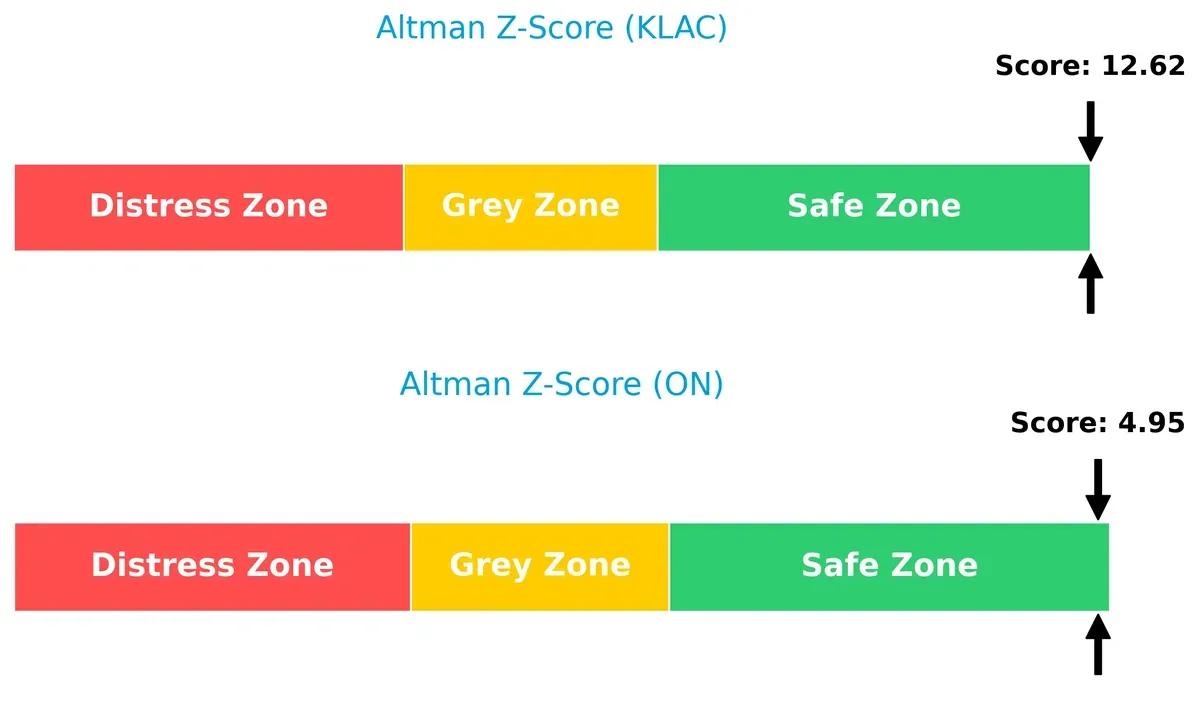
Bankruptcy Risk: Solvency Showdown
KLA’s Altman Z-Score of 12.6 vastly exceeds ON’s 4.9, placing both in the safe zone but underscoring KLA’s superior financial resilience and lower bankruptcy risk in this cycle:
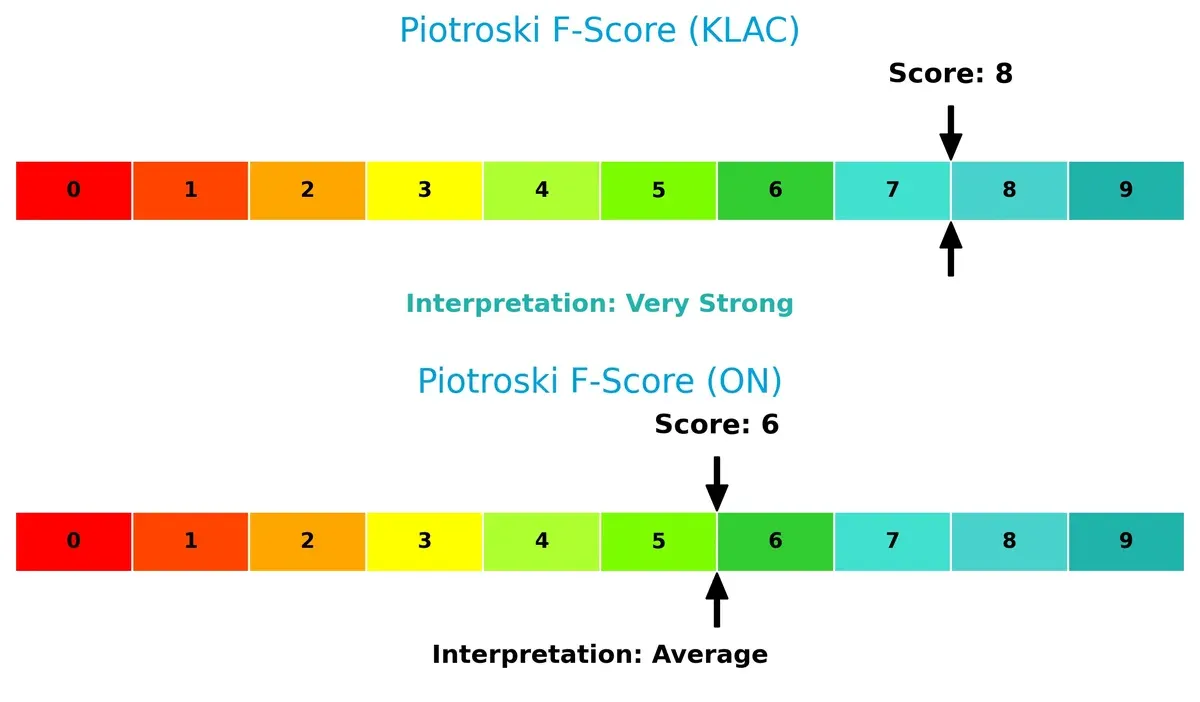
Financial Health: Quality of Operations
KLA’s Piotroski F-Score of 8 signals very strong financial health, outperforming ON’s 6, which only reflects average strength. This suggests KLA maintains superior internal operations and fewer red flags:
How are the two companies positioned?
This section dissects KLAC and ON’s operational DNA by comparing their revenue distribution and internal dynamics. The goal is to confront their economic moats, revealing which model offers the most resilient and sustainable competitive edge today.
Revenue Segmentation: The Strategic Mix
This visual comparison dissects how KLA Corporation and ON Semiconductor diversify their income streams and reveals their primary sector bets:
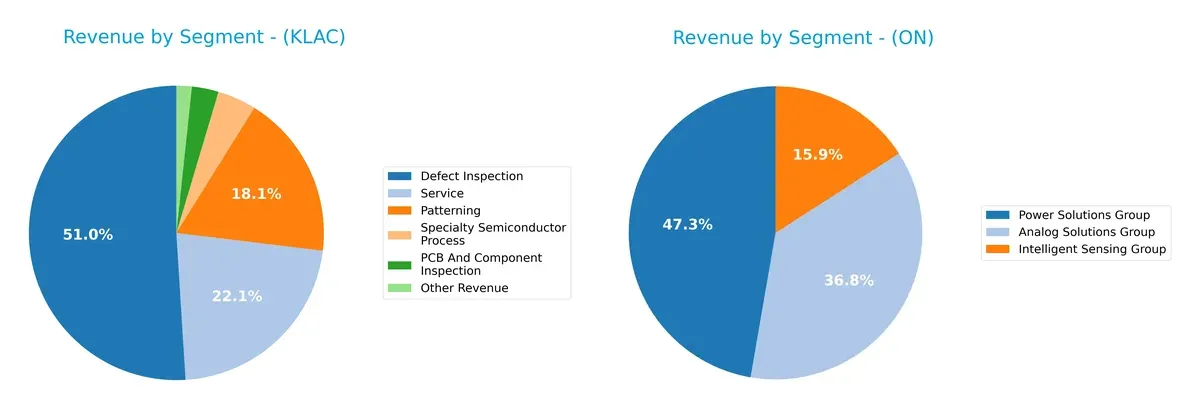
KLA anchors its revenue in Defect Inspection at $6.2B, dwarfing other segments like Service ($2.7B) and Patterning ($2.2B). This concentration signals a deep moat in semiconductor process control. ON Semiconductor shows a more balanced mix, with Power Solutions Group leading at $3.3B, followed closely by Analog ($2.6B) and Intelligent Sensing ($1.1B). ON’s diversified portfolio reduces concentration risk while leveraging broad semiconductor market exposure.
Strengths and Weaknesses Comparison
This table compares the Strengths and Weaknesses of KLA Corporation and ON Semiconductor Corporation:
KLA Corporation Strengths
- High net margin at 33.41%
- Strong ROE of 86.56%
- Favorable ROIC at 37.97%
- Solid current and quick ratios
- Diverse product segments including Defect Inspection and Patterning
- Significant revenue from China and Taiwan
ON Semiconductor Corporation Strengths
- Favorable net margin at 22.21%
- Positive ROE of 17.88% and ROIC of 11.88%
- Low debt-to-equity ratio at 0.38
- High interest coverage at 30.49
- Broad product range including Power Solutions and Analog Solutions
- Diverse geographic sales across Hong Kong, Singapore, UK, and US
KLA Corporation Weaknesses
- Unfavorable WACC at 10.42% exceeding ROIC
- High PE (29.34) and PB (25.39) ratios
- Debt-to-equity ratio of 1.3 indicates leverage risk
- Dividend yield is low at 0.76%
- Neutral asset turnover at 0.76
- Geographic revenue concentration in China and Taiwan
ON Semiconductor Corporation Weaknesses
- WACC at 10.18% remains a concern
- Price-to-book ratio unfavorable at 3.06
- Current ratio unfavorable at 5.06, possibly inefficient asset use
- No dividend yield
- Neutral asset and fixed asset turnover
- Geographic exposure concentrated in Asia and US markets
Both companies maintain slightly favorable financial health with solid profitability and product diversity. KLA shows strength in high returns but carries leverage and valuation risks. ON Semiconductor benefits from lower leverage and diversified markets but faces challenges in asset efficiency and dividend absence. These factors should inform their strategic financial management.
The Moat Duel: Analyzing Competitive Defensibility
A structural moat shields long-term profits from the relentless erosion of competition. Let’s dissect the competitive advantages of these two semiconductor players:
KLA Corporation: Precision Process Control Moat
KLA’s moat stems from its specialized process control technology, creating high switching costs for clients. This advantage shows in a robust 40.7% EBIT margin and consistent revenue growth of 23.9% in 2025. Its expansion into advanced inspection systems deepens this moat amid rising semiconductor complexity.
ON Semiconductor Corporation: Power Solutions and Sensing Moat
ON’s moat relies on cost advantages in power and sensing solutions, contrasting KLA’s niche precision focus. Despite a weaker 26.8% EBIT margin and recent revenue declines, ON’s expanding presence in electric vehicle and sustainable energy markets signals potential moat strengthening through industry tailwinds.
Verdict: Process Control Precision vs. Power Efficiency
KLA’s wider moat, evidenced by a 27.5% ROIC premium over WACC and stable margin growth, outmatches ON’s modest 1.7% premium despite improving profitability. KLA stands better equipped to defend and grow its market share through differentiated technology and high switching costs.
Which stock offers better returns?
The past year showed starkly contrasting price movements for KLA Corporation and ON Semiconductor Corporation, with KLA accelerating sharply upward while ON faced overall declines despite recent gains.
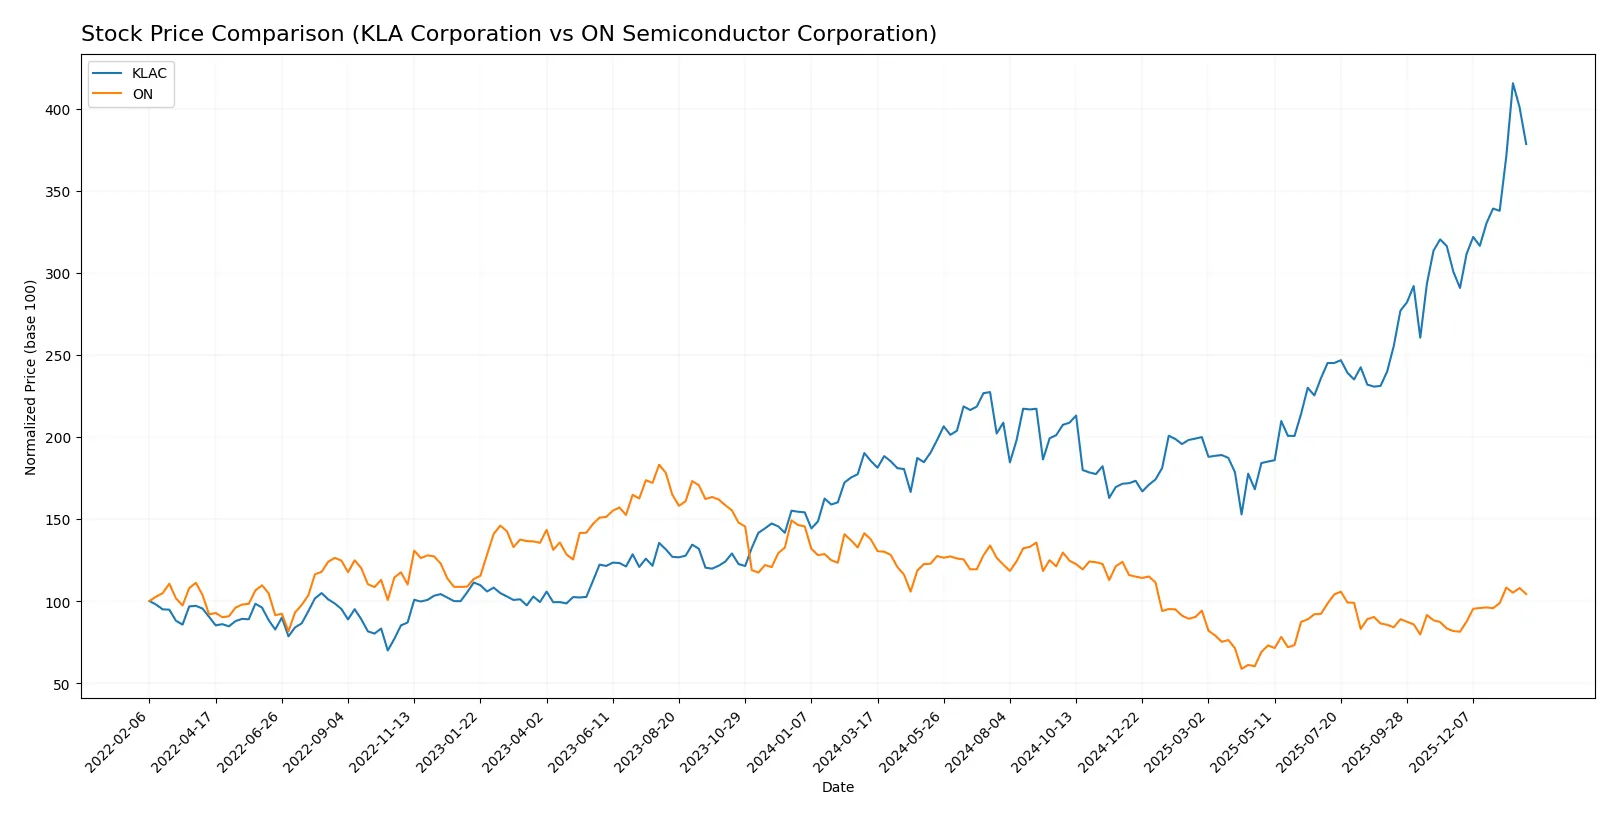
Trend Comparison
KLA Corporation’s stock surged 104.22% over the past 12 months, marking a strong bullish trend with accelerating momentum and a high volatility level indicated by a 213.25 standard deviation.
ON Semiconductor’s stock declined 24.14% over the same period, reflecting a bearish trend with acceleration. Recent months show a modest rebound with a 27.64% gain but low volatility at 11.66 standard deviation.
KLA’s consistent, robust growth contrasts with ON’s overall decline despite recent upturns. KLA delivered the highest market performance by a wide margin over the past year.
Target Prices
Analysts project a moderate upside for both KLA Corporation and ON Semiconductor Corporation based on the current consensus.
| Company | Target Low | Target High | Consensus |
|---|---|---|---|
| KLA Corporation | 1,400 | 1,900 | 1,672 |
| ON Semiconductor Corporation | 51 | 64 | 59 |
The consensus target for KLA stands roughly 17% above the current price of 1,428, signaling cautious optimism. ON Semiconductor’s target consensus aligns closely with its current price near 60, suggesting limited near-term valuation expansion.

Don’t Let Luck Decide Your Entry Point
Optimize your entry points with our advanced ProRealTime indicators. You’ll get efficient buy signals with precise price targets for maximum performance. Start outperforming now!
How do institutions grade them?
Here is a comparison of institutional grades for KLA Corporation and ON Semiconductor Corporation:
KLA Corporation Grades
The following table summarizes recent grades from reputable institutions for KLA Corporation.
| Grading Company | Action | New Grade | Date |
|---|---|---|---|
| Oppenheimer | Maintain | Outperform | 2026-01-30 |
| Barclays | Maintain | Overweight | 2026-01-30 |
| Cantor Fitzgerald | Maintain | Overweight | 2026-01-30 |
| Jefferies | Maintain | Buy | 2026-01-30 |
| Stifel | Maintain | Buy | 2026-01-30 |
| Wells Fargo | Maintain | Overweight | 2026-01-30 |
| Needham | Maintain | Buy | 2026-01-30 |
| RBC Capital | Maintain | Sector Perform | 2026-01-30 |
| Deutsche Bank | Maintain | Hold | 2026-01-21 |
| Needham | Maintain | Buy | 2026-01-20 |
ON Semiconductor Corporation Grades
The following table shows recent grades from verified institutions for ON Semiconductor Corporation.
| Grading Company | Action | New Grade | Date |
|---|---|---|---|
| B of A Securities | Maintain | Neutral | 2026-01-21 |
| B. Riley Securities | Maintain | Neutral | 2026-01-20 |
| Stifel | Maintain | Hold | 2026-01-16 |
| Citigroup | Maintain | Neutral | 2026-01-15 |
| Wells Fargo | Maintain | Overweight | 2026-01-15 |
| Piper Sandler | Maintain | Overweight | 2026-01-07 |
| Truist Securities | Maintain | Hold | 2025-12-19 |
| Morgan Stanley | Maintain | Equal Weight | 2025-11-24 |
| Truist Securities | Maintain | Hold | 2025-11-04 |
| Morgan Stanley | Maintain | Equal Weight | 2025-11-04 |
Which company has the best grades?
KLA Corporation consistently receives stronger grades, including multiple “Buy” and “Outperform” ratings. ON Semiconductor leans toward “Neutral” and “Hold” grades. This difference may influence investor sentiment and confidence in growth prospects.
Risks specific to each company
The following categories identify the critical pressure points and systemic threats facing both firms in the 2026 market environment:
1. Market & Competition
KLA Corporation
- Dominates semiconductor process control with high ROIC but faces pricing pressure from rivals.
ON Semiconductor Corporation
- Competes in power and sensing solutions; growth tied to automotive electrification trends and aggressive market expansion.
2. Capital Structure & Debt
KLA Corporation
- High debt-to-equity ratio (1.3) raises leverage concerns despite strong interest coverage (16.37x).
ON Semiconductor Corporation
- Low leverage (D/E 0.38) and strong interest coverage (30.49x) indicate a conservative capital structure.
3. Stock Volatility
KLA Corporation
- Beta at 1.44 shows above-market volatility; stock price recently dropped over 15%.
ON Semiconductor Corporation
- Higher beta at 1.54 with less severe recent price decline (-3.7%) but larger trading volume implies more speculative interest.
4. Regulatory & Legal
KLA Corporation
- Exposure to global semiconductor export controls and IP litigation risks.
ON Semiconductor Corporation
- Regulatory risks in automotive safety standards and government contracts could impact growth.
5. Supply Chain & Operations
KLA Corporation
- Relies on complex semiconductor manufacturing supply chains vulnerable to shortages.
ON Semiconductor Corporation
- Faces supply chain risks but benefits from diversification across automotive and industrial sectors.
6. ESG & Climate Transition
KLA Corporation
- Moderate ESG exposure with opportunities in energy-efficient chip inspection.
ON Semiconductor Corporation
- Strong ESG focus aligned with electrification and sustainable energy solutions.
7. Geopolitical Exposure
KLA Corporation
- Significant exposure to US-China tech tensions affecting semiconductor equipment sales.
ON Semiconductor Corporation
- Also exposed to geopolitical risks but less concentrated in equipment manufacturing.
Which company shows a better risk-adjusted profile?
KLA Corporation faces its biggest risk in high leverage amid market volatility, while ON Semiconductor contends with valuation and regulatory risks. ON’s conservative debt profile and diversified end-markets offer a more balanced risk-adjusted stance. However, KLA’s superior profitability and financial strength remain compelling despite debt concerns. The recent sharp price drop in KLA highlights investor sensitivity to leverage risks in volatile markets.
Final Verdict: Which stock to choose?
KLA Corporation’s superpower lies in its durable competitive advantage, demonstrated by a robust and growing ROIC well above its cost of capital. It operates as a cash-generative machine with efficient capital allocation. The point of vigilance is its elevated debt-to-equity ratio, which could amplify risks in tighter credit conditions. KLA suits portfolios focused on aggressive growth with a tolerance for leverage.
ON Semiconductor’s strategic moat centers on its improving profitability and solid balance sheet, marked by low leverage and high liquidity ratios. Its evolving ROIC signals a company on the cusp of establishing a competitive advantage. Relative to KLA, ON offers a safer profile but with more modest returns. It fits well in a GARP (Growth at a Reasonable Price) portfolio seeking stability amid growth potential.
If you prioritize high returns on invested capital and can manage leverage risk, KLA outshines as the compelling choice due to its proven value creation and accelerating earnings growth. However, if you seek better financial stability and a more conservative growth trajectory, ON offers superior balance sheet safety and room for profitability improvement. Both present analytical scenarios tailored to distinct investor profiles.
Disclaimer: Investment carries a risk of loss of initial capital. The past performance is not a reliable indicator of future results. Be sure to understand risks before making an investment decision.
Go Further
I encourage you to read the complete analyses of KLA Corporation and ON Semiconductor Corporation to enhance your investment decisions: