Home > Comparison > Technology > KLAC vs NXPI
The strategic rivalry between KLA Corporation and NXP Semiconductors defines the current trajectory of the semiconductor sector. KLA operates as a capital-intensive process control and yield management specialist, while NXP excels as a diversified semiconductor manufacturer with a broad product portfolio. This head-to-head captures the battle between precision technology and scale-driven innovation. This analysis aims to identify which corporate path offers a superior risk-adjusted return for a diversified portfolio.
Table of contents
Companies Overview
KLA Corporation and NXP Semiconductors are pivotal players shaping the semiconductor industry’s future.
KLA Corporation: Precision Process Control Leader
KLA Corporation dominates semiconductor process control, generating revenue through advanced inspection and metrology solutions. Its core competitive advantage lies in wafer defect detection and yield management technologies. In 2026, KLA sharpens its focus on integrating software-driven process control to enhance manufacturing precision and efficiency.
NXP Semiconductors N.V.: Diverse Semiconductor Innovator
NXP Semiconductors excels in producing microcontrollers, application processors, and wireless connectivity solutions. Its revenue engine thrives on supplying a broad spectrum of semiconductor products for automotive, industrial, and IoT markets. The company prioritizes expanding its presence in automotive and communication infrastructure segments this year.
Strategic Collision: Similarities & Divergences
KLA’s closed-loop process control contrasts with NXP’s broad product portfolio and open market approach. Both compete intensely in semiconductor manufacturing ecosystems but target different value chain segments. KLA appeals to process optimization investors, while NXP attracts those seeking exposure to diversified semiconductor applications.
Income Statement Comparison
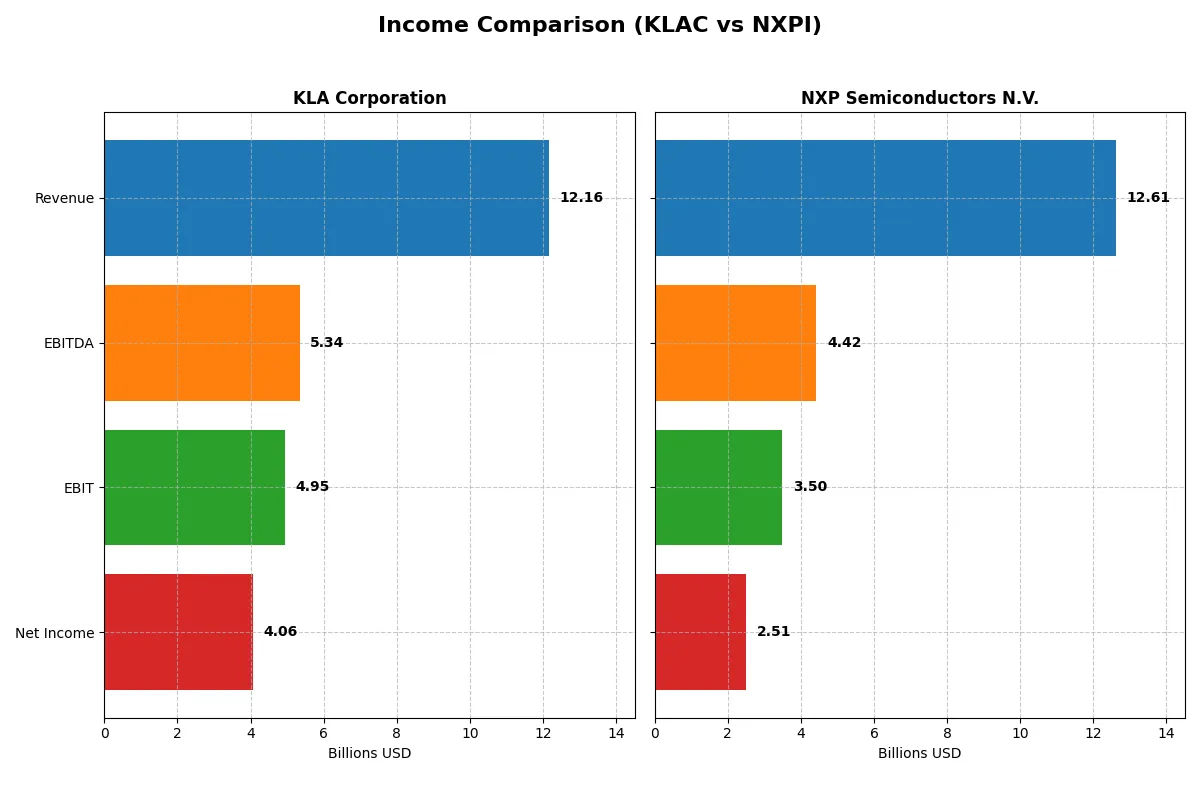
This data dissects the core profitability and scalability of both corporate engines to reveal who dominates the bottom line:
| Metric | KLA Corporation (KLAC) | NXP Semiconductors N.V. (NXPI) |
|---|---|---|
| Revenue | 12.16B | 12.61B |
| Cost of Revenue | 4.58B | 5.50B |
| Operating Expenses | 2.33B | 3.70B |
| Gross Profit | 7.58B | 7.12B |
| EBITDA | 5.34B | 4.42B |
| EBIT | 4.95B | 3.50B |
| Interest Expense | 302M | 398M |
| Net Income | 4.06B | 2.51B |
| EPS | 30.53 | 9.84 |
| Fiscal Year | 2025 | 2024 |
Income Statement Analysis: The Bottom-Line Duel
This Income Statement comparison reveals how efficiently each company converts sales into profits, spotlighting their operational strength and momentum.
KLA Corporation Analysis
KLA demonstrates robust growth with revenue rising 23.9% year-over-year to $12.2B and net income surging 47% to $4.1B in fiscal 2025. Its gross margin stands at a strong 62.3%, with net margin at 33.4%, signaling excellent cost control and profitability. The recent surge in EBIT by 41.3% underscores accelerating operational efficiency.
NXP Semiconductors N.V. Analysis
NXP’s revenue declined 5% to $12.6B in fiscal 2024, with net income dropping nearly 10% to $2.5B. Gross margin held firm at 56.4%, but net margin contracted to 19.9%, reflecting margin pressure amid lower sales. EBIT fell 7.7%, indicating challenges in maintaining operating leverage despite a favorable long-term growth trajectory.
Verdict: High Margin Growth vs. Margin Compression under Revenue Pressure
KLA exhibits superior margin expansion and strong top-line momentum, translating into robust bottom-line growth. NXP faces near-term headwinds with declining revenues and compressed margins, despite impressive long-term earnings increases. For investors prioritizing operational efficiency and margin resilience, KLA’s profile currently appears more compelling.
Financial Ratios Comparison
These vital ratios act as a diagnostic tool to expose the underlying fiscal health, valuation premiums, and capital efficiency of the companies analyzed:
| Ratios | KLA Corporation (KLAC) | NXP Semiconductors N.V. (NXPI) |
|---|---|---|
| ROE | 86.6% | 27.3% |
| ROIC | 38.0% | 12.9% |
| P/E | 29.3 | 21.1 |
| P/B | 25.4 | 5.8 |
| Current Ratio | 2.62 | 2.36 |
| Quick Ratio | 1.83 | 1.60 |
| D/E | 1.30 | 1.18 |
| Debt-to-Assets | 37.9% | 44.5% |
| Interest Coverage | 17.3 | 8.6 |
| Asset Turnover | 0.76 | 0.52 |
| Fixed Asset Turnover | 9.70 | 3.86 |
| Payout Ratio | 22.3% | 41.4% |
| Dividend Yield | 0.76% | 1.96% |
| Fiscal Year | 2025 | 2024 |
Efficiency & Valuation Duel: The Vital Signs
Financial ratios serve as a company’s DNA, uncovering hidden risks and operational strengths that raw numbers alone cannot reveal.
KLA Corporation
KLA delivers exceptional profitability with an 86.6% ROE and a robust 33.4% net margin, yet trades at a stretched P/E of 29.3 and a steep P/B of 25.4. The stock appears expensive relative to typical sector benchmarks. Shareholders receive a modest 0.76% dividend yield, indicating a preference for reinvestment in R&D, which consumes 11.1% of revenue.
NXP Semiconductors N.V.
NXP posts solid profitability, evidenced by a 27.3% ROE and 19.9% net margin, while trading at a reasonable P/E of 21.1 and a more moderate P/B of 5.8. The valuation seems fair versus industry peers. Its 1.96% dividend yield suggests balanced capital allocation between shareholder returns and growth investments, with R&D accounting for 18.6% of revenue.
Premium Valuation vs. Operational Safety
KLA commands a premium valuation justified by superior profitability but shows stretched price multiples. NXP offers a more balanced valuation with solid returns and higher dividend income. Investors prioritizing growth through operational excellence may lean toward KLA, while those seeking stable income and moderate risk might prefer NXP.
Which one offers the Superior Shareholder Reward?
I find KLA Corporation and NXP Semiconductors N.V. both pay dividends, but their approaches differ significantly. KLA yields around 0.76% with a conservative 22% payout ratio, backed by strong free cash flow coverage near 92%. NXP offers a higher 1.96% yield but pays out over 41% of earnings, with weaker free cash flow coverage at roughly 74%. KLA’s buyback program appears more robust, supporting sustainable shareholder returns. NXP invests heavily in capex, indicating growth focus but raising distribution sustainability concerns. In 2026, I favor KLA for superior total return potential, blending steady dividends and disciplined buybacks.
Comparative Score Analysis: The Strategic Profile
The radar chart highlights the fundamental DNA and trade-offs between KLA Corporation and NXP Semiconductors N.V., revealing their distinct financial strengths:
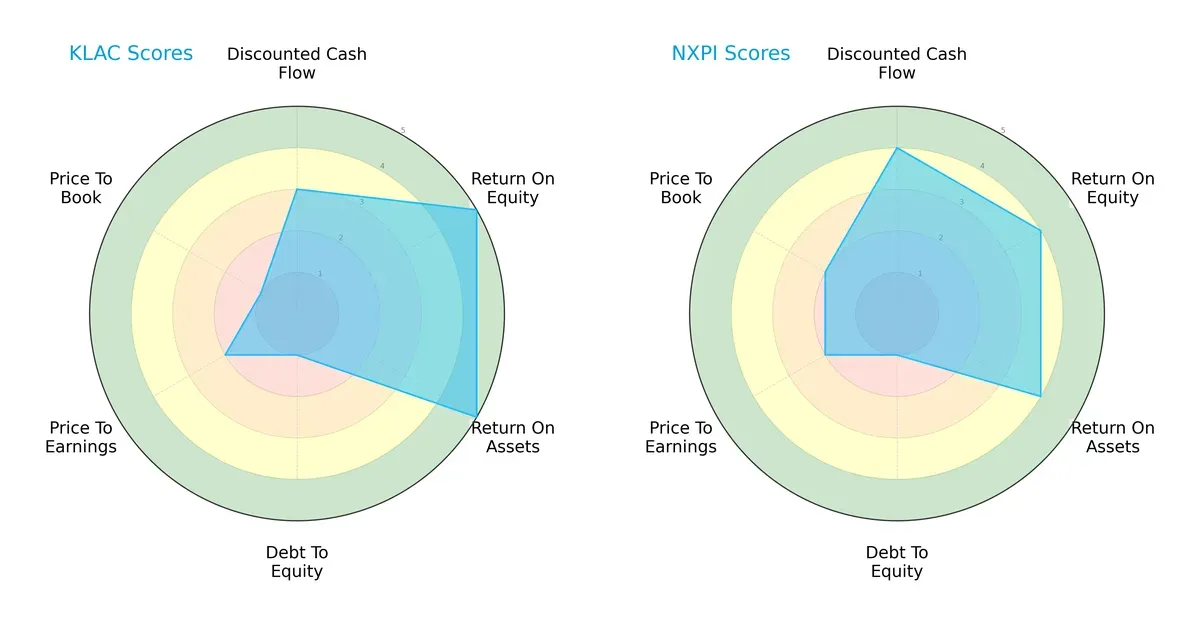
KLA excels with very favorable ROE and ROA scores (5 each), showing superior efficiency in generating returns and asset utilization. NXP Semiconductors holds a slight edge in discounted cash flow (4 vs. 3), indicating better valuation prospects. Both companies share a weak debt-to-equity score (1), signaling high leverage risk. KLA’s valuation scores lag (PE: 2, PB: 1) compared to NXP’s moderate price-to-book (2), reflecting potential undervaluation tensions. Overall, KLA has a more concentrated strength in profitability, while NXP shows a more balanced profile across valuation and returns.
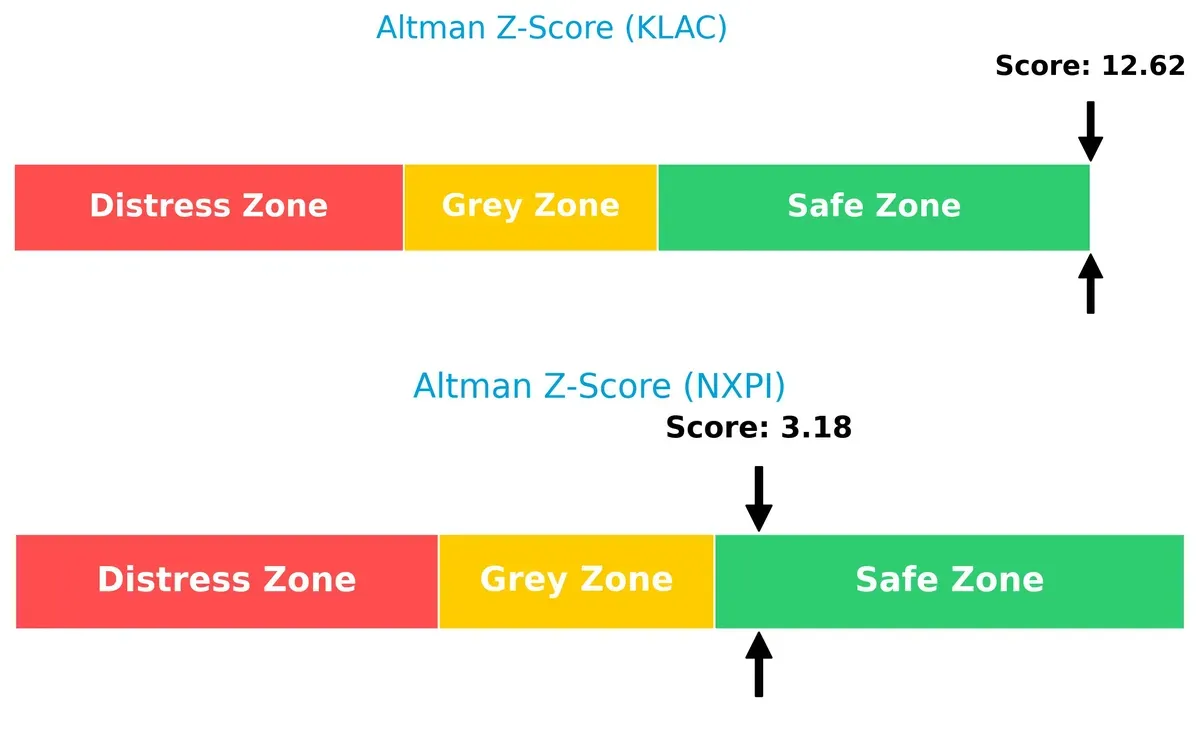
Bankruptcy Risk: Solvency Showdown
KLA’s Altman Z-Score at 12.6 vastly outperforms NXP’s 3.18, placing both in the safe zone but signaling KLA’s far stronger buffer against bankruptcy risks in this economic cycle:
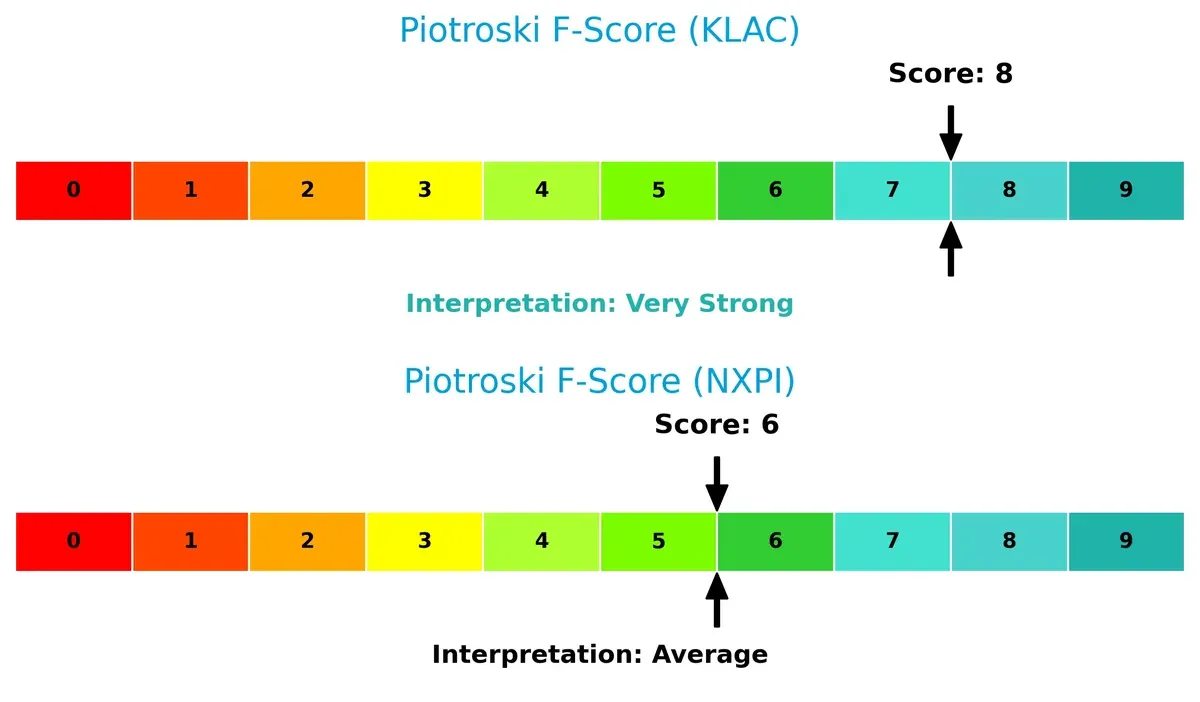
Financial Health: Quality of Operations
KLA’s Piotroski F-Score of 8 indicates very strong financial health, surpassing NXP’s average score of 6, which suggests moderate operational strength and potential red flags in internal metrics:
How are the two companies positioned?
This section dissects the operational DNA of KLAC and NXPI by comparing their revenue distribution and internal strengths and weaknesses. The goal is to confront their economic moats to identify which business model offers the most resilient and sustainable competitive advantage today.
Revenue Segmentation: The Strategic Mix
This visual comparison dissects how KLA Corporation and NXP Semiconductors N.V. diversify their income streams and where their primary sector bets lie:
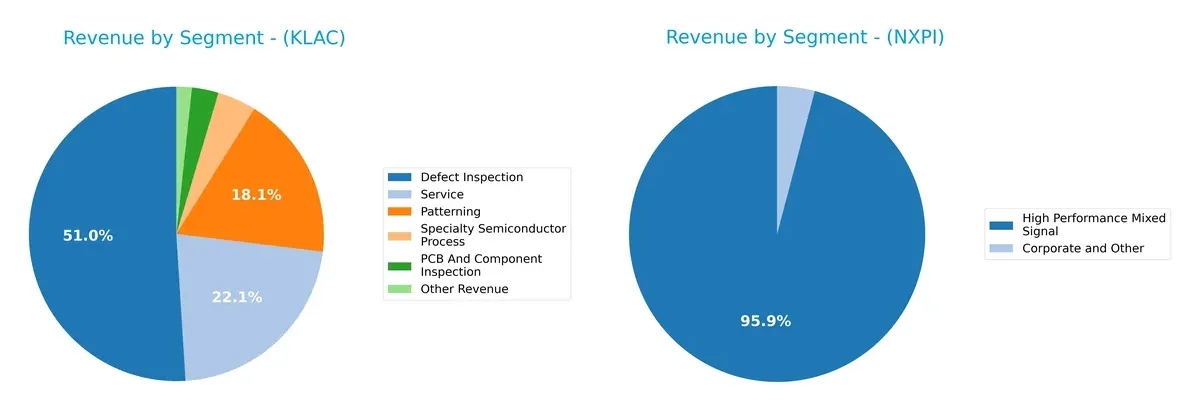
KLA Corporation’s revenue pivots around Defect Inspection at $6.2B and Service at $2.7B, showing a focused yet multi-segment approach. NXP Semiconductors N.V. dwarfs with $9.0B in High Performance Mixed Signal, relying heavily on this dominant segment. KLA’s diversified mix reduces concentration risk, supporting ecosystem lock-in through inspection and service. NXP’s dependence signals infrastructure dominance but heightens vulnerability if market shifts impact its core segment.
Strengths and Weaknesses Comparison
This table compares the strengths and weaknesses of KLA Corporation and NXP Semiconductors N.V.:
KLA Corporation Strengths
- Strong profitability with 33.41% net margin and 86.56% ROE
- High ROIC at 37.97% well above WACC
- Solid liquidity ratios: current 2.62, quick 1.83
- Diverse product segments including defect inspection and patterning
- Significant global sales exposure in China and Taiwan
NXP Semiconductors N.V. Strengths
- Favorable profitability metrics: 19.9% net margin, 27.33% ROE
- ROIC positive at 12.91% with neutral WACC
- Good liquidity: current 2.36, quick 1.6
- Focused product portfolio centered on high-performance mixed signal
- Broad geographic presence including US, China, and Europe
KLA Corporation Weaknesses
- High valuation multiples: PE 29.34, PB 25.39 flagged unfavorable
- Elevated debt-to-equity at 1.3 and moderate debt-to-assets
- WACC at 10.42% exceeds ROIC, a cost of capital concern
- Dividend yield low at 0.76%
- Asset turnover moderate at 0.76 limiting asset efficiency
NXP Semiconductors N.V. Weaknesses
- Relatively high debt-to-equity at 1.18 with moderate debt load
- PB ratio unfavorable at 5.78 despite neutral PE
- Lower asset turnover at 0.52 indicating less efficient asset use
- Dividend yield neutral but low at 1.96%
- Concentrated product segmentation may limit diversification
KLA excels in profitability and product diversity but faces valuation and capital cost challenges. NXP shows balanced profitability with geographic breadth but carries moderate leverage and lower asset efficiency. Both companies demonstrate strengths suited to their strategic focus and must manage financial risks prudently.
The Moat Duel: Analyzing Competitive Defensibility
A structural moat is the only true shield that preserves long-term profits from relentless competitive pressure in the semiconductor industry:
KLA Corporation: Process Control and Yield Management Moat
KLA’s moat stems from specialized process control technology, yielding a high 40.7% EBIT margin and 27.5% ROIC premium over WACC. Its expanding presence in advanced markets deepens this moat in 2026.
NXP Semiconductors N.V.: Diversified Connectivity and Security Moat
NXP’s advantage lies in its broad portfolio of microcontrollers and wireless connectivity, delivering steady value creation with a 3.5% ROIC premium. Its growing ROIC trend signals strong but narrower moat relative to KLA.
Verdict: Precision Process Control vs. Broad Connectivity Solutions
KLA boasts a wider and deeper moat, supported by superior margins and capital efficiency. It stands better positioned to defend market share amid evolving semiconductor complexity in 2026.
Which stock offers better returns?
The past year shows divergent price dynamics: KLA Corporation’s shares more than doubled, while NXP Semiconductors N.V. declined, despite recent partial rebounds in both stocks.
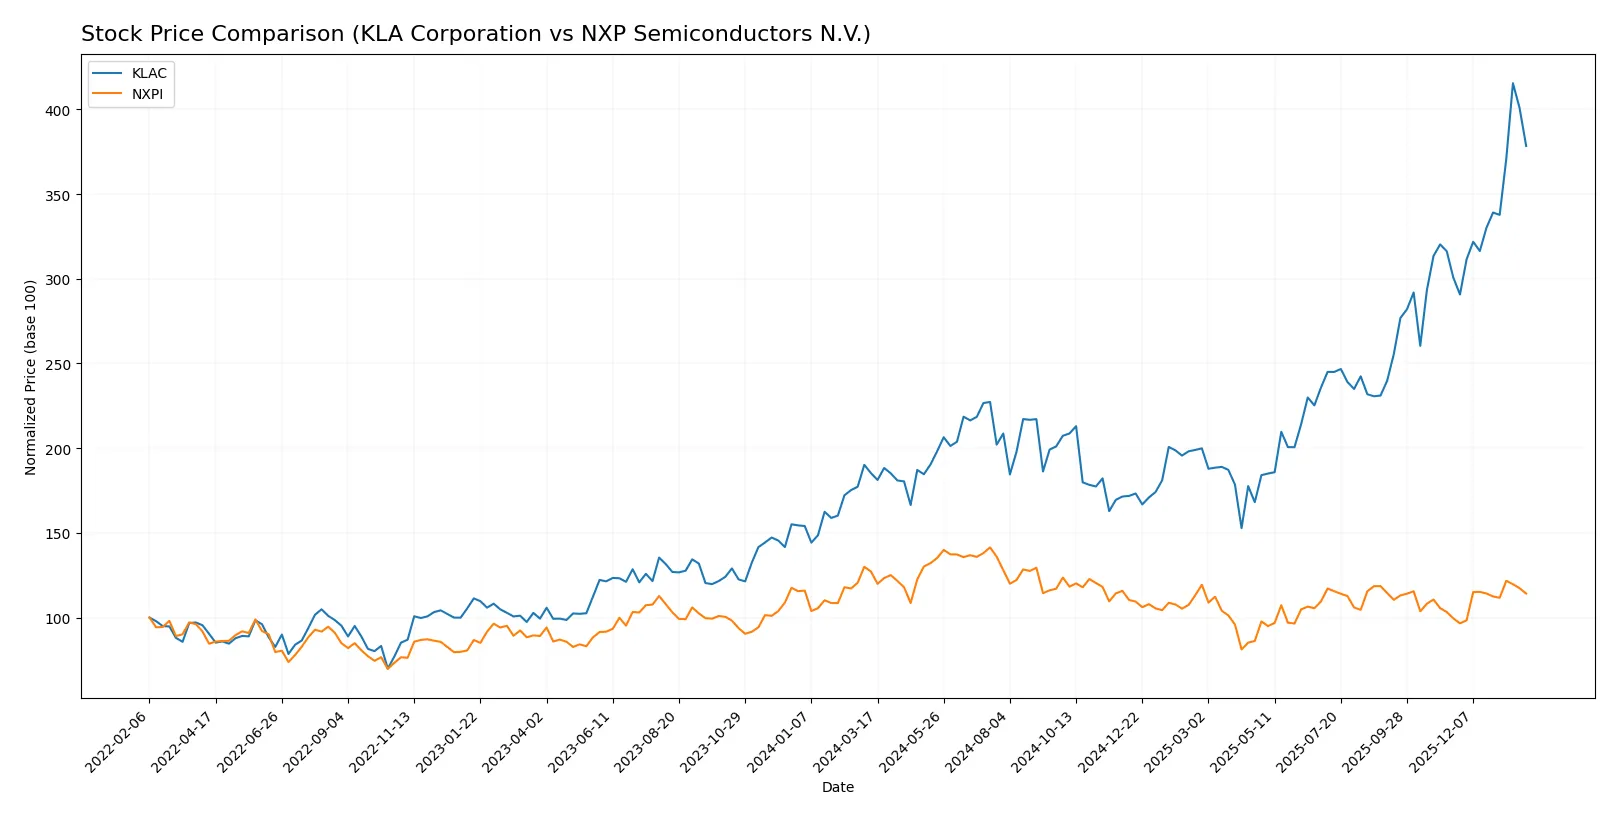
Trend Comparison
KLA Corporation’s stock rose 104.22% over 12 months, marking a strong bullish trend with accelerating momentum. The price ranged from 577 to 1568, showing significant volatility with a standard deviation of 213.25.
NXP Semiconductors N.V. fell 10.27% over the same period, reflecting a bearish trend despite acceleration signs. The stock traded between 161 and 280, with lower volatility at a 24.23 standard deviation.
KLA clearly outperformed NXP, delivering the highest market return and stronger upward momentum during the analyzed year.
Target Prices
Analysts present a bullish consensus for both KLA Corporation and NXP Semiconductors N.V.
| Company | Target Low | Target High | Consensus |
|---|---|---|---|
| KLA Corporation | 1400 | 1900 | 1672.25 |
| NXP Semiconductors N.V. | 215 | 280 | 242.5 |
The consensus target prices suggest upside potential for both stocks versus current prices. KLA’s target consensus stands 17% above its 1428 current price, while NXP’s target consensus exceeds its 226 price by 7%.

Don’t Let Luck Decide Your Entry Point
Optimize your entry points with our advanced ProRealTime indicators. You’ll get efficient buy signals with precise price targets for maximum performance. Start outperforming now!
How do institutions grade them?
KLA Corporation Grades
The table below summarizes recent grades from major institutions for KLA Corporation.
| Grading Company | Action | New Grade | Date |
|---|---|---|---|
| Oppenheimer | Maintain | Outperform | 2026-01-30 |
| Barclays | Maintain | Overweight | 2026-01-30 |
| Cantor Fitzgerald | Maintain | Overweight | 2026-01-30 |
| Jefferies | Maintain | Buy | 2026-01-30 |
| Stifel | Maintain | Buy | 2026-01-30 |
| Wells Fargo | Maintain | Overweight | 2026-01-30 |
| Needham | Maintain | Buy | 2026-01-30 |
| RBC Capital | Maintain | Sector Perform | 2026-01-30 |
| Deutsche Bank | Maintain | Hold | 2026-01-21 |
| Needham | Maintain | Buy | 2026-01-20 |
NXP Semiconductors N.V. Grades
The following table shows recent institutional grades for NXP Semiconductors N.V.
| Grading Company | Action | New Grade | Date |
|---|---|---|---|
| Wells Fargo | Maintain | Overweight | 2026-01-15 |
| Citigroup | Maintain | Buy | 2026-01-15 |
| Truist Securities | Maintain | Buy | 2025-12-19 |
| JP Morgan | Maintain | Neutral | 2025-10-29 |
| Truist Securities | Maintain | Buy | 2025-10-29 |
| Wells Fargo | Maintain | Overweight | 2025-07-23 |
| Truist Securities | Maintain | Buy | 2025-07-23 |
| JP Morgan | Maintain | Neutral | 2025-07-23 |
| Susquehanna | Maintain | Neutral | 2025-07-23 |
| Barclays | Maintain | Overweight | 2025-07-22 |
Which company has the best grades?
KLA Corporation consistently receives higher ratings such as Outperform and Buy, while NXP Semiconductors N.V. shows a mix of Buy, Overweight, and Neutral grades. This suggests stronger institutional confidence in KLA, potentially leading to better investor sentiment and valuation support.
Risks specific to each company
The following categories identify critical pressure points and systemic threats facing both firms in the 2026 market environment:
1. Market & Competition
KLA Corporation
- Operates in a highly cyclical semiconductor equipment sector; faces aggressive innovation and pricing pressure from peers.
NXP Semiconductors N.V.
- Competes in diverse semiconductor markets including automotive and IoT; must navigate rapid tech shifts and broad customer base demands.
2. Capital Structure & Debt
KLA Corporation
- Debt-to-equity ratio at 1.3 signals elevated leverage, increasing financial risk despite strong interest coverage.
NXP Semiconductors N.V.
- Slightly lower leverage (D/E 1.18) but still on the high side, which may constrain flexibility during downturns.
3. Stock Volatility
KLA Corporation
- Beta at 1.44 reflects above-market volatility, heightening risk in turbulent markets.
NXP Semiconductors N.V.
- Similar beta at 1.46 also indicates high sensitivity to market swings and economic cycles.
4. Regulatory & Legal
KLA Corporation
- U.S.-based with exposure to export controls and IP litigation risks amid geopolitical tech tensions.
NXP Semiconductors N.V.
- Dutch headquarters with broad international footprint exposes it to varied compliance challenges and trade restrictions.
5. Supply Chain & Operations
KLA Corporation
- Dependent on precision manufacturing and specialized suppliers, vulnerable to supply shocks and capacity constraints.
NXP Semiconductors N.V.
- Complex global supply chains across automotive and industrial segments increase operational risk and logistical costs.
6. ESG & Climate Transition
KLA Corporation
- Faces rising pressure to meet environmental standards in semiconductor manufacturing, which is energy-intensive.
NXP Semiconductors N.V.
- Must align with EU climate initiatives, managing carbon footprint while sustaining growth in energy-sensitive markets.
7. Geopolitical Exposure
KLA Corporation
- U.S.-China tensions pose risks to sales and supply chains given global semiconductor market dependencies.
NXP Semiconductors N.V.
- Broad geographic presence includes Asia and Europe, exposing it to trade disputes and regional instability.
Which company shows a better risk-adjusted profile?
KLA Corporation’s primary risk lies in its high leverage amid market cyclicality, which could strain its balance sheet if downturns persist. NXP’s most critical risk is its complex global supply chain vulnerable to geopolitical disruptions. Despite strong profitability metrics, KLA’s elevated debt and valuation multiples raise caution. NXP, with a more moderate valuation and diverse end markets, offers a slightly better risk-adjusted profile. Notably, KLA’s Altman Z-Score far exceeds NXP’s, indicating superior bankruptcy safety, yet NXP’s more balanced leverage and operational diversification justify tempered optimism.
Final Verdict: Which stock to choose?
KLA Corporation’s superpower lies in its exceptional capital efficiency and robust margin expansion. It consistently outpaces its cost of capital, signaling durable value creation. A point of vigilance is its elevated valuation multiples, which could pressure returns if growth slows. KLAC fits well in aggressive growth portfolios seeking high return on equity.
NXP Semiconductors boasts a strategic moat rooted in diversified end-markets and resilient cash flow generation. Its lower valuation and steady profitability offer a comparatively safer profile than KLAC’s premium positioning. NXPI is better suited for GARP investors who prioritize steady growth with more moderate risk exposure.
If you prioritize high return on invested capital and aggressive expansion, KLAC outshines with superior profitability and market momentum. However, if you seek better stability and valuation discipline, NXPI offers a more balanced risk-return profile. Both demonstrate durable moats, but your choice depends on your appetite for growth versus risk management.
Disclaimer: Investment carries a risk of loss of initial capital. The past performance is not a reliable indicator of future results. Be sure to understand risks before making an investment decision.
Go Further
I encourage you to read the complete analyses of KLA Corporation and NXP Semiconductors N.V. to enhance your investment decisions: