Home > Comparison > Technology > NVDA vs KLAC
The strategic rivalry between NVIDIA Corporation and KLA Corporation shapes the semiconductor industry’s evolution. NVIDIA excels as a high-growth innovator in graphics and AI computing platforms. KLA leads as a capital-intensive provider of process control and yield management solutions essential for chip manufacturing. This analysis contrasts their operational models and market positions to identify which trajectory offers superior risk-adjusted returns for a diversified portfolio in the dynamic tech landscape.
Table of contents
Companies Overview
NVIDIA and KLA hold commanding roles in the semiconductor industry, shaping innovation and production efficiency.
NVIDIA Corporation: Leader in Visual Computing and AI
NVIDIA dominates as a graphics and compute solutions provider. It generates revenue from GeForce GPUs for gaming and professional markets, plus AI and data center platforms. In 2026, NVIDIA’s strategic focus centers on expanding its AI enterprise software and autonomous vehicle platforms, reinforcing its edge in accelerated computing and virtual environments.
KLA Corporation: Precision in Semiconductor Process Control
KLA specializes in process control and yield management for semiconductor manufacturing. Its revenue stems from inspection, metrology, and defect analysis systems critical to chip production. In 2026, KLA emphasizes advancing wafer inspection technologies and integrating AI-driven process control to enhance manufacturing accuracy and meet evolving semiconductor complexity.
Strategic Collision: Similarities & Divergences
Both companies serve the semiconductor ecosystem but with contrasting approaches: NVIDIA pursues an innovation-driven, product-centric model, while KLA focuses on enabling precision manufacturing. They primarily compete at different stages—NVIDIA in chip design and AI processing, KLA in fabrication efficiency. This delineation creates distinct investment profiles, with NVIDIA leaning on growth and market disruption, and KLA on operational excellence and industry indispensability.
Income Statement Comparison
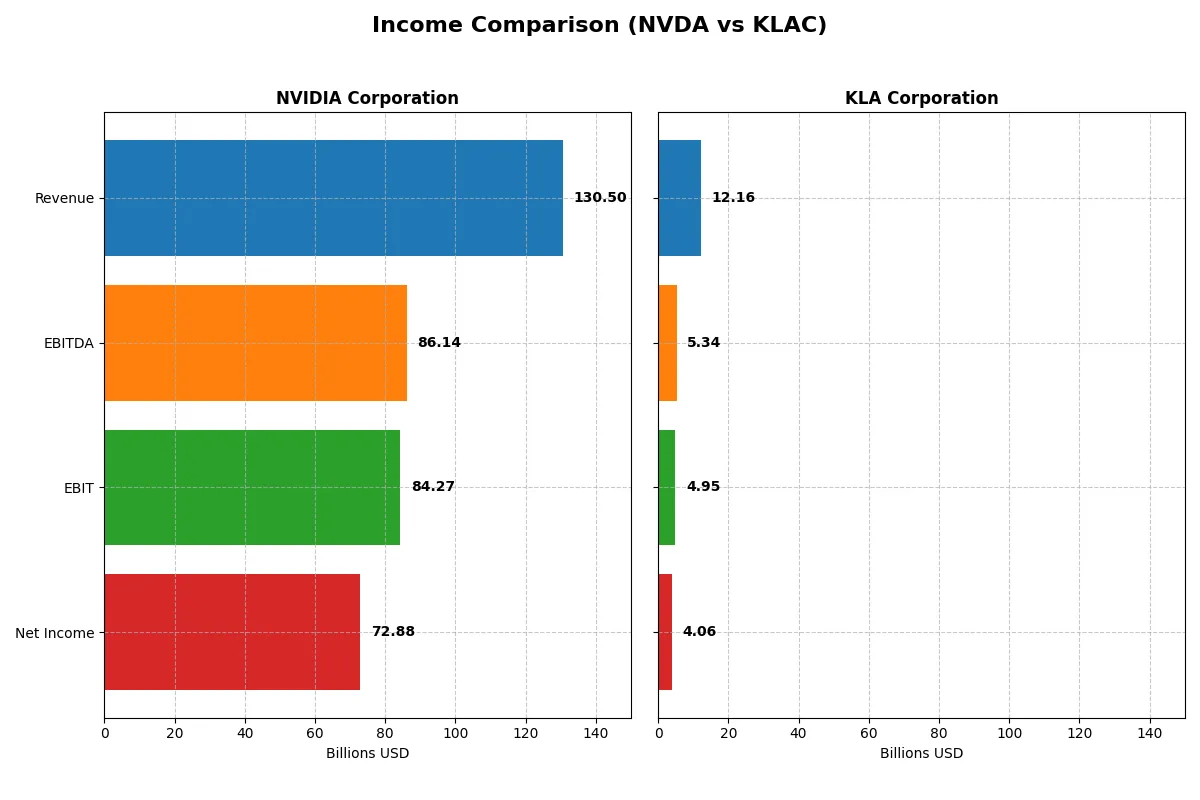
This data dissects the core profitability and scalability of both corporate engines to reveal who dominates the bottom line:
| Metric | NVIDIA Corporation (NVDA) | KLA Corporation (KLAC) |
|---|---|---|
| Revenue | 130.5B | 12.2B |
| Cost of Revenue | 32.6B | 4.6B |
| Operating Expenses | 16.4B | 2.3B |
| Gross Profit | 97.9B | 7.6B |
| EBITDA | 86.1B | 5.3B |
| EBIT | 84.3B | 4.9B |
| Interest Expense | 247M | 302M |
| Net Income | 72.9B | 4.1B |
| EPS | 2.97 | 30.53 |
| Fiscal Year | 2025 | 2025 |
Income Statement Analysis: The Bottom-Line Duel
This income statement comparison reveals which company operates with greater efficiency and generates superior profitability from its revenues.
NVIDIA Corporation Analysis
NVIDIA’s revenue soared from 27B in 2021 to 130.5B in 2025, reflecting explosive growth. Net income followed suit, surging to 72.9B in 2025. The company sustains a robust gross margin near 75% and a net margin approaching 56%, signaling exceptional cost control and pricing power. Its latest fiscal year shows accelerating momentum with a 114% revenue jump and strong margin expansion.
KLA Corporation Analysis
KLA’s revenue grew steadily from 6.9B in 2021 to 12.2B in 2025, demonstrating consistent expansion. Net income reached 4.1B in 2025, with solid but more modest margins—gross margin at 62% and net margin at 33%. The firm maintains positive growth rates in revenue and earnings, but at a more measured pace than NVIDIA, reflecting stable operational efficiency rather than rapid scaling.
Verdict: High-Flying Growth vs. Steady Expansion
NVIDIA dominates in both scale and profitability, delivering far superior margins and explosive income growth compared to KLA’s steady but slower ascent. For investors prioritizing rapid expansion and margin leverage, NVIDIA’s profile stands out. KLA offers a more conservative growth trajectory, appealing to those favoring stability over breakneck momentum.
Financial Ratios Comparison
These vital ratios act as a diagnostic tool to expose the underlying fiscal health, valuation premiums, and capital efficiency of the companies analyzed:
| Ratios | NVIDIA Corporation (NVDA) | KLA Corporation (KLAC) |
|---|---|---|
| ROE | 91.9% | 86.6% |
| ROIC | 75.3% | 38.0% |
| P/E | 39.9 | 29.3 |
| P/B | 36.7 | 25.4 |
| Current Ratio | 4.44 | 2.62 |
| Quick Ratio | 3.88 | 1.83 |
| D/E | 0.13 | 1.30 |
| Debt-to-Assets | 9.2% | 37.9% |
| Interest Coverage | 330x | 17.3x |
| Asset Turnover | 1.17 | 0.76 |
| Fixed Asset Turnover | 16.16 | 9.70 |
| Payout ratio | 1.14% | 22.3% |
| Dividend yield | 0.03% | 0.76% |
| Fiscal Year | 2025 | 2025 |
Efficiency & Valuation Duel: The Vital Signs
Financial ratios act as a company’s DNA, exposing hidden risks and operational prowess that shape investor decisions.
NVIDIA Corporation
NVIDIA displays stellar profitability with a ROE of 91.9% and a net margin of 55.9%, signaling operational excellence. However, its elevated P/E of 39.9 and P/B of 36.7 mark the stock as stretched and expensive by market standards. Shareholders see minimal dividends, as NVIDIA prioritizes reinvestment in robust R&D to fuel growth.
KLA Corporation
KLA boasts a strong ROE of 86.6% and a solid net margin at 33.4%, reflecting efficient operations. Its P/E at 29.3 and P/B of 25.4 suggest a relatively expensive valuation, though less stretched than NVIDIA’s. KLA maintains a higher dividend yield near 0.76%, balancing shareholder returns with steady cash flow management.
Premium Valuation vs. Operational Safety
NVIDIA leads with superior profitability but carries a notably higher valuation multiple, increasing risk for stretched investors. KLA offers a steadier valuation and better dividend yield, providing a more balanced risk-reward profile. Growth-focused investors may lean toward NVIDIA, while income-oriented investors might prefer KLA’s steadiness.
Which one offers the Superior Shareholder Reward?
I compare NVIDIA and KLA’s shareholder reward by examining their dividends and buybacks through 2025. NVIDIA offers a minuscule dividend yield near 0.03%, with a payout ratio around 1%. Its buyback program is significant but modest relative to cash flow. KLA yields about 0.76% with a payout ratio near 22%, indicating a stronger dividend commitment. KLA’s free cash flow supports a robust dividend and buyback balance, with buybacks complementing its distribution strategy. NVIDIA reinvests heavily in growth, limiting dividends but retaining strong buyback flexibility. KLA’s model suits income-focused investors, while NVIDIA targets growth with selective returns. For 2026 total return, I favor NVIDIA’s sustainable buyback and reinvestment approach over KLA’s higher but more payout-constrained yield.
Comparative Score Analysis: The Strategic Profile
The radar chart reveals the fundamental DNA and trade-offs of NVIDIA Corporation and KLA Corporation, highlighting their distinctive financial strengths and vulnerabilities:
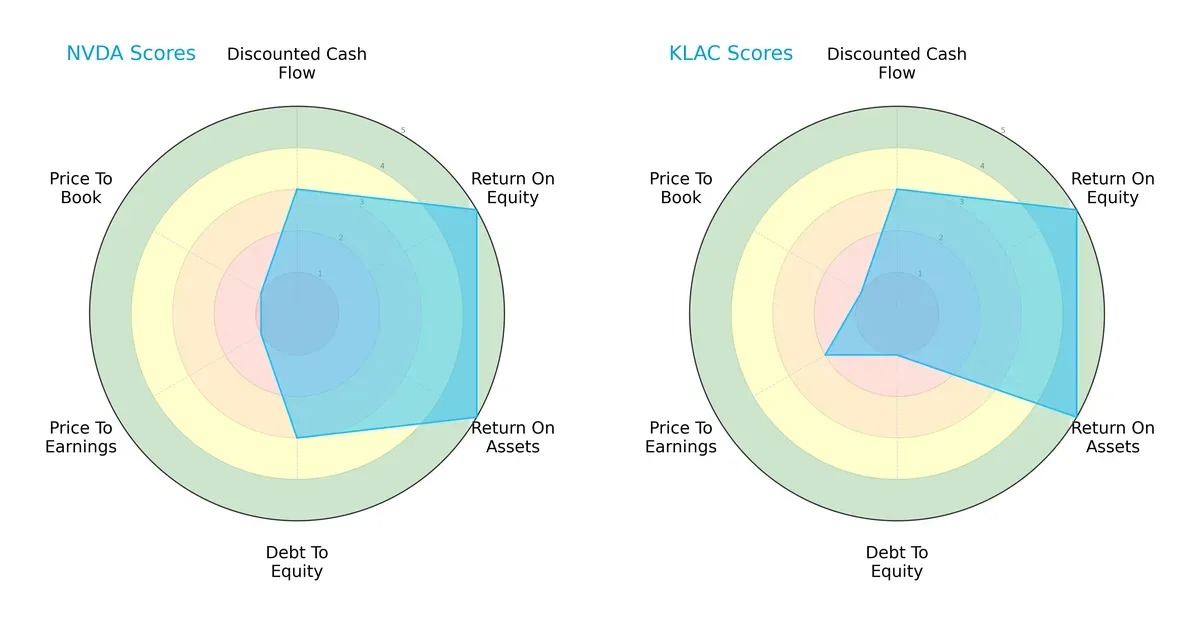
NVIDIA and KLA both excel in return on equity (ROE) and return on assets (ROA), scoring very favorably at 5. They share a moderate discounted cash flow (DCF) score of 3. However, NVIDIA shows a balanced debt-to-equity score of 3, indicating moderate leverage, while KLA’s low score of 1 signals higher financial risk from debt. Valuation metrics reveal NVIDIA’s P/E and P/B are very unfavorable at 1, suggesting overvaluation concerns, whereas KLA fares slightly better on P/E with a score of 2 but shares the same P/B weakness. Overall, NVIDIA holds a more balanced profile, leveraging operational efficiency, while KLA relies on a specific edge in asset returns but carries higher leverage risk.
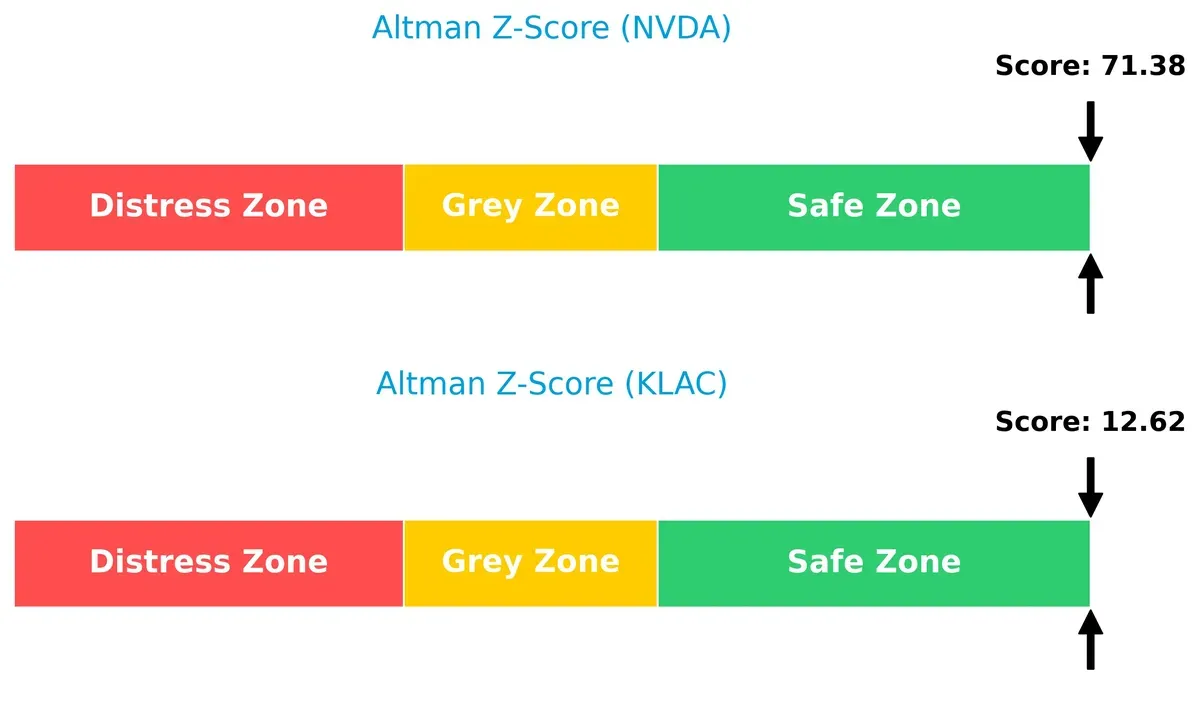
Bankruptcy Risk: Solvency Showdown
NVIDIA’s Altman Z-Score of 71.4 far exceeds KLA’s 12.6, both comfortably in the safe zone, implying strong long-term solvency and minimal bankruptcy risk in today’s cycle:
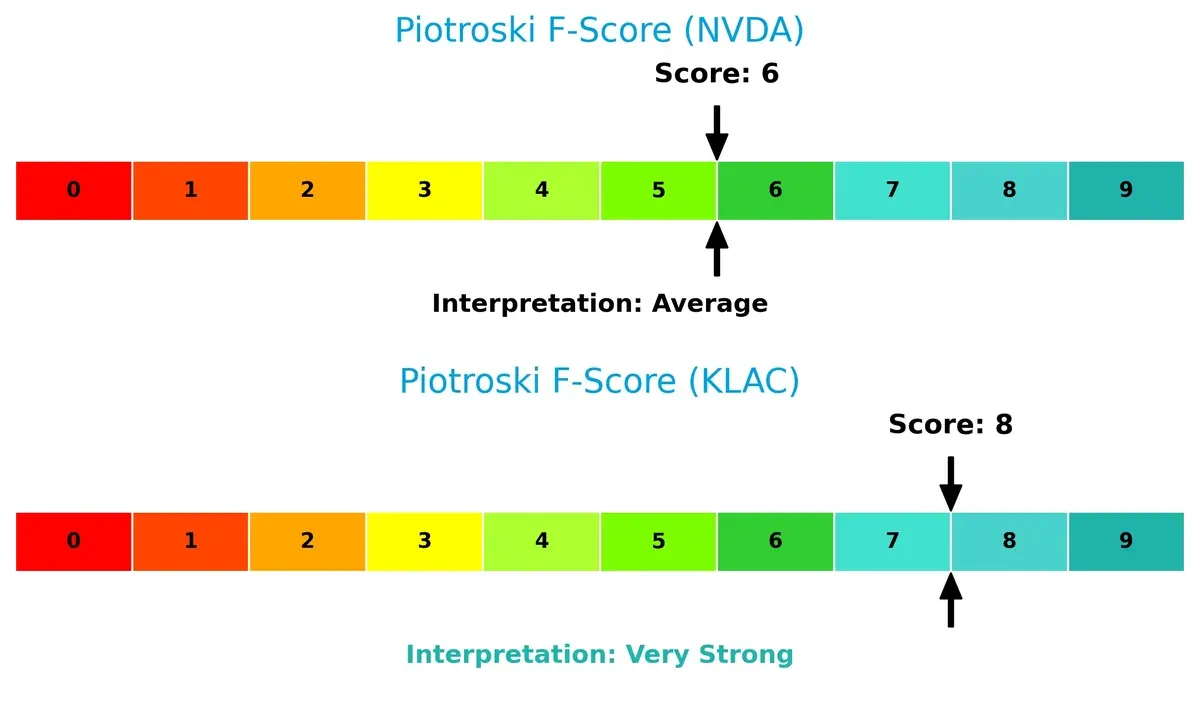
Financial Health: Quality of Operations
KLA’s Piotroski F-Score of 8 outperforms NVIDIA’s 6, indicating KLA is in stronger financial health with fewer red flags in profitability, leverage, liquidity, and operational efficiency:
How are the two companies positioned?
This section dissects NVDA and KLAC’s operational DNA by comparing their revenue distribution and internal strengths and weaknesses. The goal is to confront their economic moats to identify which model offers the most resilient, sustainable advantage today.
Revenue Segmentation: The Strategic Mix
This visual comparison dissects how NVIDIA Corporation and KLA Corporation diversify their income streams and where their primary sector bets lie:
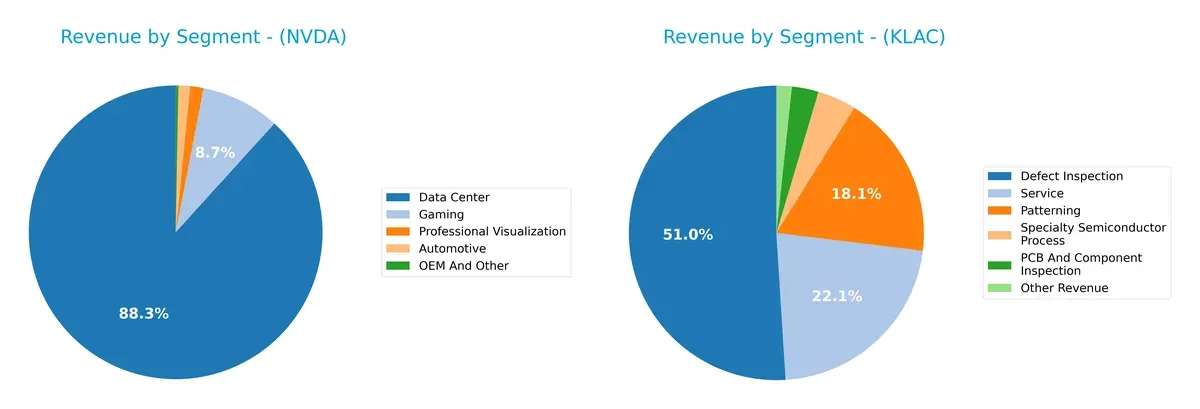
NVIDIA’s revenue pivots heavily on Data Center at $115B, dwarfing other segments like Gaming at $11.4B and Automotive at $1.7B. This concentration signals a strong ecosystem lock-in around AI and cloud infrastructure. In contrast, KLA exhibits a more balanced portfolio, with Defect Inspection leading at $6.2B but substantial contributions from Patterning ($2.2B) and Service ($2.7B). KLA’s diversified mix mitigates concentration risk, supporting steady semiconductor process dominance.
Strengths and Weaknesses Comparison
This table compares the Strengths and Weaknesses of NVIDIA Corporation and KLA Corporation:
NVIDIA Corporation Strengths
- High net margin at 55.85%
- ROE of 91.87% indicates strong profitability
- ROIC of 75.28% well above WACC
- Low debt to assets at 9.2%
- Quick ratio favorable at 3.88
- Robust global presence with $61B US sales
KLA Corporation Strengths
- Strong net margin at 33.41%
- ROE of 86.56% shows efficient equity use
- Favorable ROIC at 37.97%
- Current ratio healthy at 2.62
- Interest coverage solid at 16.37
- Diverse geographic presence across Asia and North America
NVIDIA Corporation Weaknesses
- Unfavorable high WACC at 14.69%
- Overvalued with PE at 39.9 and PB at 36.66
- Current ratio unusually high at 4.44, may indicate inefficient asset use
- Minimal dividend yield at 0.03%
- Concentrated revenue in Data Center segment
KLA Corporation Weaknesses
- Elevated debt to equity at 1.3
- WACC at 10.42% unfavorable relative to ROIC
- PE ratio relatively high at 29.34
- Dividend yield low at 0.76%
- Neutral asset turnover at 0.76 suggests room for operational improvement
NVIDIA shows superior profitability and capital efficiency but faces valuation and liquidity concerns. KLA maintains solid financial health with balanced ratios yet carries higher leverage and modest operational efficiency. Both companies’ strategies must weigh these factors amid sector dynamics.
The Moat Duel: Analyzing Competitive Defensibility
A structural moat is the only true barrier protecting long-term profits from relentless competition erosion. Let’s dissect the moats of two semiconductor giants:
NVIDIA Corporation: Innovation-Driven Network Effects
NVIDIA’s moat hinges on powerful network effects fueled by cutting-edge GPUs and AI platforms. This shows in a soaring ROIC, currently 60.6% above WACC, and stable 75%+ gross margins. Expansion into AI software and data centers deepens its moat in 2026, but fierce competition in AI hardware poses risks.
KLA Corporation: Precision Process Control Moat
KLA’s moat derives from specialized wafer inspection technology, creating high switching costs for semiconductor manufacturers. Its ROIC exceeds WACC by 27.5%, with solid 62% gross margins. While growth is steadier than NVIDIA’s, KLA’s moat benefits from essential manufacturing equipment demand and incremental innovation in semiconductor process control.
Moat Strength Showdown: Network Effects vs. Process Control Dominance
NVIDIA’s wider and faster-growing moat outpaces KLA’s more niche, stable competitive advantage. NVIDIA’s superior capital efficiency and ecosystem expansion better position it to defend market share against emerging rivals through 2026.
Which stock offers better returns?
Over the past 12 months, NVIDIA’s shares surged over 118%, showing a strong bullish trend with decelerating momentum. KLA’s stock also gained above 104%, accelerating upward amid significant volatility.
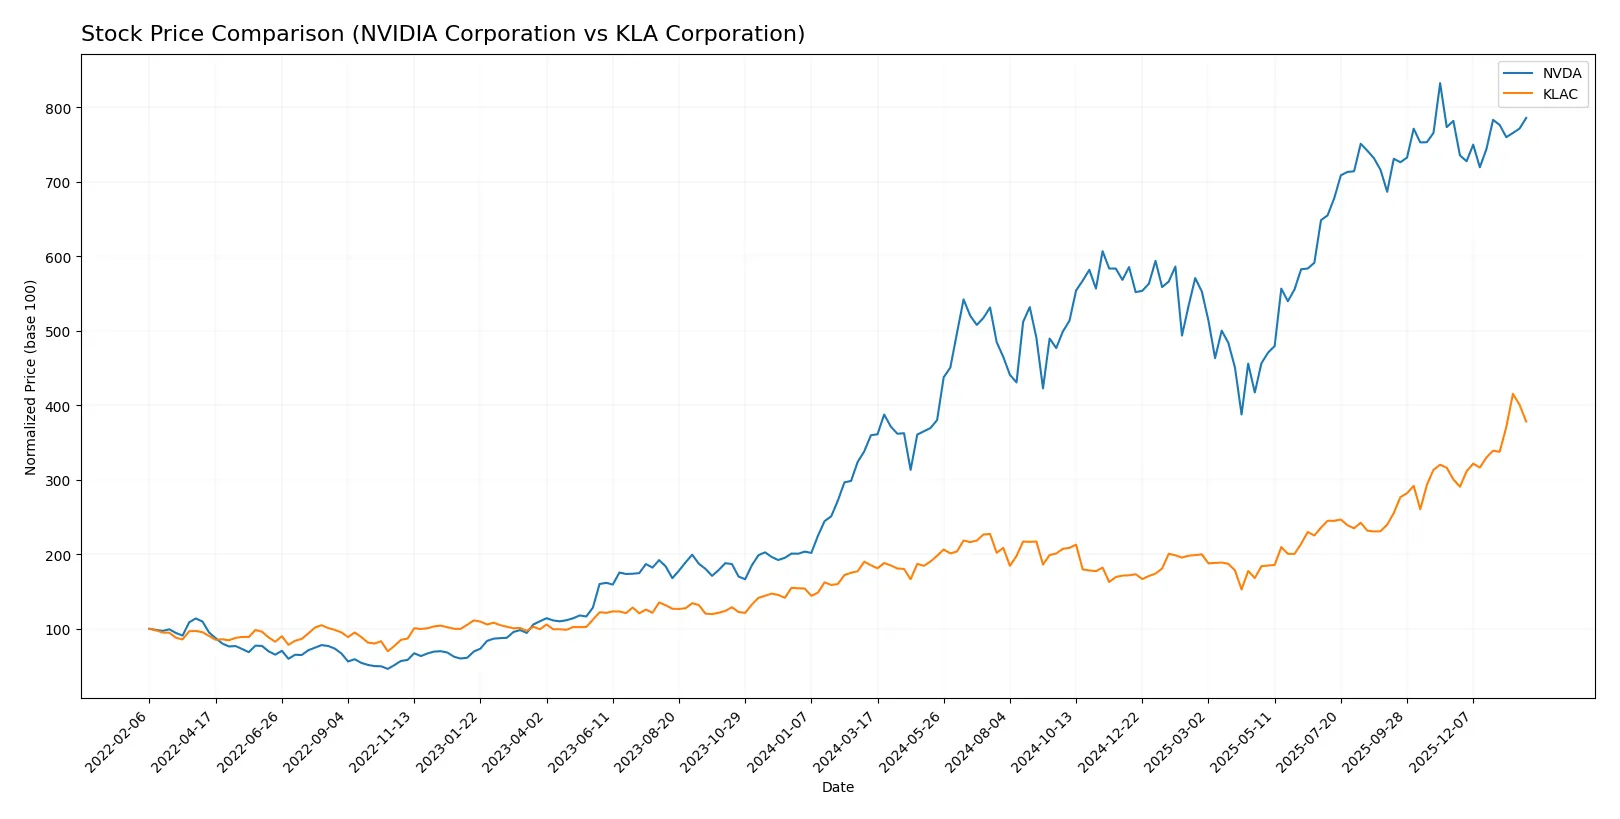
Trend Comparison
NVIDIA’s stock rose 118.36% over the last year, marking a bullish trend with deceleration and a high price range between 76.2 and 202.49. KLA’s shares increased 104.22%, also bullish with accelerating momentum, but with far greater volatility and a wider price range from 576.53 to 1567.82. NVIDIA outperformed KLA by delivering the highest return, despite lower volatility and slowing momentum.
Target Prices
Analysts maintain a cautiously optimistic consensus on NVIDIA Corporation and KLA Corporation target prices.
| Company | Target Low | Target High | Consensus |
|---|---|---|---|
| NVIDIA Corporation | 140 | 352 | 265.21 |
| KLA Corporation | 1400 | 1900 | 1672.25 |
NVIDIA’s consensus target exceeds its current price by roughly 39%, signaling upside potential. KLA’s target consensus sits about 17% above the current price, reflecting moderate room for appreciation.

Don’t Let Luck Decide Your Entry Point
Optimize your entry points with our advanced ProRealTime indicators. You’ll get efficient buy signals with precise price targets for maximum performance. Start outperforming now!
How do institutions grade them?
This section compares the latest institutional grades for NVIDIA Corporation and KLA Corporation:
NVIDIA Corporation Grades
The table below shows recent grades for NVIDIA Corporation by leading grading firms.
| Grading Company | Action | New Grade | Date |
|---|---|---|---|
| Jefferies | Maintain | Buy | 2026-01-16 |
| Mizuho | Maintain | Outperform | 2026-01-09 |
| Stifel | Maintain | Buy | 2025-12-29 |
| Truist Securities | Maintain | Buy | 2025-12-29 |
| B of A Securities | Maintain | Buy | 2025-12-26 |
| Bernstein | Maintain | Outperform | 2025-12-26 |
| Baird | Maintain | Outperform | 2025-12-26 |
| Truist Securities | Maintain | Buy | 2025-12-19 |
| Tigress Financial | Maintain | Strong Buy | 2025-12-18 |
| Morgan Stanley | Maintain | Overweight | 2025-12-01 |
KLA Corporation Grades
The table below lists recent grades for KLA Corporation by recognized grading firms.
| Grading Company | Action | New Grade | Date |
|---|---|---|---|
| Oppenheimer | Maintain | Outperform | 2026-01-30 |
| Barclays | Maintain | Overweight | 2026-01-30 |
| Cantor Fitzgerald | Maintain | Overweight | 2026-01-30 |
| Jefferies | Maintain | Buy | 2026-01-30 |
| Stifel | Maintain | Buy | 2026-01-30 |
| Wells Fargo | Maintain | Overweight | 2026-01-30 |
| Needham | Maintain | Buy | 2026-01-30 |
| RBC Capital | Maintain | Sector Perform | 2026-01-30 |
| Deutsche Bank | Maintain | Hold | 2026-01-21 |
| Needham | Maintain | Buy | 2026-01-20 |
Which company has the best grades?
NVIDIA has a larger proportion of “Buy,” “Outperform,” and “Strong Buy” ratings, including high conviction from Tigress Financial. KLA’s grades are mostly “Buy” and “Overweight,” with some “Hold” and “Sector Perform” ratings. NVIDIA’s stronger consensus could indicate higher analyst confidence, potentially influencing investor sentiment more positively.
Risks specific to each company
The following categories identify critical pressure points and systemic threats facing NVIDIA Corporation and KLA Corporation in the 2026 market environment:
1. Market & Competition
NVIDIA Corporation
- Faces fierce competition in GPUs and AI chips, with rapid innovation cycles pressuring margins.
KLA Corporation
- Competes in semiconductor process control with fewer direct rivals but must innovate constantly.
2. Capital Structure & Debt
NVIDIA Corporation
- Maintains very low debt (D/E 0.13), strong interest coverage (341x), indicating financial flexibility.
KLA Corporation
- Higher leverage (D/E 1.3) with moderate interest coverage (16x) raises financial risk during downturns.
3. Stock Volatility
NVIDIA Corporation
- High beta (2.31) signals significant price swings, increasing risk for volatility-sensitive investors.
KLA Corporation
- Moderate beta (1.44) suggests less price volatility and steadier stock performance.
4. Regulatory & Legal
NVIDIA Corporation
- Exposure to export controls and antitrust scrutiny, especially in U.S.-China tech rivalry.
KLA Corporation
- Regulatory risks focused on export compliance and industry standards, but less politically sensitive.
5. Supply Chain & Operations
NVIDIA Corporation
- Relies on advanced foundries and global supply chains vulnerable to geopolitical disruptions.
KLA Corporation
- Dependent on semiconductor fabs’ capital spending cycles, which are cyclical and volatile.
6. ESG & Climate Transition
NVIDIA Corporation
- Faces pressure to reduce carbon footprint in data centers and manufacturing partners.
KLA Corporation
- Must align with stringent environmental standards in manufacturing and chemical usage.
7. Geopolitical Exposure
NVIDIA Corporation
- Significant exposure to U.S.-China tensions impacting sales, supply, and technology transfer.
KLA Corporation
- Also exposed but less directly reliant on Chinese market; more diversified global footprint.
Which company shows a better risk-adjusted profile?
NVIDIA’s highest risk is its market volatility and geopolitical exposure, while KLA’s is its elevated leverage increasing financial risk. I judge KLA to have a better risk-adjusted profile due to lower stock volatility and strong operational niche, despite higher debt. NVIDIA’s beta of 2.31 versus KLA’s 1.44 underlines this disparity.
Final Verdict: Which stock to choose?
NVIDIA’s superpower lies in its unmatched ability to generate explosive growth while maintaining a wide economic moat. Its soaring ROIC, far above WACC, signals durable competitive advantage. The point of vigilance is its sky-high valuation multiples, which could pressure returns if growth slows. It fits best within aggressive growth portfolios chasing innovation leaders.
KLA’s strategic moat is rooted in its steady recurring revenue and operational resilience. Its balance sheet shows more conservative leverage than NVIDIA, offering a safety cushion amid market volatility. While growth is more moderate, KLA’s consistent profitability and strong cash flow suit a GARP (Growth at a Reasonable Price) investor seeking stability with upside.
If you prioritize rapid innovation and high return on invested capital, NVIDIA outshines as the compelling choice due to its dominant market position and growth trajectory. However, if you seek better stability and a more balanced risk profile, KLA offers superior financial prudence and a durable competitive advantage at a more reasonable valuation.
Disclaimer: Investment carries a risk of loss of initial capital. The past performance is not a reliable indicator of future results. Be sure to understand risks before making an investment decision.
Go Further
I encourage you to read the complete analyses of NVIDIA Corporation and KLA Corporation to enhance your investment decisions: