Home > Comparison > Technology > KLAC vs NVEC
The strategic rivalry between KLA Corporation and NVE Corporation shapes the semiconductor industry’s innovation frontier. KLA, a capital-intensive leader in process control and yield management, contrasts sharply with NVE, a nimble developer of advanced spintronic sensors. This head-to-head pits scale and diversified solutions against cutting-edge nanotechnology. This analysis will clarify which corporate trajectory delivers superior risk-adjusted returns for a diversified portfolio navigating technology’s evolving landscape.
Table of contents
Companies Overview
KLA Corporation and NVE Corporation hold pivotal roles in the semiconductor industry, shaping technological advances globally.
KLA Corporation: Semiconductor Process Control Leader
KLA Corporation specializes in process control and yield management for semiconductor manufacturing. Its core revenue stems from wafer inspection, metrology, and process-enabling solutions across four segments. In 2026, KLA emphasizes expanding integrated circuit manufacturing technologies and advanced semiconductor packaging inspection to maintain its competitive edge.
NVE Corporation: Spintronics Innovator
NVE Corporation focuses on spintronic sensor and coupler products, leveraging electron spin for data acquisition and transmission. Its revenues primarily come from factory automation sensors and medical device applications. In 2026, NVE prioritizes developing custom sensors and expanding its industrial IoT presence through innovative spintronic technologies.
Strategic Collision: Similarities & Divergences
KLA pursues a broad semiconductor process control ecosystem, while NVE champions niche spintronics innovation. Their main battleground centers on semiconductor component sensing and data transmission technologies. Investors face a contrast between KLA’s scale-driven market dominance and NVE’s specialized, high-tech growth profile.
Income Statement Comparison
This data dissects the core profitability and scalability of both corporate engines to reveal who dominates the bottom line:
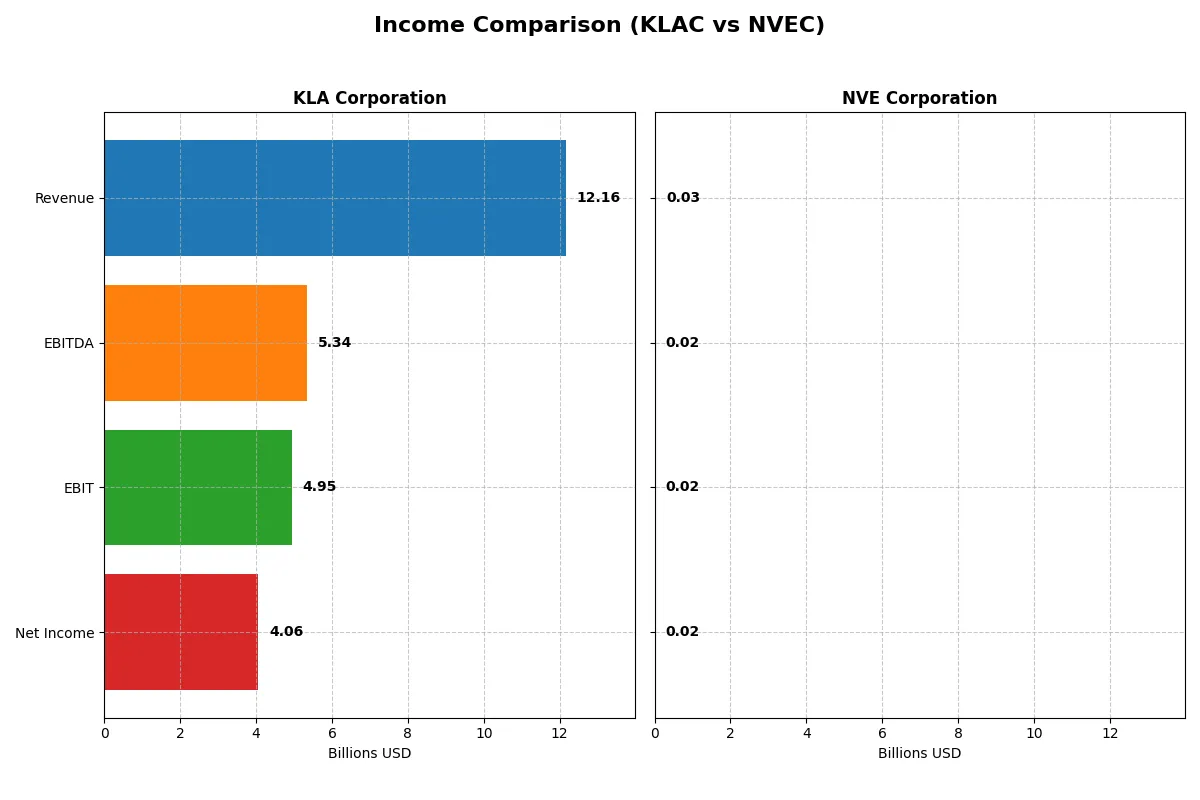
| Metric | KLA Corporation (KLAC) | NVE Corporation (NVEC) |
|---|---|---|
| Revenue | 12.2B | 25.9M |
| Cost of Revenue | 4.6B | 4.2M |
| Operating Expenses | 2.3B | 5.6M |
| Gross Profit | 7.6B | 21.6M |
| EBITDA | 5.3B | 16.3M |
| EBIT | 4.9B | 16.0M |
| Interest Expense | 302M | 0 |
| Net Income | 4.1B | 15.1M |
| EPS | 30.53 | 3.12 |
| Fiscal Year | 2025 | 2025 |
Income Statement Analysis: The Bottom-Line Duel
This income statement comparison unveils which company operates with greater financial efficiency and profit-generation prowess.
KLA Corporation Analysis
KLA’s revenue surged 24% to $12.2B in 2025, while net income rose 47% to $4.06B. The company maintains strong margin health, with a gross margin of 62% and net margin over 33%. Its operating leverage is evident as EBIT jumped 41%, signaling robust momentum and efficient cost management.
NVE Corporation Analysis
NVE’s revenue declined 13% to $25.9M in 2025, with net income falling 12% to $15.1M. Despite top-line pressure, margins remain exceptional—gross margin at 84% and net margin above 58%. However, declining revenue and EPS highlight challenges in sustaining growth and operational momentum.
Margin Supremacy vs. Growth Momentum
KLA outpaces with strong revenue and net income growth, backed by solid margin expansion and operational efficiency. NVE leads in margin percentages but faces revenue contraction. For investors, KLA’s growth profile offers greater scalability potential, while NVE’s margin strength suits those prioritizing profitability over expansion.
Financial Ratios Comparison
These vital ratios act as a diagnostic tool to expose the underlying fiscal health, valuation premiums, and capital efficiency for these companies:
| Ratios | KLA Corporation (KLAC) | NVE Corporation (NVEC) |
|---|---|---|
| ROE | 86.6% | 24.2% |
| ROIC | 38.0% | 21.1% |
| P/E | 29.3 | 20.5 |
| P/B | 25.4 | 4.95 |
| Current Ratio | 2.62 | 28.4 |
| Quick Ratio | 1.83 | 22.0 |
| D/E (Debt-to-Equity) | 1.30 | 0.015 |
| Debt-to-Assets | 37.9% | 1.43% |
| Interest Coverage | 17.3 | 0 |
| Asset Turnover | 0.76 | 0.40 |
| Fixed Asset Turnover | 9.70 | 8.91 |
| Payout Ratio | 22.3% | 128.4% |
| Dividend Yield | 0.76% | 6.28% |
| Fiscal Year | 2025 | 2025 |
Efficiency & Valuation Duel: The Vital Signs
Financial ratios act as a company’s DNA, exposing hidden risks and operational strengths that define investment potential.
KLA Corporation
KLA delivers exceptional profitability with an 86.6% ROE and a strong 33.4% net margin, signaling operational excellence. However, its valuation appears stretched, trading at a high P/E of 29.3 and P/B of 25.4. The company rewards shareholders modestly with a 0.76% dividend yield, focusing on reinvestment in R&D for sustained growth.
NVE Corporation
NVE boasts a remarkable 58.2% net margin but a more moderate 24.2% ROE, reflecting efficient cost management. Its valuation is reasonable, with a P/E of 20.5 and a P/B of 4.95, though the high current ratio signals excess liquidity. NVE offers a healthy 6.3% dividend yield, balancing returns with stable capital discipline.
Profitability Powerhouse vs. Balanced Value
KLA’s outstanding returns come at a premium valuation and moderate shareholder yield, while NVE offers strong margins with more appealing valuation and dividend income. Investors seeking growth with operational efficiency may prefer KLA, whereas those favoring income and valuation balance might lean toward NVE.
Which one offers the Superior Shareholder Reward?
I see KLA Corporation pays a modest dividend yield near 0.76% with a sustainable payout ratio around 22%. Its free cash flow comfortably covers dividends, supporting steady payouts. Buybacks appear consistent but less aggressive. NVE Corporation delivers a robust 6.28% dividend yield, but payout ratios exceed 100%, signaling risk. NVE’s minimal debt and strong cash flow underpin aggressive buybacks, enhancing total returns. However, its high payout ratio raises sustainability concerns. I conclude KLA offers a more balanced and sustainable shareholder reward profile in 2026, while NVE’s higher yield carries elevated risk.
Comparative Score Analysis: The Strategic Profile
The radar chart reveals the fundamental DNA and trade-offs of KLA Corporation and NVE Corporation, highlighting their financial strengths and valuation nuances:
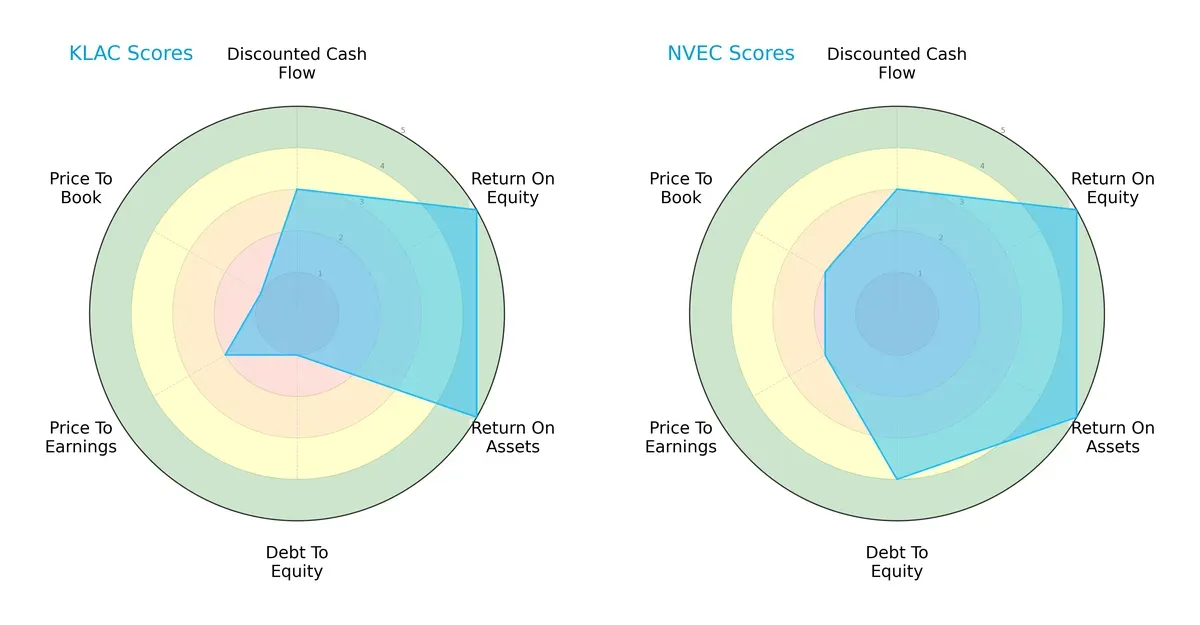
KLA and NVE both demonstrate strong profitability with top-tier ROE and ROA scores at 5. NVE holds an edge with a more balanced financial structure, scoring 4 on debt-to-equity versus KLA’s weak 1. However, KLA’s valuation metrics lag behind, with very unfavorable P/B and low P/E scores, suggesting possible overvaluation or market skepticism. NVE relies less on leverage and shows a healthier valuation profile, indicating a more stable investment stance.
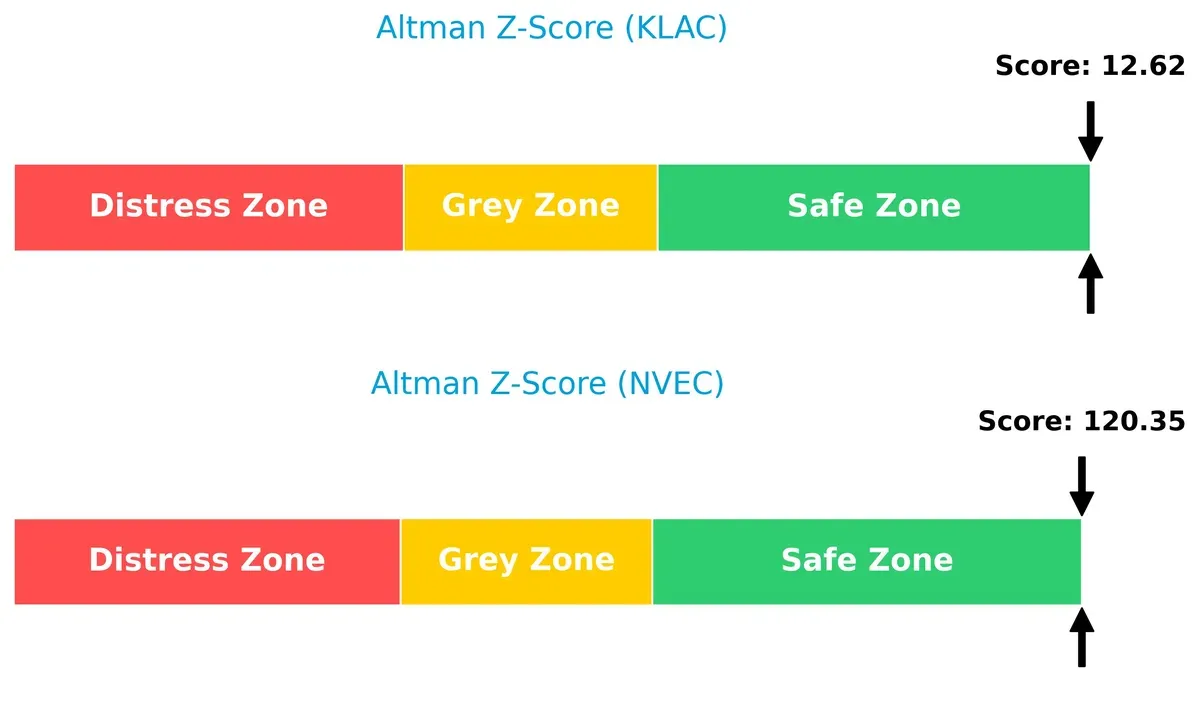
Bankruptcy Risk: Solvency Showdown
NVE’s Altman Z-Score of 120 dramatically outperforms KLA’s 12.6, both safely in the “safe zone,” confirming robust solvency and negligible bankruptcy risk in this cycle:
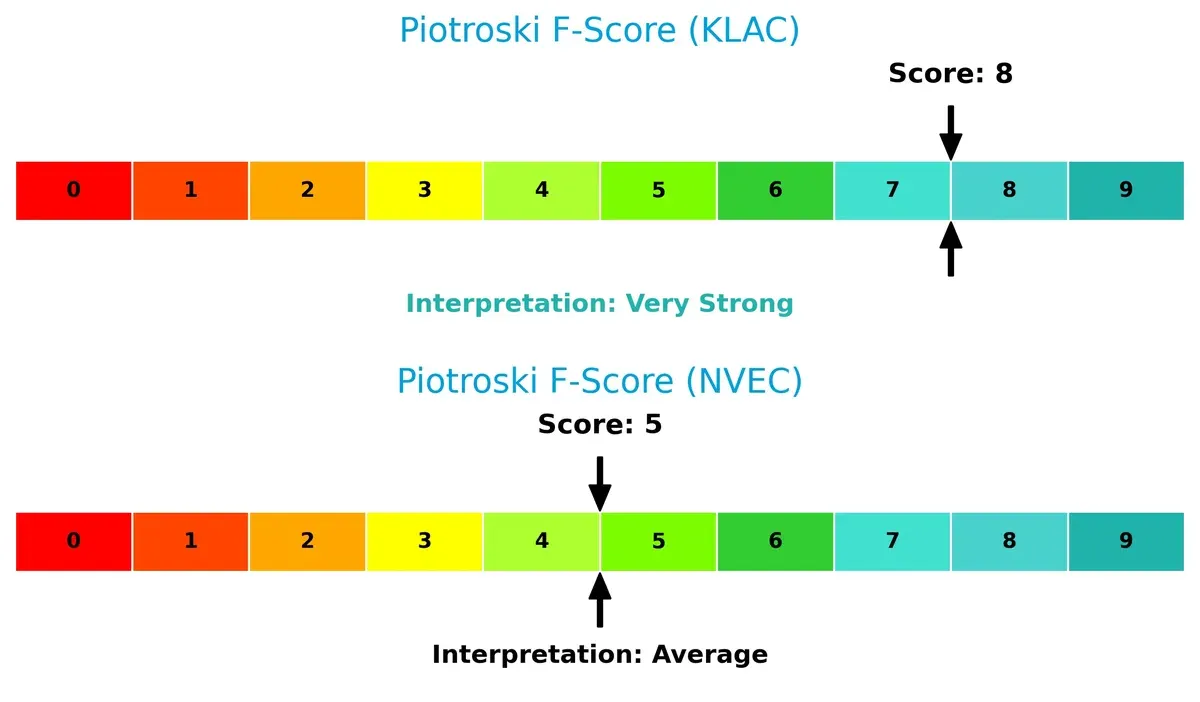
Financial Health: Quality of Operations
KLA scores an impressive 8 on the Piotroski F-Score, signaling very strong financial health. NVE’s 5 reflects average operational quality, raising caution about internal metrics:
How are the two companies positioned?
This section dissects KLAC and NVEC’s operational DNA by comparing their revenue distribution and internal strengths and weaknesses. The goal is to confront their economic moats to identify which model offers the most resilient, sustainable competitive advantage today.
Revenue Segmentation: The Strategic Mix
This visual comparison dissects how KLA Corporation and NVE Corporation diversify their income streams and where their primary sector bets lie:
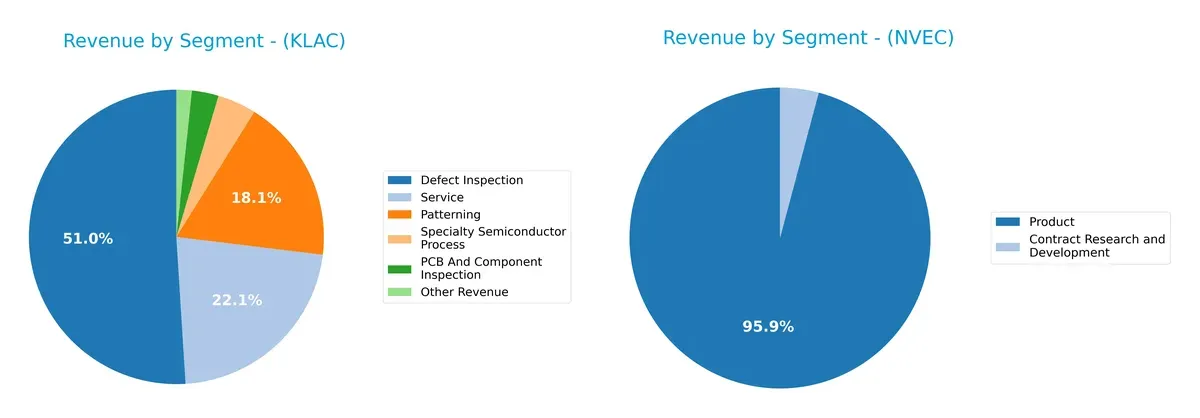
KLA Corporation anchors its revenue in Defect Inspection at $6.2B, dwarfing other segments like Service ($2.7B) and Patterning ($2.2B). This concentration signals strong ecosystem lock-in but exposes KLA to semiconductor cycle risks. NVE Corporation pivots almost entirely on Product sales at $26M, with minimal Contract Research and Development at $1.1M, reflecting a narrow but focused business model. KLA’s diverse segments contrast with NVE’s concentrated revenue, highlighting differing strategic bets and risk profiles.
Strengths and Weaknesses Comparison
This table compares the Strengths and Weaknesses of KLA Corporation and NVE Corporation:
KLA Corporation Strengths
- Diverse semiconductor process segments including Defect Inspection and Patterning
- Strong global presence, especially in China and Taiwan
- High profitability with net margin of 33.41% and ROIC of 37.97%
- Solid liquidity ratios with current ratio 2.62 and quick ratio 1.83
- Strong fixed asset turnover at 9.7 indicates efficient asset use
NVE Corporation Strengths
- High net margin at 58.22% and favorable ROE of 24.19%
- Very low debt-to-equity of 0.01 and debt-to-assets 1.43% showing strong balance sheet
- Favorable interest coverage with infinite ratio
- Favorable fixed asset turnover at 8.91
- Solid product focus with consistent R&D investment
KLA Corporation Weaknesses
- High valuation multiples with PE 29.34 and PB 25.39, potentially overvalued
- Elevated debt-to-equity ratio of 1.3 and moderate debt-to-assets at 37.89%
- Dividend yield low at 0.76%, less attractive for income investors
- WACC higher than ROIC at 10.42%, indicating cost of capital pressure
- Asset turnover moderate at 0.76
NVE Corporation Weaknesses
- Extremely high current ratio at 28.4 suggests inefficient capital use
- Lower asset turnover at 0.4 indicates less efficient revenue generation from assets
- PB ratio unfavorable at 4.95, valuation risk present
- Dividend yield moderate at 6.28%, but valuation concerns remain
- PE ratio neutral at 20.46, not clearly undervalued
KLA excels in diversified semiconductor segments and strong global footprint but carries valuation and leverage risks. NVE shows superior profitability and balance sheet strength but faces concerns over capital efficiency and valuation metrics. Both companies reflect distinct strategic profiles requiring attentive risk management.
The Moat Duel: Analyzing Competitive Defensibility
A structural moat is the sole barrier shielding long-term profits from relentless competitive pressure and market disruption:
KLA Corporation: Precision Process Control Moat
KLA dominates with high switching costs in semiconductor process control, reflected by a robust 27.5% ROIC premium over WACC and margin stability. Its expanding footprint in Asia and advanced metrology deepen this moat in 2026.
NVE Corporation: Niche Spintronics Innovation Moat
NVE leverages specialized intangible assets in spintronics, delivering a 11.7% ROIC premium over WACC, yet its smaller scale limits reach versus KLA. Growth hinges on IoT market expansion and medical sensor adoption next year.
Precision Process Control vs. Spintronics Innovation
KLA’s wider moat combines scale, switching costs, and global diversification, outpacing NVE’s narrower niche advantage. KLA stands better equipped to defend market share amid semiconductor industry cycles and geopolitical risks.
Which stock offers better returns?
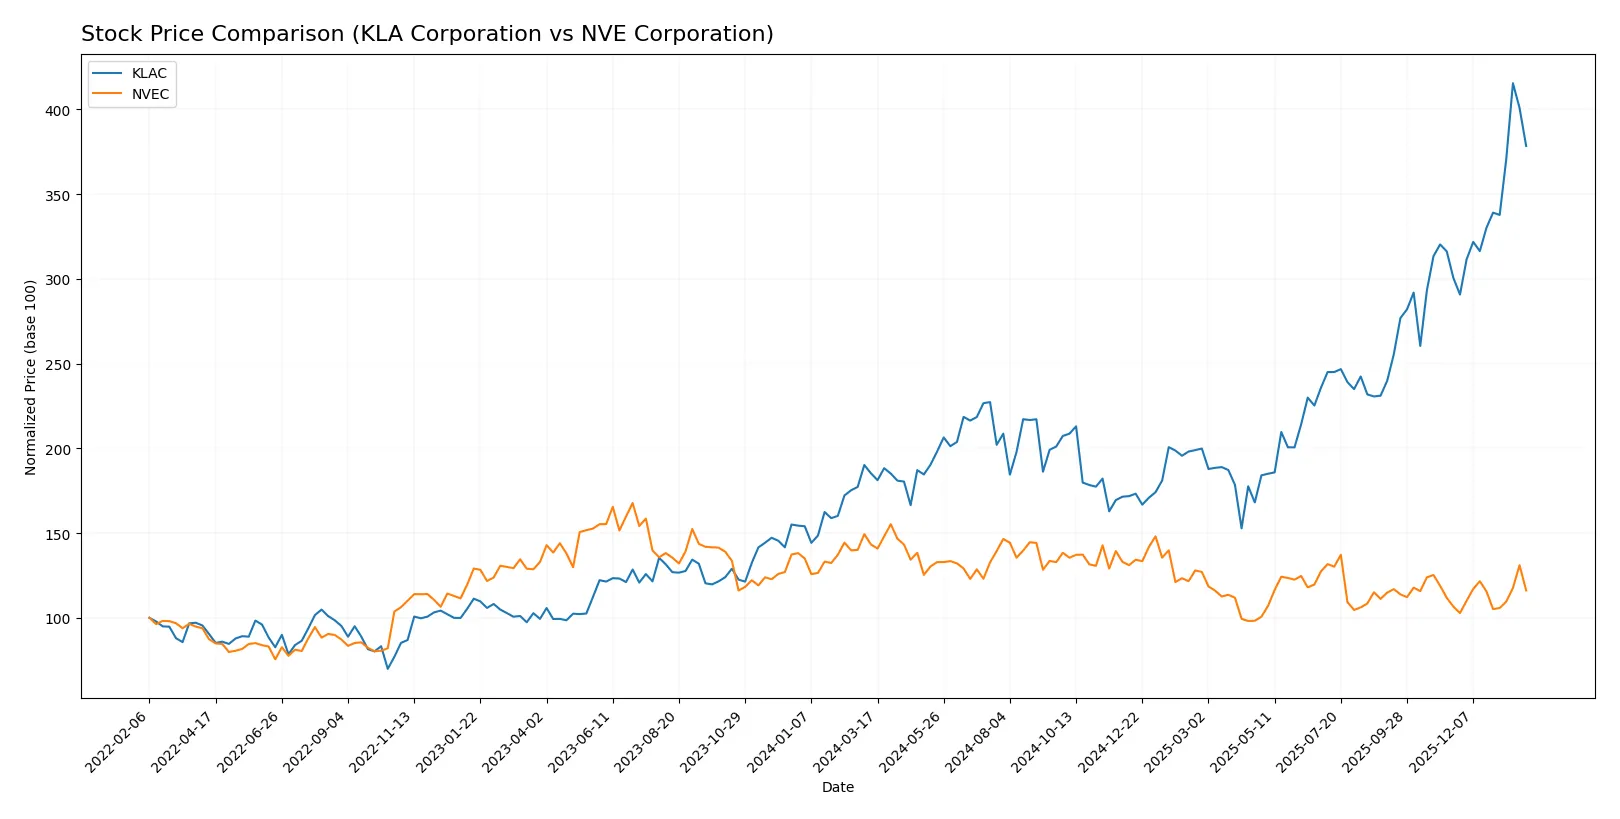
Over the past year, KLA Corporation’s stock surged strongly, while NVE Corporation faced a notable decline, reflecting contrasting market dynamics for these two semiconductor firms.
Trend Comparison
KLA Corporation’s stock gained 104.22% over 12 months, showing a bullish trend with accelerating momentum and high volatility between 577 and 1568.
NVE Corporation’s stock dropped 18.93% over the same period, marking a bearish trend despite acceleration, with lower volatility and price ranging from 57 to 90.
KLA’s performance clearly outpaced NVE’s, delivering the highest market return amid stronger price appreciation and volume growth.
Target Prices
The consensus target price for KLA Corporation reflects a moderately bullish outlook.
| Company | Target Low | Target High | Consensus |
|---|---|---|---|
| KLA Corporation | 1400 | 1900 | 1672.25 |
Analysts expect KLA’s stock to appreciate about 17% from the current 1427.94 price, signaling confidence despite recent volatility. No verified target price data is available for NVE Corporation.

Don’t Let Luck Decide Your Entry Point
Optimize your entry points with our advanced ProRealTime indicators. You’ll get efficient buy signals with precise price targets for maximum performance. Start outperforming now!
How do institutions grade them?
The following summarizes current institutional grading for both companies:
KLA Corporation Grades
The table below presents recent grades from top-tier financial institutions for KLA Corporation.
| Grading Company | Action | New Grade | Date |
|---|---|---|---|
| Oppenheimer | Maintain | Outperform | 2026-01-30 |
| Barclays | Maintain | Overweight | 2026-01-30 |
| Cantor Fitzgerald | Maintain | Overweight | 2026-01-30 |
| Jefferies | Maintain | Buy | 2026-01-30 |
| Stifel | Maintain | Buy | 2026-01-30 |
| Wells Fargo | Maintain | Overweight | 2026-01-30 |
| Needham | Maintain | Buy | 2026-01-30 |
| RBC Capital | Maintain | Sector Perform | 2026-01-30 |
| Deutsche Bank | Maintain | Hold | 2026-01-21 |
| Needham | Maintain | Buy | 2026-01-20 |
Which company has the best grades?
KLA Corporation holds multiple Buy and Overweight ratings, showing broad institutional confidence. NVE Corporation has no available institutional grades, limiting investor insight.
Risks specific to each company
The following categories identify critical pressure points and systemic threats facing KLA Corporation and NVE Corporation in the 2026 market environment:
1. Market & Competition
KLA Corporation
- Dominates semiconductor process control with strong market share but faces intense competition and high innovation demands.
NVE Corporation
- Operates in niche spintronics market with less direct competition but limited scale and slower adoption risk.
2. Capital Structure & Debt
KLA Corporation
- Leverages debt moderately with D/E at 1.3; interest coverage is strong but debt level raises financial risk.
NVE Corporation
- Maintains minimal debt (D/E 0.01), showing conservative leverage and low financial risk.
3. Stock Volatility
KLA Corporation
- Exhibits higher beta (1.44) and significant recent price decline (-15.24%), indicating elevated volatility and market sensitivity.
NVE Corporation
- Shows lower beta (1.20) and smaller recent drop (-6.33%), reflecting more stable stock behavior.
4. Regulatory & Legal
KLA Corporation
- Faces complex global regulatory landscape due to large scale and varied product lines in semiconductors.
NVE Corporation
- Smaller scale limits regulatory exposure but may lack resources for rapid compliance adaptation.
5. Supply Chain & Operations
KLA Corporation
- Large, global supply chain vulnerable to semiconductor industry cyclicality and component shortages.
NVE Corporation
- Lean operations with fewer employees reduce complexity but increase dependency on key suppliers.
6. ESG & Climate Transition
KLA Corporation
- Under pressure to meet aggressive climate goals typical in large tech firms; ESG compliance is costly but essential.
NVE Corporation
- Smaller footprint eases ESG challenges but may have less influence on supplier sustainability practices.
7. Geopolitical Exposure
KLA Corporation
- Significant global footprint exposes it to US-China tensions and trade restrictions impacting semiconductor supply chains.
NVE Corporation
- Limited international footprint reduces geopolitical risks but constrains growth opportunities abroad.
Which company shows a better risk-adjusted profile?
NVE Corporation exhibits a superior risk-adjusted profile driven by minimal debt, lower stock volatility, and strong profitability margins despite its smaller scale. KLA’s higher leverage and broader geopolitical exposure increase its risk despite market leadership. Notably, KLA’s elevated debt-to-equity score (unfavorable) and recent share price drop highlight financial and market vulnerability. In contrast, NVE balances high net margin and robust Altman Z-Score, signaling financial resilience and lower default risk.
Final Verdict: Which stock to choose?
KLA Corporation’s superpower lies in its exceptional capital efficiency and robust profitability, demonstrated by a very favorable moat with consistently rising ROIC well above its cost of capital. Its point of vigilance is the elevated debt-to-equity ratio, which could pressure financial flexibility. KLAC suits portfolios targeting aggressive growth with a tolerance for leverage risks.
NVE Corporation’s strategic moat centers on its pristine balance sheet and remarkable safety profile, marked by minimal debt and strong liquidity that outshines KLAC’s leverage. Though its revenue growth has faced headwinds recently, NVEC’s high net margin and stable cash flows fit well within a GARP (Growth at a Reasonable Price) portfolio seeking stability with growth potential.
If you prioritize high-return, growth-oriented exposure and can accept financial leverage, KLAC is the compelling choice due to its durable competitive advantage and accelerating momentum. However, if you seek a safer, more conservative growth scenario with solid financial health, NVEC offers better stability and a cleaner balance sheet, despite recent softness in earnings growth.
Disclaimer: Investment carries a risk of loss of initial capital. The past performance is not a reliable indicator of future results. Be sure to understand risks before making an investment decision.
Go Further
I encourage you to read the complete analyses of KLA Corporation and NVE Corporation to enhance your investment decisions: