Home > Comparison > Technology > KLAC vs NVMI
The strategic rivalry between KLA Corporation and Nova Ltd. shapes the semiconductor process control landscape. KLA, a capital-intensive technology leader, commands scale with integrated manufacturing and inspection solutions. Nova Ltd. operates as a specialized, agile innovator in semiconductor metrology. This head-to-head contrasts scale versus specialization in a sector driven by precision and yield enhancement. This analysis will identify which corporate path offers superior risk-adjusted returns for a diversified portfolio.
Table of contents
Companies Overview
KLA Corporation and Nova Ltd. stand as influential players in the semiconductor process control industry.
KLA Corporation: Industry-Leading Process Control Innovator
KLA Corporation dominates the semiconductor process control market with integrated inspection and metrology solutions. Its revenue hinges on wafer inspection, defect analysis, and process-enabling technologies that boost manufacturing yield worldwide. In 2026, KLA sharpens its focus on advanced semiconductor packaging and PCB inspection to maintain technological leadership and customer lock-in.
Nova Ltd.: Specialized Metrology Systems Provider
Nova Ltd. specializes in dimensional and chemical metrology platforms tailored for semiconductor manufacturing steps like lithography and etch. Its core revenue comes from supplying process control systems to logic, memory, and foundry sectors globally. The company concentrates on expanding its metrology capabilities and penetrating advanced packaging markets in 2026.
Strategic Collision: Similarities & Divergences
Both firms emphasize process control precision but diverge in scale and scope—KLA favors a broad portfolio with integrated solutions, while Nova pursues niche metrology specialization. Their primary battleground is advanced semiconductor packaging where yield improvement is critical. KLA offers a diversified, market-dominant profile; Nova presents a focused, high-growth but more concentrated investment proposition.
Income Statement Comparison
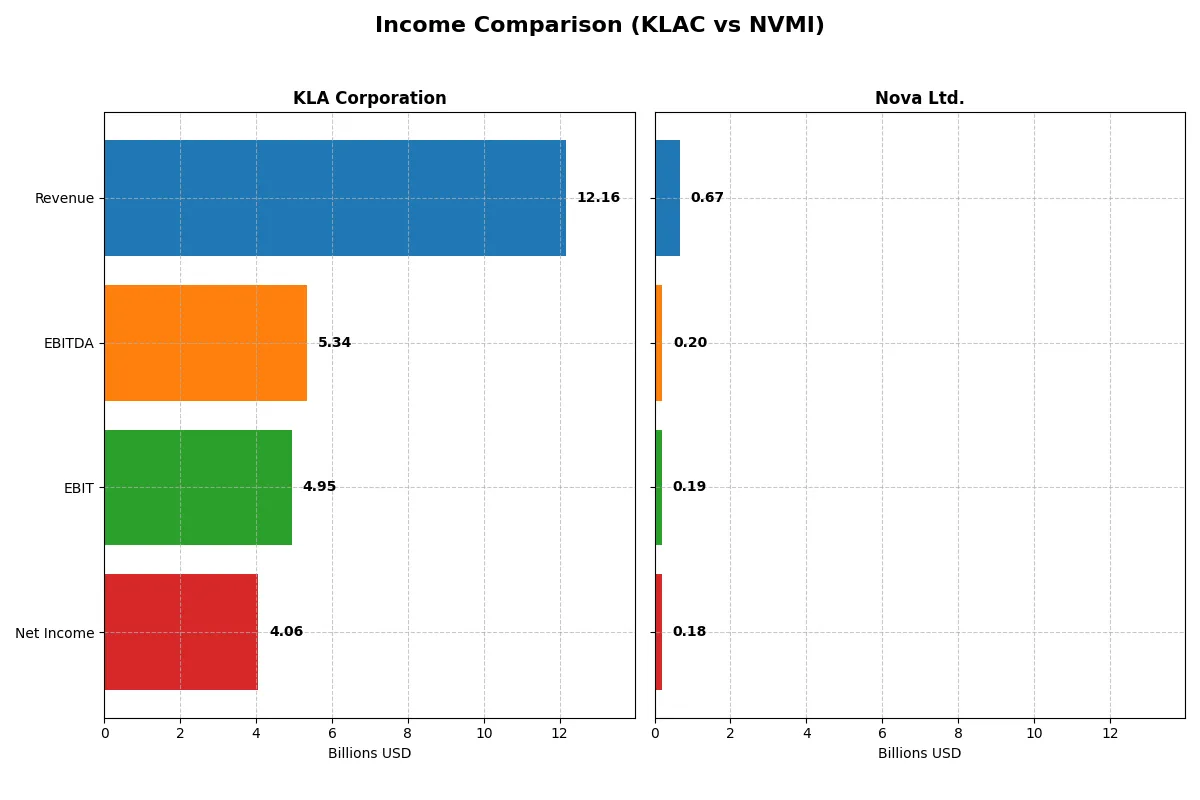
This data dissects the core profitability and scalability of both corporate engines to reveal who dominates the bottom line:
| Metric | KLA Corporation (KLAC) | Nova Ltd. (NVMI) |
|---|---|---|
| Revenue | 12.2B | 672M |
| Cost of Revenue | 4.6B | 285M |
| Operating Expenses | 2.3B | 200M |
| Gross Profit | 7.6B | 387M |
| EBITDA | 5.3B | 205M |
| EBIT | 4.9B | 188M |
| Interest Expense | 302M | 1.6M |
| Net Income | 4.1B | 184.9M |
| EPS | 30.53 | 6.31 |
| Fiscal Year | 2025 | 2024 |
Income Statement Analysis: The Bottom-Line Duel
The following income statement comparison reveals which company operates with superior efficiency and growth momentum in their core business engines.
KLA Corporation Analysis
KLA’s revenue soared from 6.9B in 2021 to 12.2B in 2025, nearly doubling its scale. Net income followed suit, rising from 2.1B to 4.1B, reflecting strong profit expansion. Gross margin holds firm at 62.3%, and net margin improved to 33.4%, signaling excellent cost control and operational leverage in 2025.
Nova Ltd. Analysis
Nova’s revenue climbed impressively from 269M in 2020 to 672M in 2024, showing rapid growth. Net income also surged from 48M to 185M. Although gross margin at 57.6% and net margin at 27.3% are healthy, Nova’s smaller scale and slightly lower margins indicate a leaner but less dominant profitability profile compared to KLA.
Scale Dominance vs. High-Growth Agility
KLA commands a larger revenue base and superior margins, delivering robust profit growth and operational efficiency. Nova impresses with faster relative revenue and net income growth but lacks KLA’s scale and margin strength. Investors seeking steady, high-quality earnings may prefer KLA’s established dominance, while growth-oriented profiles might find Nova’s agility more appealing.
Financial Ratios Comparison
These vital ratios act as a diagnostic tool to expose the underlying fiscal health, valuation premiums, and capital efficiency of the companies compared below:
| Ratios | KLA Corporation (KLAC) | Nova Ltd. (NVMI) |
|---|---|---|
| ROE | 86.6% | 19.8% |
| ROIC | 38.0% | 13.4% |
| P/E | 29.3 | 31.2 |
| P/B | 25.4 | 6.2 |
| Current Ratio | 2.62 | 2.32 |
| Quick Ratio | 1.83 | 1.92 |
| D/E | 1.30 | 0.25 |
| Debt-to-Assets | 37.9% | 17.0% |
| Interest Coverage | 17.3 | 116.2 |
| Asset Turnover | 0.76 | 0.48 |
| Fixed Asset Turnover | 9.70 | 5.06 |
| Payout ratio | 22.3% | 0% |
| Dividend yield | 0.76% | 0% |
| Fiscal Year | 2025 | 2024 |
Efficiency & Valuation Duel: The Vital Signs
Ratios serve as a company’s DNA, uncovering hidden risks and operational strengths beyond surface-level financials.
KLA Corporation
KLA dominates with an exceptional ROE of 86.6% and a strong net margin of 33.4%, signaling superior profitability. However, its P/E of 29.3 and P/B of 25.4 indicate a stretched valuation. The company returns value through modest dividends, while reinvesting heavily in R&D (11.1% of revenue) to sustain growth.
Nova Ltd.
Nova posts a solid ROE of 19.8% and a net margin of 27.3%, reflecting efficient operations but lower profitability than KLA. Its valuation appears expensive, with a P/E of 31.2 and a P/B of 6.2. Nova pays no dividends, opting instead for reinvestment into R&D (16.4% of revenue), fueling future expansion and innovation.
Premium Valuation vs. Operational Safety
KLA offers higher profitability and operational efficiency but at a premium valuation, exposing investors to valuation risk. Nova provides a more balanced risk profile with solid fundamentals and a favorable debt position. Growth-focused investors may prefer Nova’s reinvestment strategy, while income seekers might lean toward KLA’s dividend presence.
Which one offers the Superior Shareholder Reward?
I see KLA Corporation offers a modest dividend yield around 0.76% with a 22% payout ratio, well-covered by robust free cash flow (FCF). KLA also runs aggressive buybacks, enhancing shareholder returns. Nova Ltd. pays no dividends but reinvests cash into growth and acquisitions, supported by solid FCF and efficient capital allocation. However, KLA’s balanced dividend plus buybacks create a more sustainable, immediate shareholder reward. In 2026, I favor KLA for its superior total return profile, blending income and capital appreciation more effectively than Nova’s purely reinvestment strategy.
Comparative Score Analysis: The Strategic Profile
The radar chart reveals the fundamental DNA and trade-offs of KLA Corporation and Nova Ltd., highlighting their financial strengths and valuation nuances:
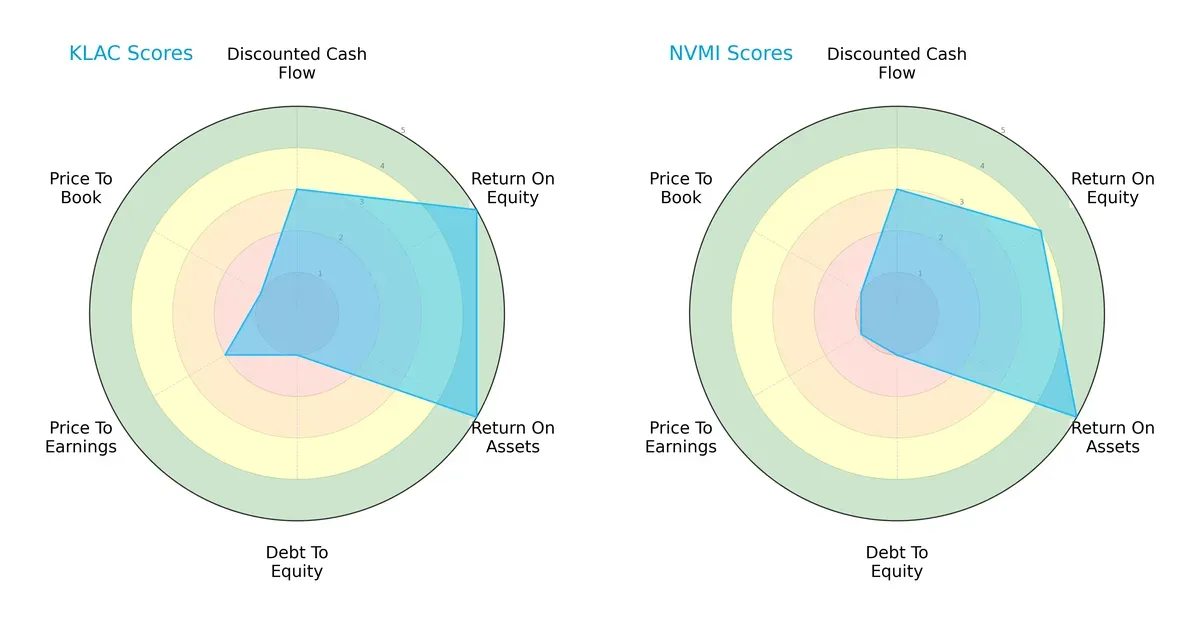
KLA shows superior efficiency with top scores in ROE (5) and ROA (5), signaling excellent asset and equity utilization. Nova matches KLA in asset efficiency but lags slightly in ROE (4). Both firms carry heavy debt (score 1), marking a shared financial risk. KLA holds a moderate valuation edge with better P/E (2) and P/B (1) scores compared to Nova’s very unfavorable valuations (both 1). Overall, KLA’s profile is more balanced, while Nova relies heavily on asset efficiency amid valuation challenges.
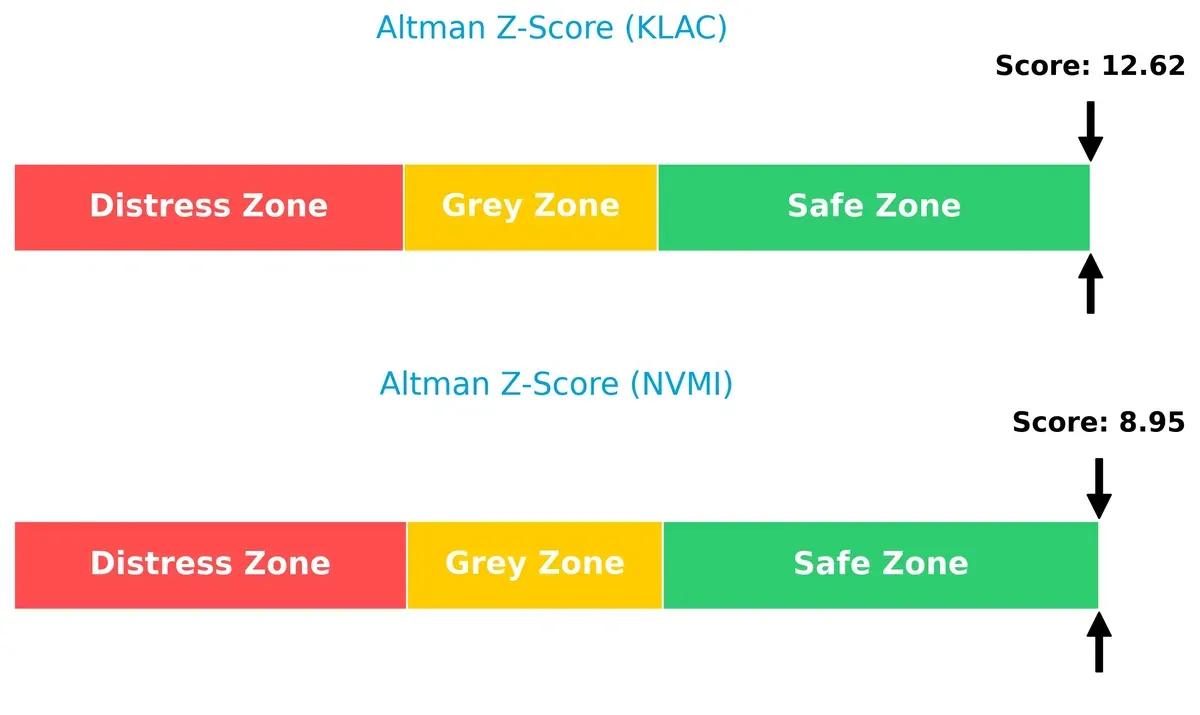
Bankruptcy Risk: Solvency Showdown
KLA’s Altman Z-Score of 12.6 versus Nova’s 8.95 places both firmly in the safe zone, indicating robust long-term solvency and low bankruptcy risk in this cycle:
Financial Health: Quality of Operations
KLA scores an 8 on the Piotroski F-Score, indicating very strong financial health, while Nova’s 7 reflects strong but slightly weaker internal metrics:
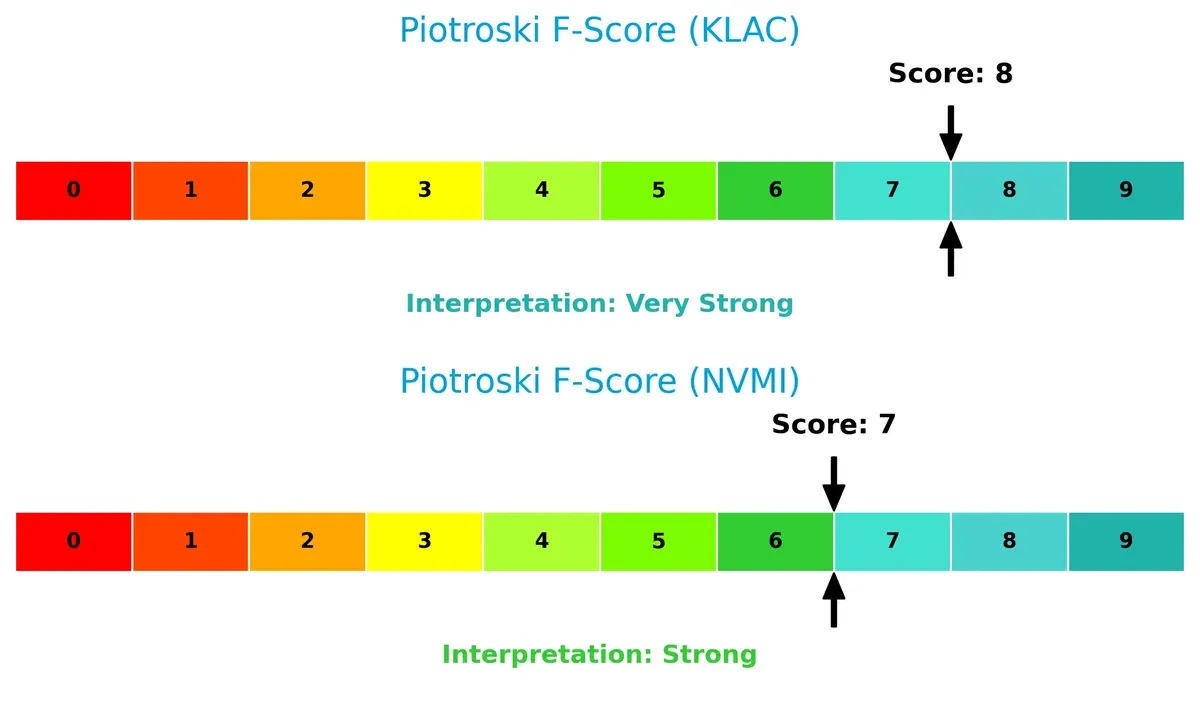
KLA’s higher Piotroski score suggests superior operational quality and financial discipline, reducing red flags compared to Nova.
How are the two companies positioned?
This section dissects the operational DNA of KLAC and NVMI by comparing their revenue distribution by segment alongside their internal strengths and weaknesses. The goal is to confront their economic moats and identify which business model offers the most resilient, sustainable competitive advantage in today’s semiconductor landscape.
Revenue Segmentation: The Strategic Mix
This comparison dissects how KLA Corporation and Nova Ltd. diversify their income streams and reveals where their primary sector bets lie:
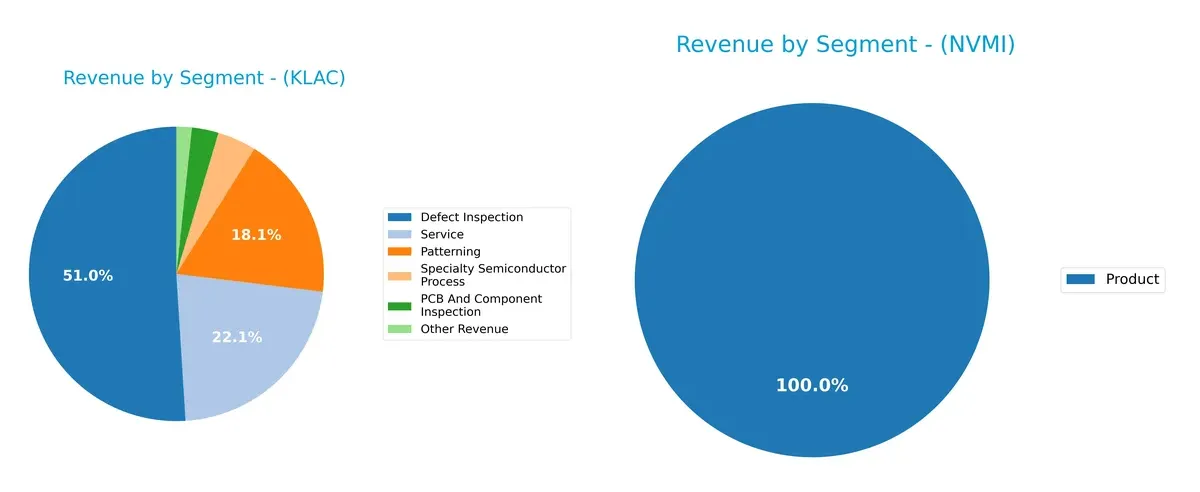
KLA Corporation exhibits a broad revenue mix, with Defect Inspection anchoring at $6.2B and meaningful contributions from Service ($2.7B) and Patterning ($2.2B). This diversification reduces concentration risk and supports ecosystem lock-in. Nova Ltd. relies exclusively on a single segment, Product, with $538M in 2024, exposing it to higher volatility. KLA’s multi-segment dominance signals infrastructure strength, while Nova’s narrow focus demands caution on sector cyclicality.
Strengths and Weaknesses Comparison
This table compares the Strengths and Weaknesses of KLA Corporation and Nova Ltd.:
KLA Corporation Strengths
- High net margin at 33.41%
- ROE of 86.56% reflects strong profitability
- ROIC at 37.97% well above WACC
- Solid liquidity with current ratio 2.62
- Diverse revenue streams across six segments
- Extensive global presence including China and Taiwan
Nova Ltd. Strengths
- Favorable net margin at 27.33%
- ROE at 19.81% and ROIC 13.39% positive
- Excellent debt management with low D/E 0.25
- Strong interest coverage at 116.2
- Favorable debt-to-assets ratio at 16.98%
- Product revenue growing, indicating focused innovation
KLA Corporation Weaknesses
- High P/E (29.34) and P/B (25.39) indicate expensive valuation
- Debt-to-equity ratio at 1.3 is elevated
- WACC at 10.42% higher than ideal
- Dividend yield low at 0.76%
- Moderate asset turnover (0.76) limits efficiency
- Some reliance on volatile geographic regions
Nova Ltd. Weaknesses
- Elevated P/E (31.2) and P/B (6.18) valuations
- WACC high at 12.29%
- Asset turnover low at 0.48, suggesting lower operational efficiency
- No dividend yield available
- Limited geographic diversification reported
- Smaller revenue base with single product focus
KLA stands out with superior profitability metrics and broad diversification but carries valuation and leverage risks. Nova shows sound financial health and low leverage but faces challenges in efficiency and geographic reach. Both companies reflect distinct strategic profiles impacting their risk-return dynamics.
The Moat Duel: Analyzing Competitive Defensibility
A structural moat is the only reliable shield protecting long-term profits from relentless competitive erosion. Here’s how KLA Corporation and Nova Ltd. defend their turf:
KLA Corporation: Metrology Mastery with Durable Value Creation
KLA’s moat stems from intangible assets and advanced process control technology, driving a very favorable ROIC 27.5% above WACC. Its margin stability and 42.5% ROIC growth showcase efficient capital use. Expansion in PCB and display inspection deepens its technological edge in 2026.
Nova Ltd.: Growth-Stage Innovation with Emerging Profitability
Nova relies on specialized metrology platforms, showing a weaker moat with ROIC just 1.1% above WACC. Despite shedding value currently, its 70% ROIC growth indicates rising efficiency. Opportunities in advanced packaging and electrochemical plating could disrupt markets if execution scales by 2026.
Durable Tech Moat vs. Emerging Growth Potential
KLA possesses a wider, deeper moat with strong value creation and stable profitability. Nova’s promising ROIC trend signals potential but lacks the established economic moat to firmly defend market share against KLA’s entrenched position.
Which stock offers better returns?
The past year saw strong upward moves in both stocks, with KLA Corporation and Nova Ltd. demonstrating accelerated bullish trends amid rising volumes.
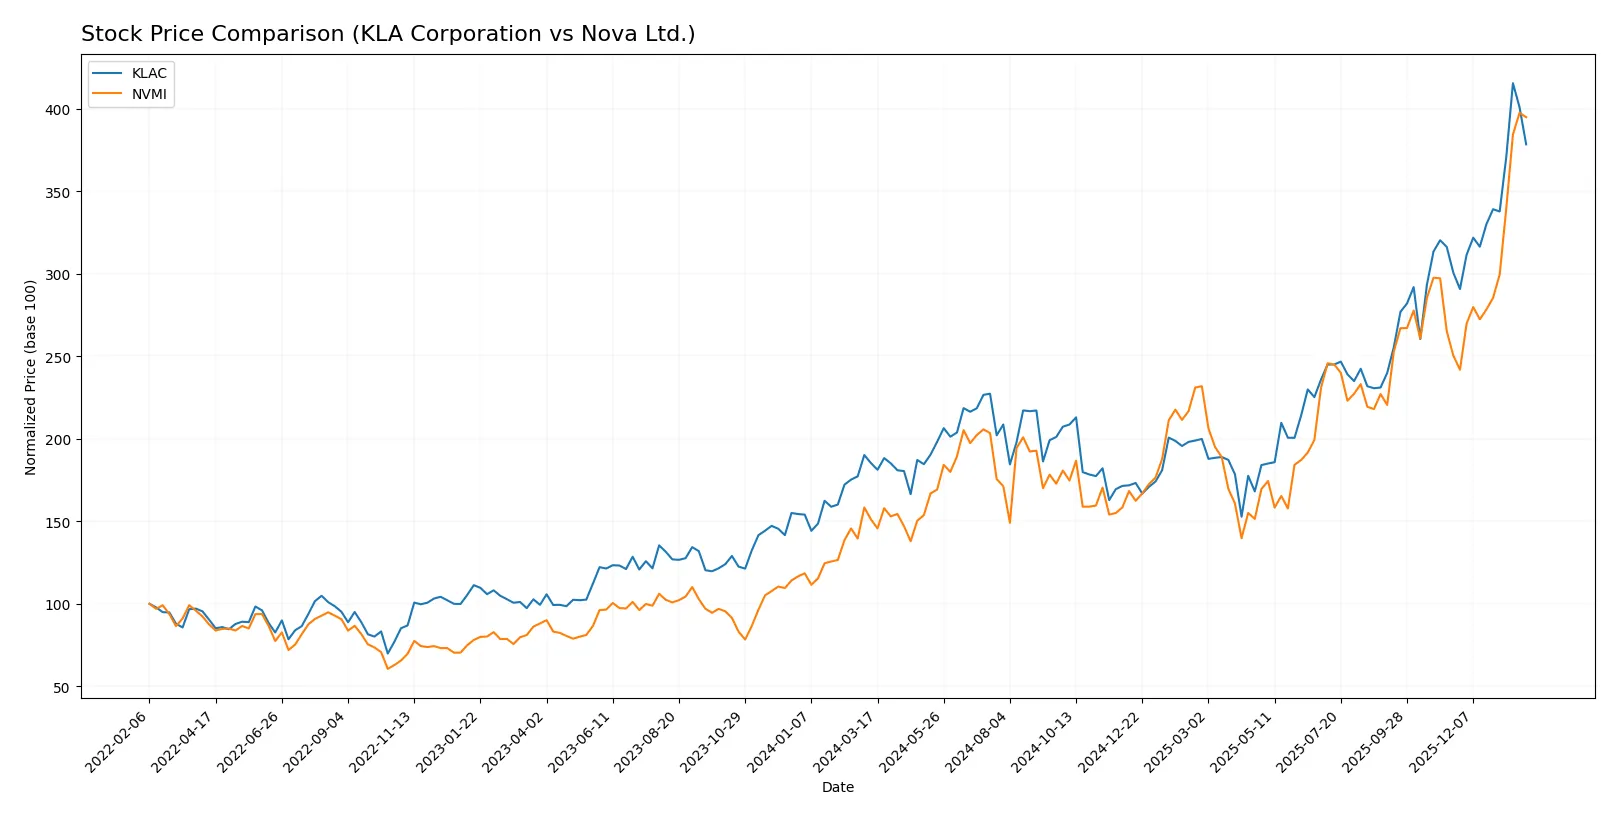
Trend Comparison
KLA Corporation’s stock gained 104.22% over the past year, showing a bullish trend with accelerating momentum, peaking at 1567.82 and a low of 576.53. The recent period shows a 25.89% gain but slight seller dominance in volume.
Nova Ltd. outperformed with a 161.13% price increase over the year, also bullish and accelerating. It traded between 159.92 and 460.91. Recent gains of 57.71% coincide with strong buyer dominance and lower volatility.
Nova Ltd. delivered the highest market performance, outperforming KLA Corporation in both overall and recent price appreciation.
Target Prices
Analysts project solid upside potential for KLA Corporation and Nova Ltd., reflecting confidence in semiconductor process control demand.
| Company | Target Low | Target High | Consensus |
|---|---|---|---|
| KLA Corporation | 1400 | 1900 | 1672.25 |
| Nova Ltd. | 335 | 500 | 408.33 |
The target consensus for KLA sits about 17% above its current price of 1427.94, signaling moderate upside. Nova’s consensus target is roughly 11% below its current 457.84 price, suggesting some caution among analysts.

Don’t Let Luck Decide Your Entry Point
Optimize your entry points with our advanced ProRealTime indicators. You’ll get efficient buy signals with precise price targets for maximum performance. Start outperforming now!
How do institutions grade them?
Institutional grades for KLA Corporation and Nova Ltd. show varied analyst views:
KLA Corporation Grades
The table below displays KLA Corporation’s recent institutional grades and recommendations.
| Grading Company | Action | New Grade | Date |
|---|---|---|---|
| Oppenheimer | Maintain | Outperform | 2026-01-30 |
| Barclays | Maintain | Overweight | 2026-01-30 |
| Cantor Fitzgerald | Maintain | Overweight | 2026-01-30 |
| Jefferies | Maintain | Buy | 2026-01-30 |
| Stifel | Maintain | Buy | 2026-01-30 |
| Wells Fargo | Maintain | Overweight | 2026-01-30 |
| Needham | Maintain | Buy | 2026-01-30 |
| RBC Capital | Maintain | Sector Perform | 2026-01-30 |
| Deutsche Bank | Maintain | Hold | 2026-01-21 |
| Needham | Maintain | Buy | 2026-01-20 |
Nova Ltd. Grades
Below are Nova Ltd.’s latest institutional grades and upgrades.
| Grading Company | Action | New Grade | Date |
|---|---|---|---|
| Needham | Upgrade | Buy | 2026-01-20 |
| B of A Securities | Maintain | Buy | 2026-01-13 |
| Jefferies | Maintain | Buy | 2025-12-15 |
| Evercore ISI Group | Maintain | Outperform | 2025-11-07 |
| Benchmark | Maintain | Buy | 2025-11-07 |
| Cantor Fitzgerald | Maintain | Overweight | 2025-06-24 |
| B of A Securities | Maintain | Buy | 2025-06-24 |
| Citigroup | Maintain | Buy | 2025-05-09 |
| Benchmark | Maintain | Buy | 2025-05-09 |
| B of A Securities | Maintain | Buy | 2025-04-16 |
Which company has the best grades?
KLA Corporation holds consistently strong grades, mostly “Buy” and “Overweight,” with one “Hold.” Nova Ltd. shows a recent upgrade trend and stable “Buy” and “Outperform” ratings. Investors may interpret KLA’s broader analyst coverage and steady grades as a sign of stable confidence, while Nova’s upgrades suggest improving sentiment and momentum.
Risks specific to each company
The following categories identify the critical pressure points and systemic threats facing both firms in the 2026 market environment:
1. Market & Competition
KLA Corporation
- Dominates semiconductor process control with a broad product range and global presence. Faces pressure from rapid innovation cycles and cyclical chip demand.
Nova Ltd.
- Smaller but focused on metrology platforms; competes intensely with larger peers. Vulnerable to market share loss amid aggressive technological change.
2. Capital Structure & Debt
KLA Corporation
- Leverage is moderately high (D/E 1.3), raising financial risk despite strong interest coverage.
Nova Ltd.
- Maintains low leverage (D/E 0.25), signaling prudent capital management and lower financial risk.
3. Stock Volatility
KLA Corporation
- Beta of 1.44 indicates above-market volatility, reflecting sensitivity to semiconductor cycles.
Nova Ltd.
- Beta of 1.83 shows higher volatility, increasing risk for shareholders during sector downturns.
4. Regulatory & Legal
KLA Corporation
- US-based with exposure to evolving tech export controls and IP litigation risks.
Nova Ltd.
- Israeli-based, exposed to complex international trade regulations and geopolitical legal uncertainties.
5. Supply Chain & Operations
KLA Corporation
- Large operational scale cushions supply disruptions but depends heavily on semiconductor equipment supply chains.
Nova Ltd.
- Smaller scale increases vulnerability to supply chain shocks and production delays.
6. ESG & Climate Transition
KLA Corporation
- Faces pressure to reduce carbon footprint amid global climate regulations; ESG initiatives impact operational costs.
Nova Ltd.
- ESG risks moderate but increasing due to international customer demands and evolving reporting standards.
7. Geopolitical Exposure
KLA Corporation
- Global footprint subjects it to US-China trade tensions and export restrictions.
Nova Ltd.
- Significant exposure to Middle East geopolitical risks and cross-border trade complexities.
Which company shows a better risk-adjusted profile?
KLA Corporation’s most impactful risk is its elevated leverage, which could strain financial flexibility during downturns. Nova Ltd. faces its biggest challenge in heightened stock volatility and geopolitical exposure. Despite higher leverage, KLA’s scale and operational resilience offer a slightly better risk-adjusted profile. Nova’s higher beta and geopolitical risks raise caution, especially as semiconductor market cycles remain volatile.
Final Verdict: Which stock to choose?
KLA Corporation’s superpower lies in its durable competitive advantage, demonstrated by a soaring ROIC well above its cost of capital. It efficiently converts invested capital into profits, fueling rapid growth. A point of vigilance is its relatively high debt-to-equity ratio, which may pose risks in volatile markets. This stock suits portfolios aiming for aggressive growth with a tolerance for financial leverage.
Nova Ltd. boasts a strategic moat built on steady profitability improvements and a conservative balance sheet. Its low debt and strong interest coverage provide a safety cushion, appealing to investors seeking stability. Although its ROIC trails KLA’s, Nova’s slower but consistent growth fits well within GARP (Growth at a Reasonable Price) portfolios focused on balanced risk and reward.
If you prioritize high return on capital and explosive growth potential, KLA outshines Nova due to its superior value creation and market momentum. However, if you seek better financial stability and a more cautious growth profile, Nova offers a compelling alternative with less leverage risk. Each choice depends on your appetite for growth versus stability in a cyclical tech landscape.
Disclaimer: Investment carries a risk of loss of initial capital. The past performance is not a reliable indicator of future results. Be sure to understand risks before making an investment decision.
Go Further
I encourage you to read the complete analyses of KLA Corporation and Nova Ltd. to enhance your investment decisions: