Home > Comparison > Technology > KLAC vs MPWR
The strategic rivalry between KLA Corporation and Monolithic Power Systems defines the current trajectory of the semiconductor industry. KLA operates as a capital-intensive semiconductor process control leader, while Monolithic Power Systems focuses on high-margin power electronics solutions. This head-to-head highlights a battle between established industrial scale and innovative niche specialization. This analysis aims to identify which company offers the superior risk-adjusted return potential for a diversified portfolio in 2026.

Table of contents
Companies Overview
KLA Corporation and Monolithic Power Systems, Inc. shape key segments of the semiconductor industry with distinct technological strengths.
KLA Corporation: Semiconductor Process Control Leader
KLA Corporation dominates semiconductor process control and yield management. Its core revenue stems from wafer inspection, metrology, and defect analysis for IC manufacturing. In 2026, KLA sharpened its focus on integrated process control solutions to boost chip quality and yield across semiconductor and electronics sectors.
Monolithic Power Systems, Inc.: Power Electronics Innovator
Monolithic Power Systems excels in semiconductor-based power electronics for diverse markets. Its revenue engine relies on DC-to-DC ICs and lighting control ICs for computing, automotive, and industrial applications. The company prioritizes expanding its product portfolio and geographic reach to capture growth in power management solutions worldwide.
Strategic Collision: Similarities & Divergences
While both operate in semiconductors, KLA pursues a closed ecosystem of process control and inspection, contrasting with Monolithic Power’s open infrastructure in power ICs. Their main battleground lies in semiconductor supply chain integration versus specialized power solutions. Investors should note KLA’s scale and process mastery differ sharply from Monolithic’s niche innovation and market agility.
Income Statement Comparison
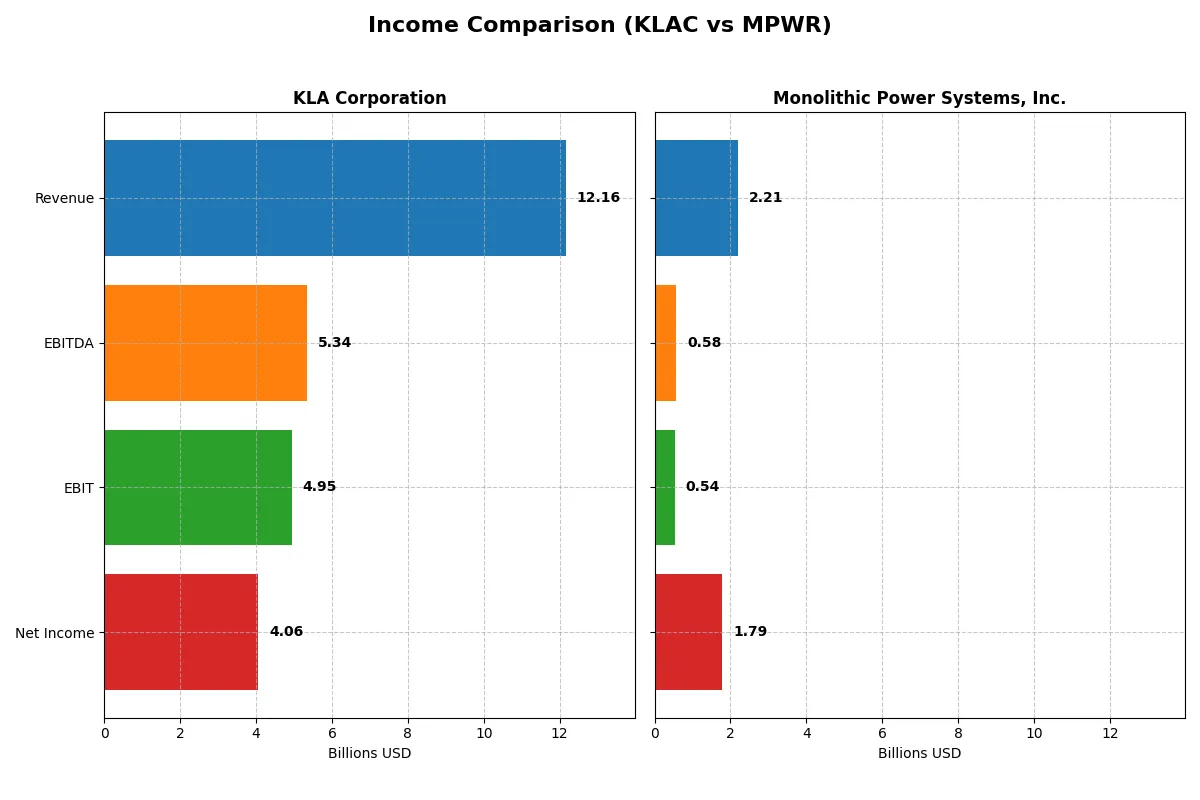
The following data dissects the core profitability and scalability of both corporate engines to reveal who dominates the bottom line:
| Metric | KLA Corporation (KLAC) | Monolithic Power Systems, Inc. (MPWR) |
|---|---|---|
| Revenue | 12.2B | 2.21B |
| Cost of Revenue | 4.58B | 986M |
| Operating Expenses | 2.33B | 682M |
| Gross Profit | 7.58B | 1.22B |
| EBITDA | 5.34B | 576M |
| EBIT | 4.95B | 539M |
| Interest Expense | 302M | 0 |
| Net Income | 4.06B | 1.79B |
| EPS | 30.53 | 36.76 |
| Fiscal Year | 2025 | 2024 |
Income Statement Analysis: The Bottom-Line Duel
This income statement comparison reveals which company drives superior efficiency and profitability through its core operations.
KLA Corporation Analysis
KLA’s revenue surged from 6.9B in 2021 to 12.2B in 2025, nearly doubling its net income to 4.1B. The firm sustains robust gross margins above 62%, with net margins at a strong 33%. In 2025, KLA demonstrates powerful momentum, growing EBIT by 41% year-over-year, signaling operational leverage and disciplined cost management.
Monolithic Power Systems, Inc. Analysis
Monolithic Power’s revenue climbed from 844M in 2020 to 2.2B in 2024, while net income exploded nearly tenfold to 1.8B. Its gross margin stands healthy at 55%, though EBIT margins are more modest at 24%. Despite rapid growth, operating expenses grew faster than revenue last year, slightly pressuring margins but still delivering impressive bottom-line expansion.
Verdict: Growth Velocity vs. Margin Strength
KLA leads with superior margin quality and consistent profitability gains, reflecting operational excellence and scale. Monolithic Power impresses with exceptional revenue and net income growth rates but lags on operating efficiency. Investors seeking steady, margin-driven returns may favor KLA, while those prioritizing aggressive growth might consider Monolithic’s dynamic trajectory.
Financial Ratios Comparison
These vital ratios act as a diagnostic tool to expose the underlying fiscal health, valuation premiums, and capital efficiency of the companies compared below:
| Ratios | KLA Corporation (KLAC) | Monolithic Power Systems, Inc. (MPWR) |
|---|---|---|
| ROE | 87% | 57% |
| ROIC | 38% | 16% |
| P/E | 29.3 | 16.1 |
| P/B | 25.4 | 9.1 |
| Current Ratio | 2.62 | 5.31 |
| Quick Ratio | 1.83 | 3.89 |
| D/E (Debt-to-Equity) | 1.30 | 0.005 |
| Debt-to-Assets | 38% | 0.4% |
| Interest Coverage | 17.3 | 0 |
| Asset Turnover | 0.76 | 0.61 |
| Fixed Asset Turnover | 9.70 | 4.17 |
| Payout Ratio | 22.3% | 13.5% |
| Dividend Yield | 0.76% | 0.84% |
| Fiscal Year | 2025 | 2024 |
Efficiency & Valuation Duel: The Vital Signs
Financial ratios act as a company’s DNA, exposing hidden risks and operational strengths that shape investment decisions.
KLA Corporation
KLA boasts a stellar ROE of 86.56% and a strong net margin of 33.41%, signaling exceptional profitability. However, its P/E ratio at 29.34 suggests the stock is somewhat expensive relative to earnings. The modest 0.76% dividend yield contrasts with high reinvestment in R&D, fueling future growth and operational efficiency.
Monolithic Power Systems, Inc.
Monolithic Power delivers a robust net margin of 80.95% and a healthy ROE of 56.8%, reflecting efficient profit generation. The P/E ratio of 16.09 is more moderate, indicating reasonable valuation. Despite a low dividend yield of 0.84%, the company maintains a low debt level and prioritizes growth investments, enhancing long-term value creation.
Balanced Strength vs. Valuation Discipline
KLA offers superior profitability but trades at a stretched valuation, while Monolithic Power balances strong margins with a more reasonable price. Investors seeking operational excellence with moderate risk may lean toward KLA, whereas those prioritizing valuation discipline might prefer Monolithic Power’s profile.
Which one offers the Superior Shareholder Reward?
I compare KLA Corporation (KLAC) and Monolithic Power Systems, Inc. (MPWR) on dividends, payout ratios, and buyback intensity. KLAC yields 0.76% with a 22% payout ratio, supported by strong free cash flow (28B per share) and steady buybacks. MPWR offers a lower 0.84% yield but a higher payout ratio of 43%, with modest free cash flow (13B per share) and limited buyback activity. KLAC’s balanced distribution—consistent dividends plus aggressive buybacks—sustains shareholder value better. MPWR’s higher payout risks free cash flow flexibility amid its growth phase. For 2026, I favor KLAC’s sustainable total return profile.
Comparative Score Analysis: The Strategic Profile
The radar chart reveals the fundamental DNA and trade-offs of KLA Corporation and Monolithic Power Systems, Inc., highlighting their operational strengths and valuation nuances:
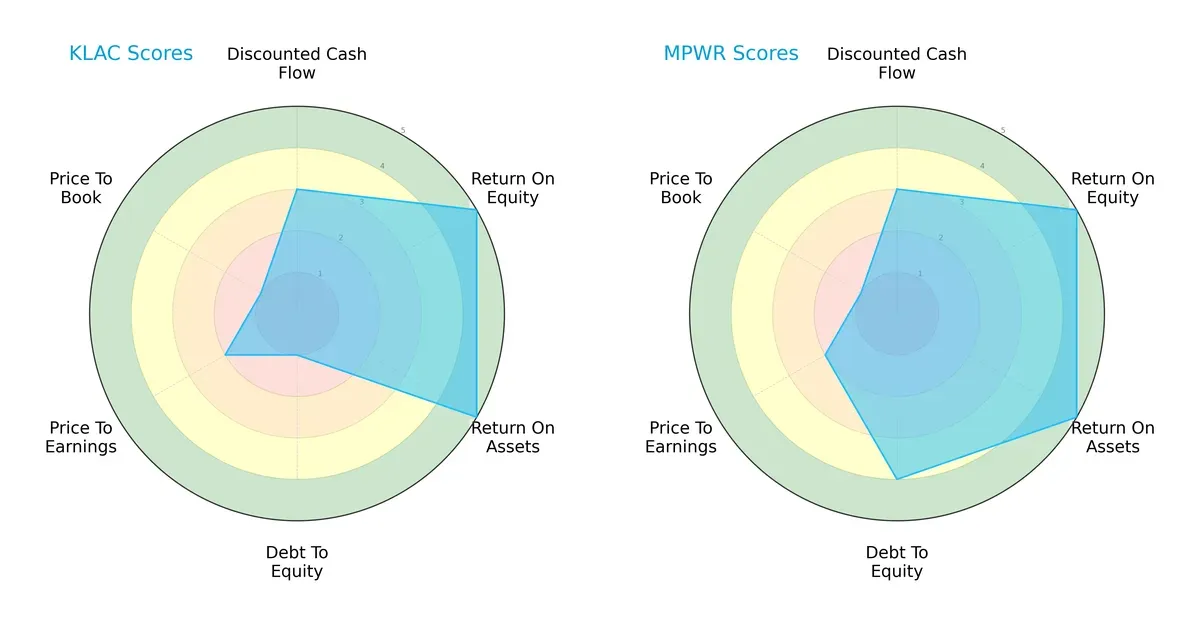
KLA and Monolithic Power share top-tier ROE and ROA scores, indicating efficient profit generation and asset use. KLA’s debt-to-equity score signals high leverage risk, contrasting with Monolithic’s stronger balance sheet. Monolithic edges higher in overall score, showing a more balanced profile, while KLA relies heavily on operational efficiency but struggles with financial risk and valuation metrics.
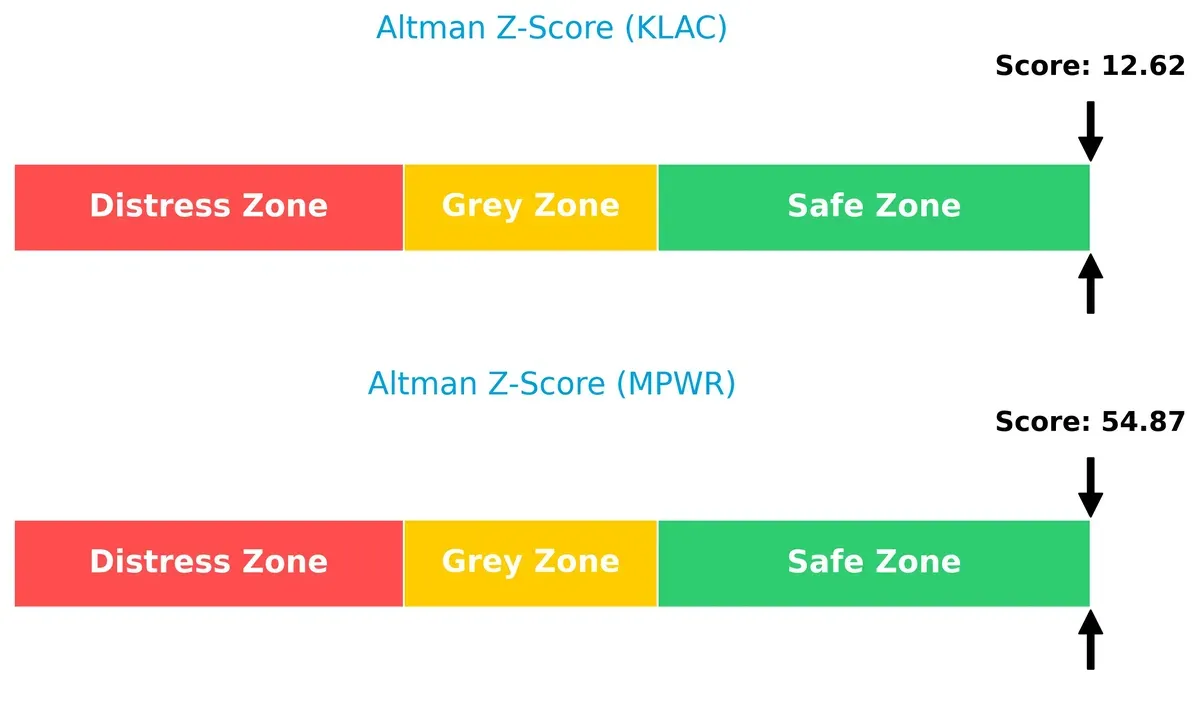
Bankruptcy Risk: Solvency Showdown
Monolithic Power’s Altman Z-Score far exceeds KLA’s, both safely above the distress threshold. This gap implies Monolithic carries significantly lower bankruptcy risk in this cycle:
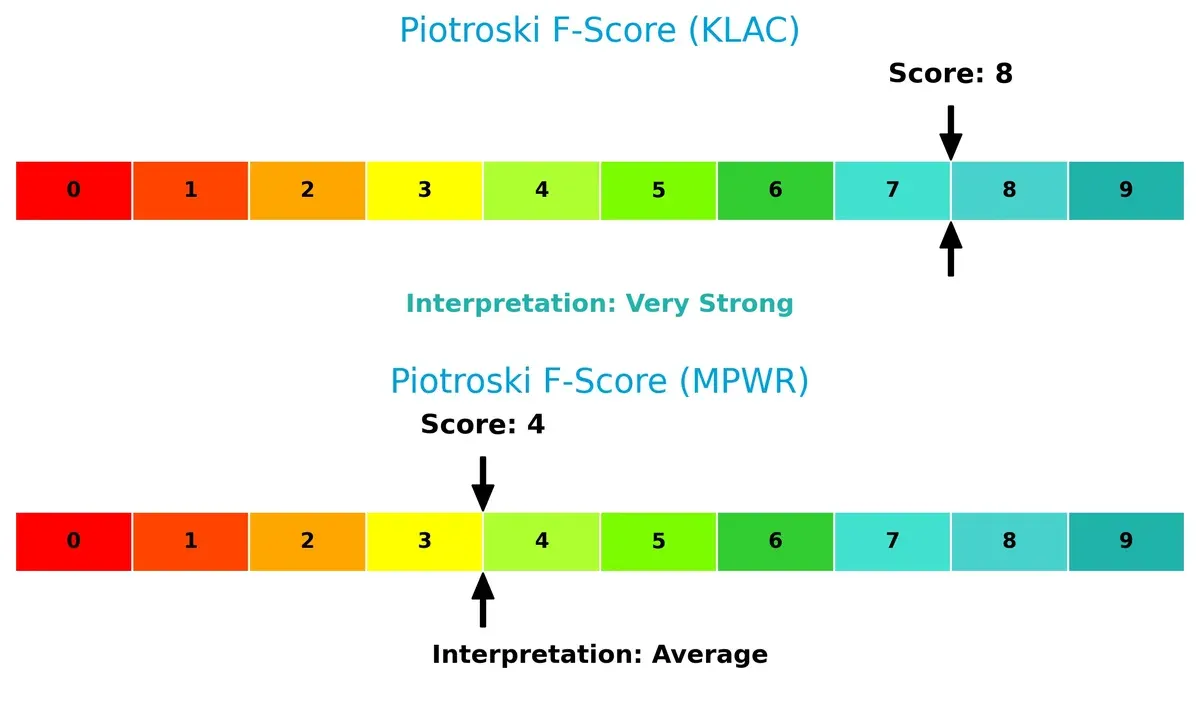
Financial Health: Quality of Operations
KLA’s Piotroski F-Score of 8 signals very strong internal financial health, while Monolithic’s 4 marks average quality. KLA shows fewer red flags in profitability, leverage, and liquidity metrics:
How are the two companies positioned?
This section dissects KLAC and MPWR’s operational DNA by comparing revenue distribution and internal strengths and weaknesses. The goal is to confront their economic moats to reveal which model offers a more resilient, sustainable competitive advantage today.
Revenue Segmentation: The Strategic Mix
The following visual comparison dissects how KLA Corporation and Monolithic Power Systems diversify their income streams and where their primary sector bets lie:
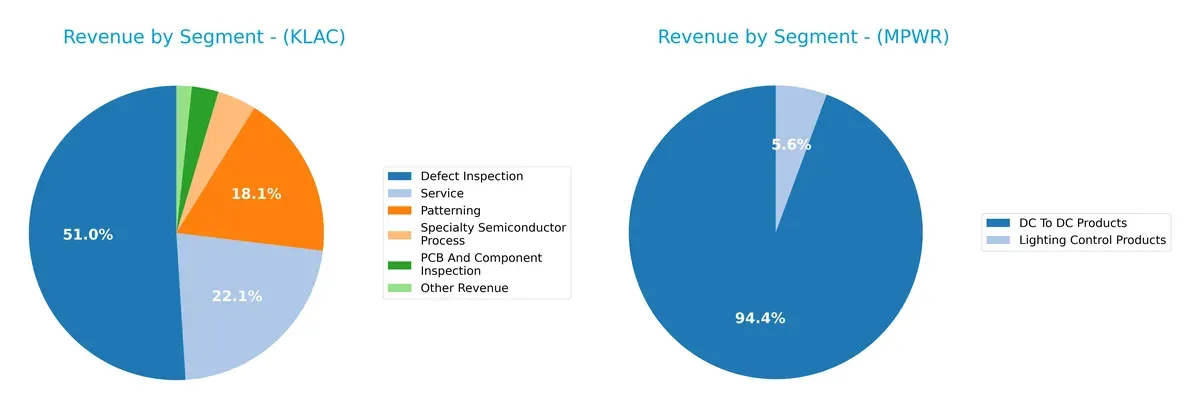
KLA Corporation’s revenue anchors heavily on Defect Inspection at $6.2B in 2025, with significant contributions from Service ($2.7B) and Patterning ($2.2B). This mix reveals a strong ecosystem lock-in around semiconductor process control. In contrast, Monolithic Power Systems relies predominantly on DC To DC Products, generating $1.7B, dwarfing its Lighting Control segment at $102M. KLA’s diversified portfolio mitigates concentration risk better than MPWR’s single-segment dependence.
Strengths and Weaknesses Comparison
This table compares the strengths and weaknesses of KLA Corporation and Monolithic Power Systems, Inc.:
KLA Corporation Strengths
- Diversified semiconductor process segments
- Strong profitability with 33.41% net margin and 86.56% ROE
- Solid liquidity ratios with current ratio 2.62 and quick ratio 1.83
- High return on invested capital (37.97%) above WACC
- Significant global presence in China, Taiwan, and Korea
Monolithic Power Systems Strengths
- Extremely high net margin at 80.95%
- Low debt-to-equity (0.01) and debt-to-assets (0.44%) ratios indicate strong balance sheet
- Excellent interest coverage ratio (infinite)
- High current and quick ratios (5.31 and 3.89) show strong liquidity
- Global footprint expanding with notable revenue in China and Taiwan
KLA Corporation Weaknesses
- Elevated debt-to-equity ratio (1.3) increases financial risk
- High P/E (29.34) and P/B (25.39) ratios suggest premium valuation
- WACC (10.42%) above optimal level
- Moderate dividend yield (0.76%) may not attract income investors
- Asset turnover (0.76) only neutral
Monolithic Power Systems Weaknesses
- High WACC (10.66%) and unfavorable P/B ratio (9.14)
- Current ratio (5.31) flagged as unfavorable possibly due to asset structure
- Lower ROIC (16.22%) compared to KLA
- Dividend yield (0.84%) still low for income focus
- Asset turnover (0.61) neutral, showing moderate operational efficiency
Both companies show strong profitability and global reach but differ in financial structure and valuation metrics. KLA benefits from diversified revenue streams and strong returns but carries higher leverage and valuation premiums. MPWR impresses with exceptional margins and conservative debt but faces challenges in capital efficiency and cost of capital. These factors shape each company’s strategic financial positioning in 2026.
The Moat Duel: Analyzing Competitive Defensibility
A structural moat alone protects long-term profits from relentless competition and market forces. Here is how KLA Corporation and Monolithic Power Systems defend their turf:
KLA Corporation: Precision Process Control Moat
KLA’s moat stems from specialized process control technology that commands high switching costs. Its 40% EBIT margin and soaring ROIC confirm efficient capital use. In 2026, expanding wafer inspection into new semiconductor nodes could deepen this advantage.
Monolithic Power Systems: Integrated Power Solutions Moat
Monolithic’s moat lies in proprietary power IC designs that embed cost advantages and customer lock-in. Despite lower margins than KLA, MPWR grows revenue 161% over five years. Its expansion into automotive electrification promises to strengthen its competitive hold.
Verdict: Precision Control vs. Power Integration Moats
KLA’s wider moat reflects stronger margin stability and a 27.5% ROIC premium over WACC, outmatching MPWR’s 5.6%. KLA is better positioned to sustain its market share amidst semiconductor complexity and capital intensity.
Which stock offers better returns?
Over the past year, KLA Corporation and Monolithic Power Systems, Inc. showed strong price appreciation with accelerating trends, highlighting dynamic market interest and notable price ranges.
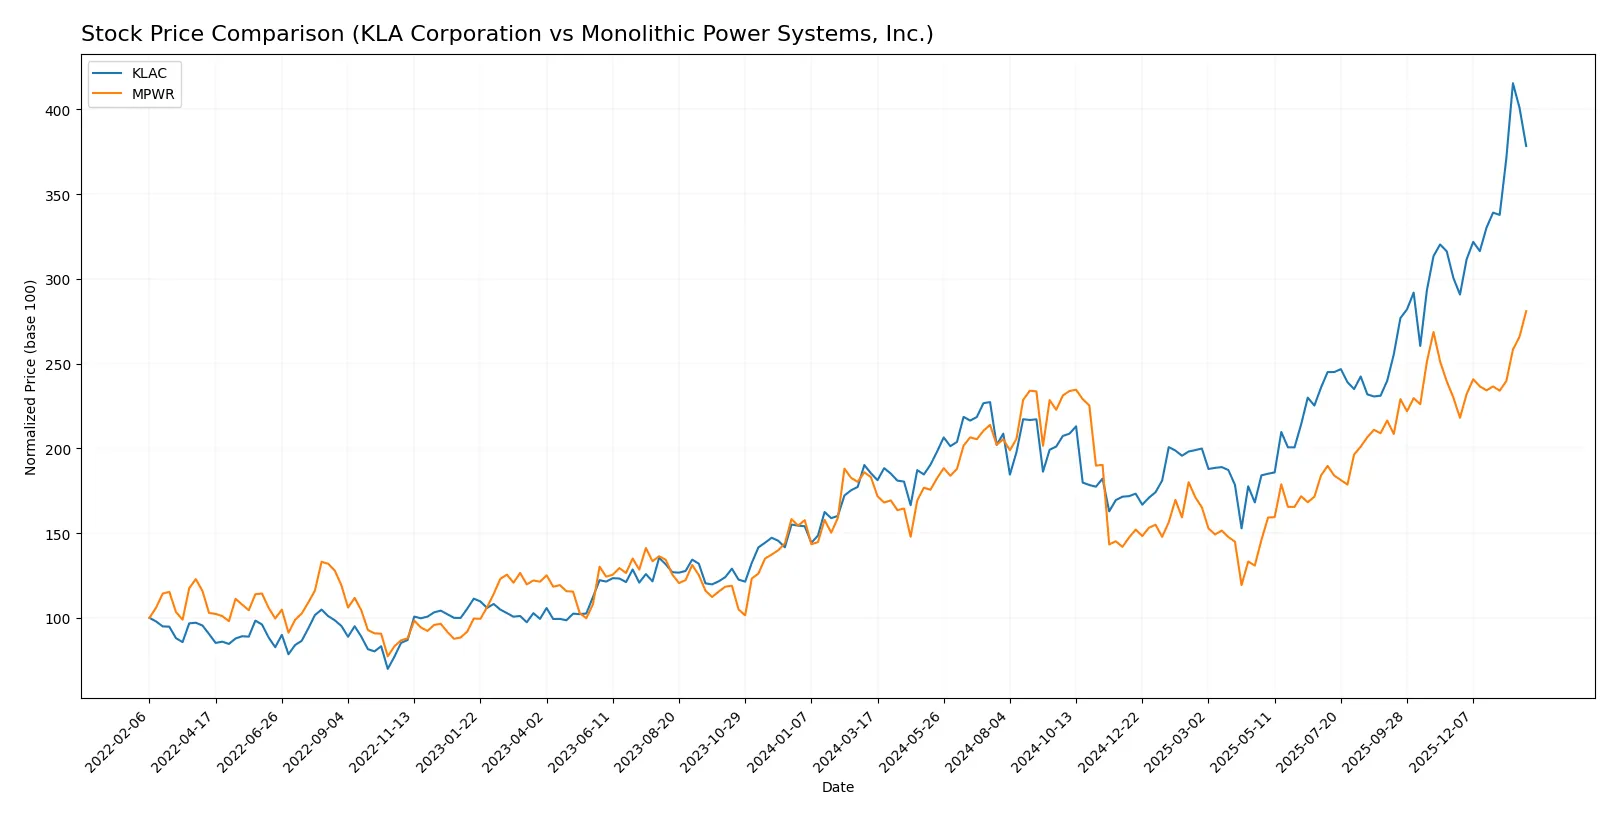
Trend Comparison
KLA Corporation’s stock increased 104.22% over the past 12 months, demonstrating a bullish trend with accelerating momentum and a high volatility level reflected by a 213.25 standard deviation.
Monolithic Power Systems, Inc. gained 53.53% in the same period, also showing a bullish trend with acceleration but with lower volatility at a 143.77 standard deviation.
KLA’s 104.22% gain surpasses MPWR’s 53.53%, delivering the highest market performance among the two over the past year.
Target Prices
Analyst consensus shows a bullish outlook for both KLA Corporation and Monolithic Power Systems, Inc.
| Company | Target Low | Target High | Consensus |
|---|---|---|---|
| KLA Corporation | 1400 | 1900 | 1672 |
| Monolithic Power Systems, Inc. | 1025 | 1375 | 1214 |
The consensus target prices exceed current trading levels, signaling expected upside potential for both semiconductor firms. KLAC’s consensus target is about 17% above its price, while MPWR shows roughly an 8% premium.

Don’t Let Luck Decide Your Entry Point
Optimize your entry points with our advanced ProRealTime indicators. You’ll get efficient buy signals with precise price targets for maximum performance. Start outperforming now!
How do institutions grade them?
The following tables summarize recent institutional grades for KLA Corporation and Monolithic Power Systems, Inc.:
KLA Corporation Grades
This table shows the latest grades assigned to KLA Corporation by major financial institutions.
| Grading Company | Action | New Grade | Date |
|---|---|---|---|
| Oppenheimer | Maintain | Outperform | 2026-01-30 |
| Barclays | Maintain | Overweight | 2026-01-30 |
| Cantor Fitzgerald | Maintain | Overweight | 2026-01-30 |
| Jefferies | Maintain | Buy | 2026-01-30 |
| Stifel | Maintain | Buy | 2026-01-30 |
| Wells Fargo | Maintain | Overweight | 2026-01-30 |
| Needham | Maintain | Buy | 2026-01-30 |
| RBC Capital | Maintain | Sector Perform | 2026-01-30 |
| Deutsche Bank | Maintain | Hold | 2026-01-21 |
| Needham | Maintain | Buy | 2026-01-20 |
Monolithic Power Systems, Inc. Grades
This table lists recent grades for Monolithic Power Systems, Inc. from reputable grading firms.
| Grading Company | Action | New Grade | Date |
|---|---|---|---|
| Wells Fargo | Maintain | Overweight | 2026-01-26 |
| Wells Fargo | Upgrade | Overweight | 2026-01-15 |
| Truist Securities | Maintain | Buy | 2025-12-19 |
| Citigroup | Maintain | Buy | 2025-11-03 |
| TD Cowen | Maintain | Buy | 2025-10-31 |
| Keybanc | Maintain | Overweight | 2025-10-31 |
| Rosenblatt | Maintain | Neutral | 2025-10-31 |
| Keybanc | Maintain | Overweight | 2025-10-23 |
| Wells Fargo | Maintain | Equal Weight | 2025-10-20 |
| Stifel | Maintain | Buy | 2025-10-17 |
Which company has the best grades?
KLA Corporation consistently receives strong grades, mostly Buy and Overweight, from a broad range of institutions. Monolithic Power Systems also earns solid Buy and Overweight ratings but shows more variation, including Neutral and Equal Weight. Investors may interpret KLA’s more uniform positive assessments as greater consensus confidence.
Risks specific to each company
The following categories identify the critical pressure points and systemic threats facing both firms in the 2026 market environment:
1. Market & Competition
KLA Corporation
- Faces intense competition in semiconductor process control with high R&D demands.
Monolithic Power Systems, Inc.
- Competes in power electronics with pressure to innovate for diverse end markets.
2. Capital Structure & Debt
KLA Corporation
- Higher debt-to-equity ratio (1.3) signals leveraged position, raising financial risk.
Monolithic Power Systems, Inc.
- Minimal debt (0.01 D/E) provides strong balance sheet and financial flexibility.
3. Stock Volatility
KLA Corporation
- Beta of 1.444 indicates higher volatility relative to the market.
Monolithic Power Systems, Inc.
- Slightly higher beta at 1.456, reflecting comparable market sensitivity.
4. Regulatory & Legal
KLA Corporation
- Subject to stringent semiconductor export controls and IP regulations.
Monolithic Power Systems, Inc.
- Faces regulatory scrutiny in power management and automotive sectors globally.
5. Supply Chain & Operations
KLA Corporation
- Complex global supply chain vulnerable to semiconductor component shortages.
Monolithic Power Systems, Inc.
- Supply chain diversified but exposed to geopolitical tensions in Asia.
6. ESG & Climate Transition
KLA Corporation
- Pressure to lower carbon footprint amid energy-intensive manufacturing processes.
Monolithic Power Systems, Inc.
- Increasing focus on sustainability in power solutions aligns with market trends.
7. Geopolitical Exposure
KLA Corporation
- Significant exposure to US-China trade tensions affecting semiconductor industry.
Monolithic Power Systems, Inc.
- International sales expose it to risks from regional conflicts and tariffs.
Which company shows a better risk-adjusted profile?
KLA’s most impactful risk is its leveraged capital structure, raising financial vulnerability despite strong profitability. MPWR’s key risk lies in supply chain exposure to geopolitical tensions, though its balance sheet is robust. Overall, MPWR demonstrates a better risk-adjusted profile supported by minimal debt and favorable financial scores. Recent data reveals KLA’s debt-to-equity ratio at 1.3 contrasts sharply with MPWR’s near-zero leverage, reinforcing my concern over KLA’s financial risk.
Final Verdict: Which stock to choose?
KLA Corporation’s superpower lies in its exceptional capital efficiency and robust value creation, evidenced by a wide moat with a steadily growing ROIC well above its WACC. Its point of vigilance is the relatively high leverage, which could pressure financial flexibility. KLAC suits investors aiming for aggressive growth backed by durable competitive advantages.
Monolithic Power Systems impresses with its strategic moat anchored in strong recurring revenue and a pristine balance sheet marked by minimal debt. It offers a safer profile than KLAC, though with a lower ROIC premium. MPWR fits well in GARP portfolios where steady growth and financial stability matter more than rapid expansion.
If you prioritize long-term value creation through operational excellence and are comfortable with moderate financial risk, KLAC outshines. However, if you seek better stability with less leverage and a cleaner balance sheet, MPWR offers a compelling alternative. Both present attractive scenarios, but the choice hinges on your risk tolerance and growth horizon.
Disclaimer: Investment carries a risk of loss of initial capital. The past performance is not a reliable indicator of future results. Be sure to understand risks before making an investment decision.
Go Further
I encourage you to read the complete analyses of KLA Corporation and Monolithic Power Systems, Inc. to enhance your investment decisions: