Home > Comparison > Technology > MU vs KLAC
The strategic rivalry between Micron Technology, Inc. and KLA Corporation shapes the semiconductor industry’s evolution. Micron operates as a capital-intensive memory and storage manufacturer, while KLA excels as a specialized provider of process control and yield management solutions. This head-to-head pits manufacturing scale against technological precision. This analysis will determine which business model offers superior risk-adjusted returns for a diversified portfolio in the fast-paced technology sector.
Table of contents
Companies Overview
Two semiconductor giants, Micron Technology and KLA Corporation, shape critical segments of the global tech supply chain.
Micron Technology, Inc.: Memory and Storage Powerhouse
Micron dominates as a leading memory and storage supplier with a $467B market cap. It generates revenue by designing and selling DRAM, NAND, and NOR products, serving cloud, mobile, and automotive markets. In 2026, Micron sharpens its focus on expanding high-performance memory solutions across compute and networking sectors to capture growing data demands.
KLA Corporation: Semiconductor Process Control Leader
KLA stands out with a $188B market cap, specializing in process control and yield management for semiconductor manufacturing. It earns by selling inspection, metrology, and defect analysis tools critical to chipmakers’ quality assurance. In 2026, KLA emphasizes enhancing advanced process control technologies to support next-generation semiconductor fabrication complexities.
Strategic Collision: Similarities & Divergences
Micron pursues a product-driven, end-market approach centered on memory innovation, while KLA adopts a service-intensive, equipment-focused model for process optimization. Their primary battleground lies in the semiconductor value chain—Micron in component supply, KLA in manufacturing precision. Investors face distinct profiles: Micron’s cyclical exposure to memory demand contrasts with KLA’s steadier, technology-enabled process control niche.
Income Statement Comparison
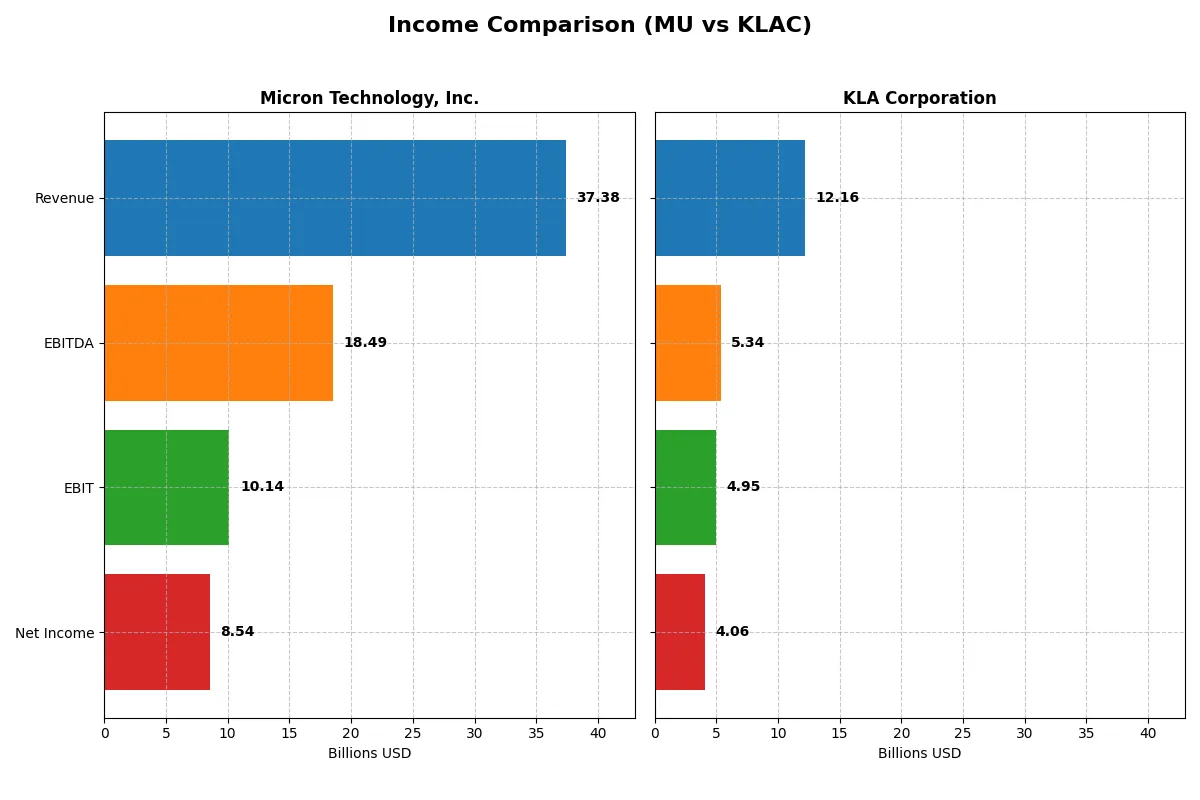
This data dissects the core profitability and scalability of both corporate engines to reveal who dominates the bottom line:
| Metric | Micron Technology, Inc. (MU) | KLA Corporation (KLAC) |
|---|---|---|
| Revenue | 37.4B | 12.2B |
| Cost of Revenue | 22.5B | 4.6B |
| Operating Expenses | 5.0B | 2.3B |
| Gross Profit | 14.9B | 7.6B |
| EBITDA | 18.5B | 5.3B |
| EBIT | 10.1B | 4.9B |
| Interest Expense | 0.5B | 0.3B |
| Net Income | 8.5B | 4.1B |
| EPS | 7.65 | 30.53 |
| Fiscal Year | 2025 | 2025 |
Income Statement Analysis: The Bottom-Line Duel
This income statement comparison reveals which company runs the more efficient and profitable financial engine in a competitive market.
Micron Technology, Inc. Analysis
Micron’s revenue surged from $15.5B in 2023 to $37.4B in 2025, reflecting a strong recovery and growth momentum. Net income swung dramatically from a loss of $5.8B in 2023 to a robust $8.5B in 2025. Gross margin improved to 39.8%, while net margin expanded to 22.8%, signaling enhanced cost control and operational efficiency in the latest fiscal year.
KLA Corporation Analysis
KLA steadily increased revenue from $6.9B in 2021 to $12.2B in 2025, maintaining consistent growth. Net income nearly doubled from $2.1B to $4.1B over the same period. The company boasts a strong gross margin of 62.3% and a net margin of 33.4%, reflecting superior profitability and disciplined expense management, with healthy momentum sustained in 2025.
Margin Strength vs. Growth Surge
Micron delivers explosive growth and margin recovery, turning losses into solid profits within two years. KLA, however, maintains higher margins and steadier income growth. For investors prioritizing rapid earnings turnaround, Micron stands out. Those valuing consistent profitability and margin dominance may favor KLA’s resilient profile.
Financial Ratios Comparison
These vital ratios act as a diagnostic tool to expose the underlying fiscal health, valuation premiums, and capital efficiency of the companies compared below:
| Ratios | Micron Technology, Inc. (MU) | KLA Corporation (KLAC) |
|---|---|---|
| ROE | 15.8% | 86.6% |
| ROIC | 12.1% | 38.0% |
| P/E | 15.9 | 29.3 |
| P/B | 2.51 | 25.4 |
| Current Ratio | 2.52 | 2.62 |
| Quick Ratio | 1.79 | 1.83 |
| D/E | 0.28 | 1.30 |
| Debt-to-Assets | 18.5% | 37.9% |
| Interest Coverage | 20.7 | 17.3 |
| Asset Turnover | 0.45 | 0.76 |
| Fixed Asset Turnover | 0.79 | 9.70 |
| Payout ratio | 6.1% | 22.3% |
| Dividend yield | 0.38% | 0.76% |
| Fiscal Year | 2025 | 2025 |
Efficiency & Valuation Duel: The Vital Signs
Ratios act as a company’s DNA, revealing hidden risks and operational excellence critical to understanding investment quality.
Micron Technology, Inc.
Micron shows solid profitability with a 15.8% ROE and a healthy 22.8% net margin, signaling operational strength. Its P/E of 15.9 and P/B of 2.5 suggest a fairly valued stock, not stretched. Micron returns modest dividends (0.38% yield), focusing on steady shareholder value rather than aggressive buybacks.
KLA Corporation
KLA dominates profitability with an 86.6% ROE and a robust 33.4% net margin, reflecting exceptional efficiency. However, its valuation is expensive, with a P/E of 29.3 and a P/B of 25.4, indicating a stretched price. KLA offers a higher dividend yield (0.76%) but carries heavier debt, which merits caution.
Premium Valuation vs. Operational Safety
KLA delivers remarkable returns but at a premium valuation and higher leverage, raising risk. Micron offers balanced profitability with more conservative valuation and financial health. Investors seeking growth at a fair price may prefer Micron, while those favoring high efficiency despite valuation risk might lean toward KLA.
Which one offers the Superior Shareholder Reward?
I see Micron Technology (MU) pays a low dividend yield of 0.38%, with a modest payout ratio near 6%. Its free cash flow per share is only $1.49, reflecting limited payout coverage. MU’s buybacks appear restrained given its cautious capital allocation amid cyclical memory markets. Conversely, KLA Corporation (KLAC) delivers a more generous 0.76% yield and maintains a sustainable 22% payout ratio, supported by robust free cash flow of $28.13 per share. KLAC’s aggressive buyback program significantly boosts total shareholder return. Historically, I find KLAC’s balanced distribution and strong cash generation better position it for consistent value creation. Therefore, KLAC offers the superior total return profile for investors in 2026.
Comparative Score Analysis: The Strategic Profile
The radar chart reveals the fundamental DNA and trade-offs of Micron Technology, Inc. and KLA Corporation, highlighting their core financial strengths and valuation nuances:
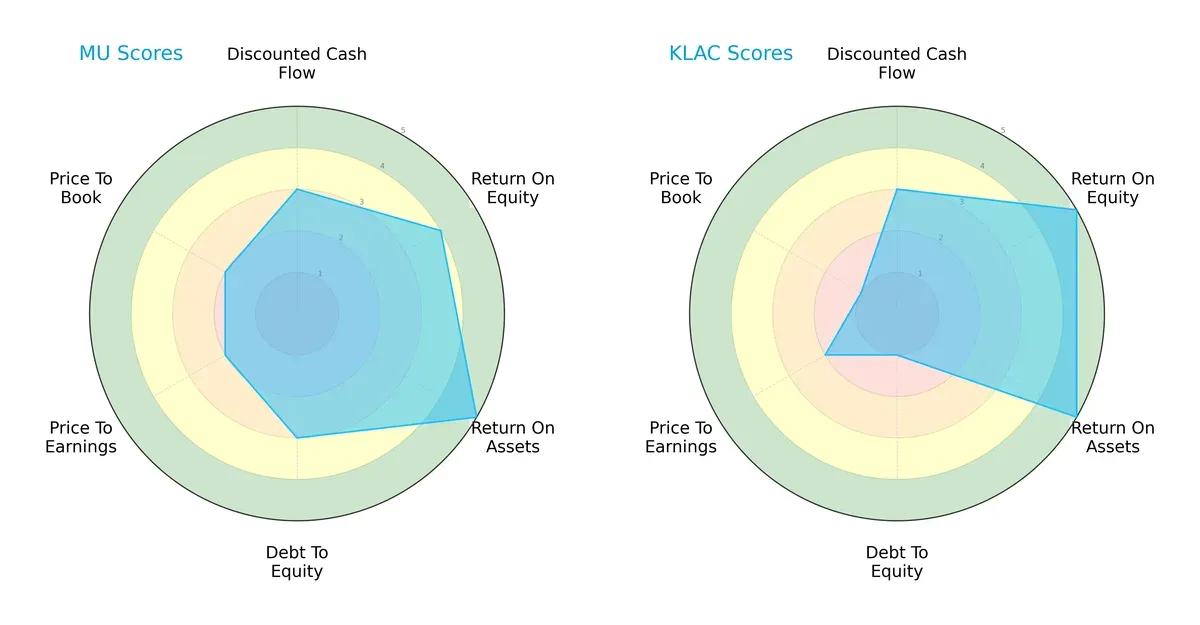
Micron shows a balanced profile with favorable ROE (4) and very favorable ROA (5), coupled with moderate debt management (3). KLA excels in profitability metrics with top ROE (5) and ROA (5) scores but carries a heavy debt burden (debt-to-equity score 1). Both have moderate DCF (3) and P/E scores (2), though Micron’s valuation metrics (P/B 2) are less stretched than KLA’s (P/B 1). I see Micron as more balanced, while KLA relies on operational efficiency despite financial leverage risks.
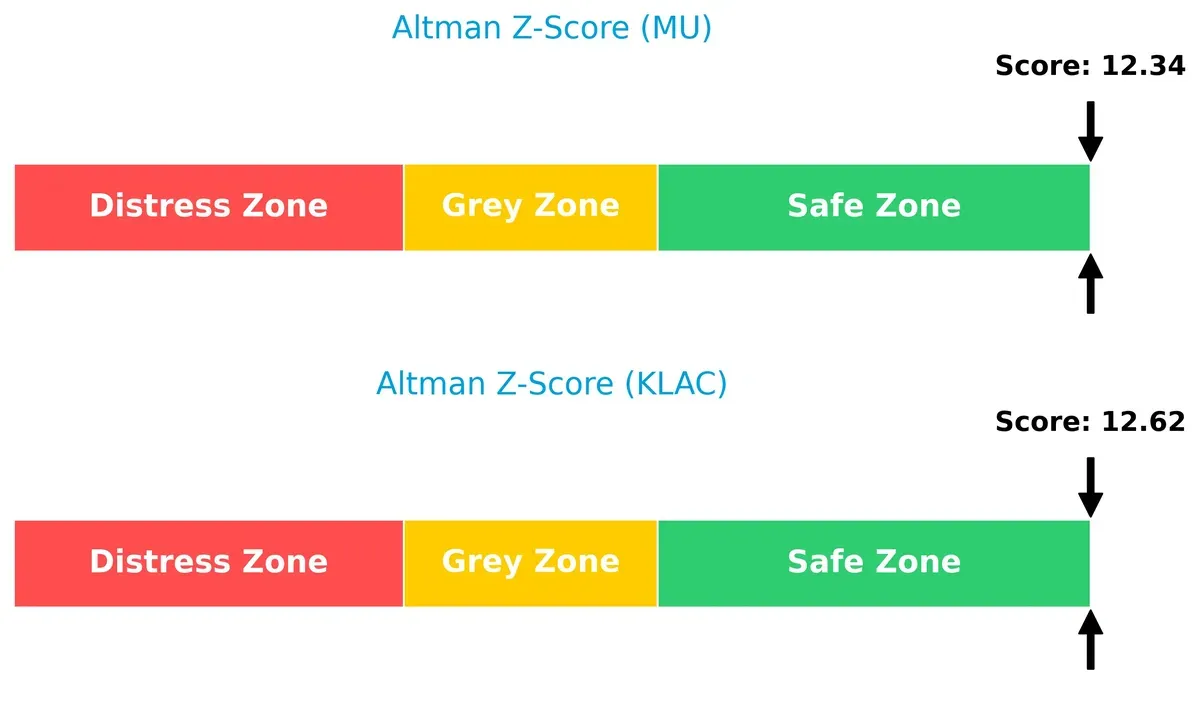
Bankruptcy Risk: Solvency Showdown
Micron and KLA both reside well within the safe zone of Altman Z-Scores—12.34 and 12.62 respectively—indicating strong long-term solvency and low bankruptcy risk in this cycle:
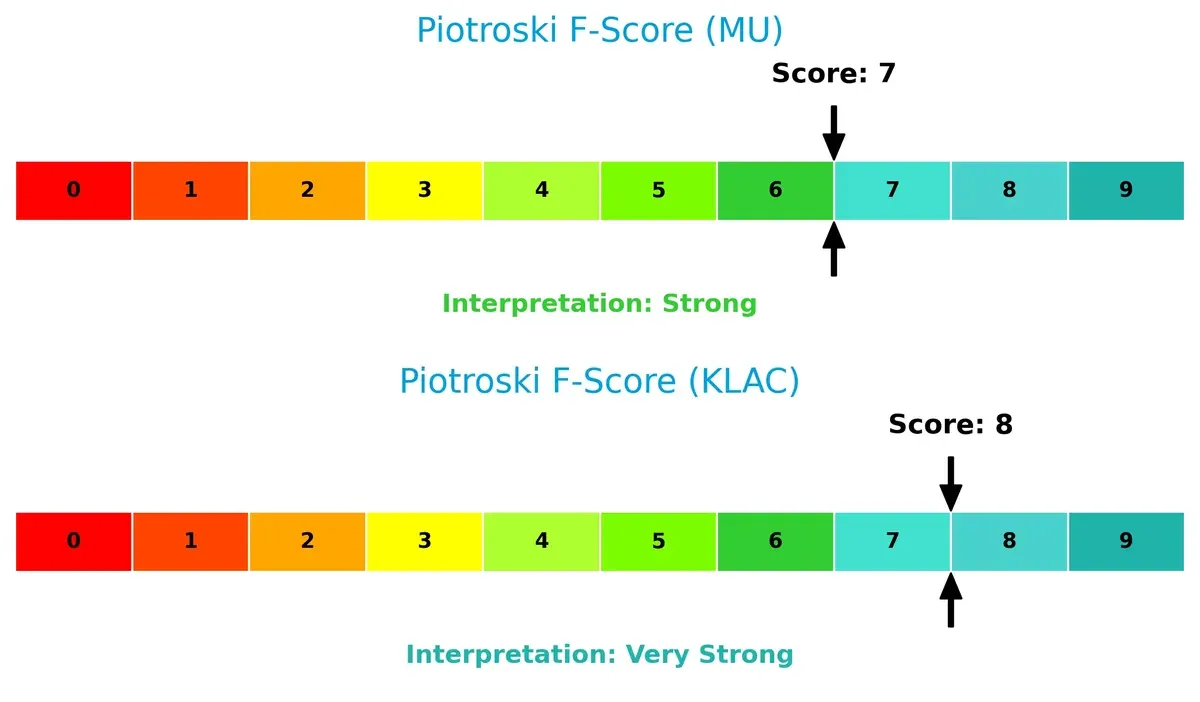
Financial Health: Quality of Operations
KLA scores an 8 on the Piotroski F-Score, signaling very strong internal financial health, outperforming Micron’s strong but lower 7. This suggests KLA maintains superior profitability, liquidity, and operational efficiency metrics, while Micron shows no immediate red flags but slightly less robustness:
How are the two companies positioned?
This section dissects MU and KLAC’s operational DNA by comparing revenue distribution and internal strengths and weaknesses. The goal is to confront their economic moats to identify which model offers the most resilient, sustainable advantage today.
Revenue Segmentation: The Strategic Mix
This visual comparison dissects how Micron Technology, Inc. and KLA Corporation diversify their income streams and where their primary sector bets lie:
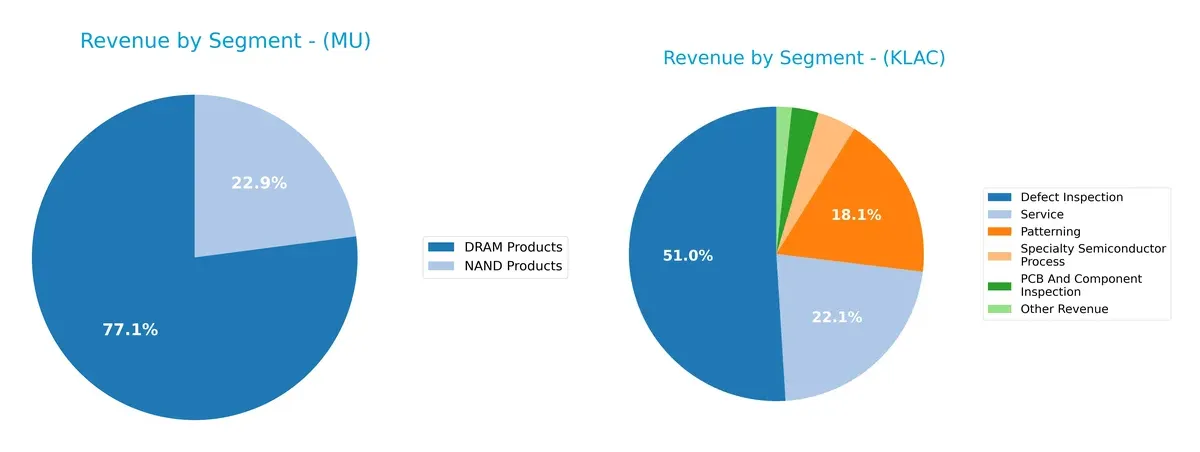
Micron leans heavily on DRAM Products, which dwarfs its NAND segment at $28.6B vs. $8.5B in 2025, signaling concentration risk. KLA displays greater diversification; Defect Inspection anchors $6.2B but is supplemented by Service ($2.7B) and Patterning ($2.2B). Micron’s focus on memory chips risks cyclicality, while KLA’s balanced portfolio supports ecosystem lock-in in semiconductor equipment.
Strengths and Weaknesses Comparison
This table compares the Strengths and Weaknesses of Micron Technology, Inc. and KLA Corporation:
Micron Technology Strengths
- Diverse product lines in DRAM and NAND segments
- Strong net margin (22.8%) and ROE (15.8%)
- Favorable liquidity ratios with current ratio 2.52
- Low debt-to-assets at 18.5% indicates conservative leverage
- Balanced global presence with high US and Taiwan sales
KLA Corporation Strengths
- High profitability with net margin 33.4% and ROE 86.6%
- Strong ROIC (38%) well above WACC
- Excellent asset turnover and fixed asset efficiency
- Favorable liquidity and interest coverage despite higher leverage
- Diverse revenue streams including patterning and service segments
Micron Technology Weaknesses
- ROIC (12.1%) below WACC (22.1%) signals value destruction
- Low asset turnover ratios indicate inefficiency
- Dividend yield at 0.38% is unimpressive
- Neutral valuation multiples (PE 15.9, PB 2.5) show limited market premium
- Less diversified revenue across service and specialty segments
KLA Corporation Weaknesses
- High debt-to-equity (1.3) raises financial risk
- Elevated PE (29.3) and PB (25.4) suggest expensive valuation
- Dividend yield low at 0.76% despite high profitability
- WACC at 10.4% slightly unfavorable
- Moderate asset turnover (0.76) less than ideal
Micron’s strengths lie in solid profitability and conservative financial structure but face operational inefficiencies and value concerns. KLA excels in profitability and asset use but carries higher financial risk and valuation premiums. These contrasts highlight strategic trade-offs between operational focus and capital structure management.
The Moat Duel: Analyzing Competitive Defensibility
A structural moat protects long-term profits from relentless competitive erosion. Here’s how Micron and KLA defend their turf:
Micron Technology, Inc.: Cost Advantage in Memory Manufacturing
Micron’s moat stems from scale-driven cost advantages in DRAM and NAND production. Despite shedding value (ROIC below WACC), improving margins and rising profitability hint at moat restoration through advanced memory tech in 2026.
KLA Corporation: Precision Process Control Specialist
KLA’s moat hinges on intangible assets and technological leadership in semiconductor process control. With ROIC well above WACC and strong margin expansion, KLA actively creates value and leverages innovation to deepen dominance in 2026.
Cost Efficiency vs. Technological Leadership: The Moat Showdown
KLA commands a wider, more durable moat, consistently generating excess returns and expanding profitability. Micron’s cost advantage is challenged but shows signs of recovery. KLA is better positioned to defend and grow market share.
Which stock offers better returns?
Over the past year, both stocks demonstrate strong bullish momentum, with Micron Technology accelerating sharply and KLA Corporation showing solid gains amid higher volatility.
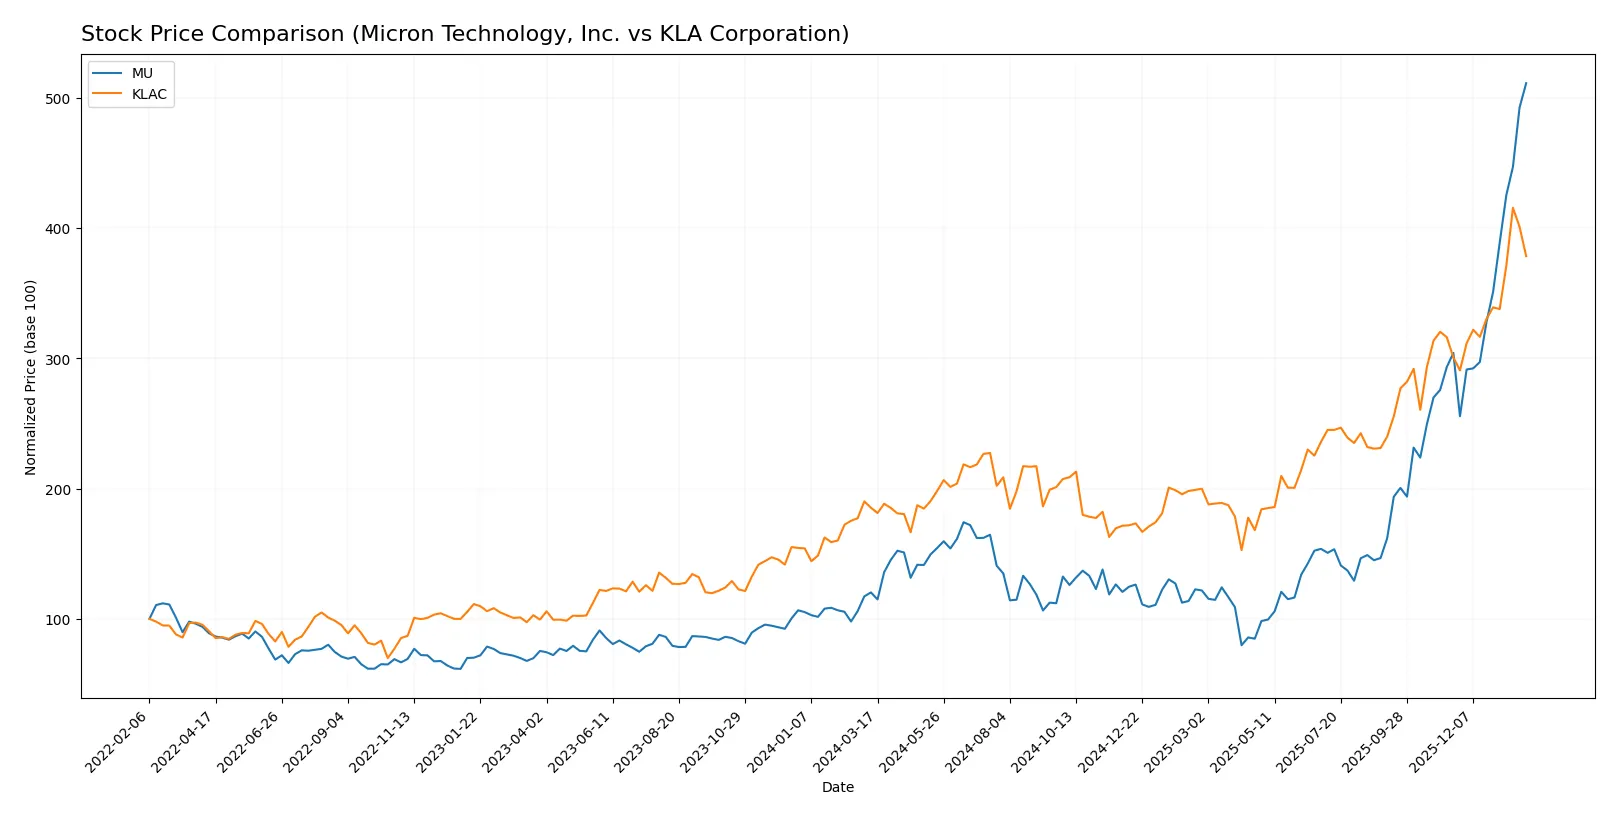
Trend Comparison
Micron Technology’s stock rose 325% over the last 12 months, showing clear acceleration and a high of 415. Its volatility is moderate with a 70.04 standard deviation.
KLA Corporation gained 104% in the same period, also accelerating but with greater volatility at 213.25 standard deviation. Its peak reached 1,568 before recent gains slowed.
Micron outperformed KLA substantially with a 325% return versus 104%, delivering the highest market performance despite lower volatility.
Target Prices
Analysts present a broad but constructive consensus on target prices for Micron Technology, Inc. and KLA Corporation.
| Company | Target Low | Target High | Consensus |
|---|---|---|---|
| Micron Technology, Inc. | 190 | 480 | 345.61 |
| KLA Corporation | 1400 | 1900 | 1672.25 |
The target consensus for Micron sits notably below its current price of 415, signaling cautious upside potential. KLA’s consensus target exceeds its current 1428 price, suggesting room for price recovery.

Don’t Let Luck Decide Your Entry Point
Optimize your entry points with our advanced ProRealTime indicators. You’ll get efficient buy signals with precise price targets for maximum performance. Start outperforming now!
How do institutions grade them?
The following tables summarize recent institutional grades for Micron Technology, Inc. and KLA Corporation:
Micron Technology, Inc. Grades
This table lists recent grades from reputable financial institutions for Micron Technology, Inc.
| Grading Company | Action | New Grade | Date |
|---|---|---|---|
| Mizuho | Maintain | Outperform | 2026-01-27 |
| TD Cowen | Maintain | Buy | 2026-01-20 |
| Stifel | Maintain | Buy | 2026-01-20 |
| Rosenblatt | Maintain | Buy | 2026-01-20 |
| Wells Fargo | Maintain | Overweight | 2026-01-15 |
| Citigroup | Maintain | Buy | 2026-01-15 |
| Cantor Fitzgerald | Maintain | Overweight | 2026-01-14 |
| B of A Securities | Maintain | Buy | 2026-01-13 |
| Keybanc | Maintain | Overweight | 2026-01-13 |
| Lynx Global | Maintain | Buy | 2026-01-12 |
KLA Corporation Grades
This table outlines recent grades from established grading firms for KLA Corporation.
| Grading Company | Action | New Grade | Date |
|---|---|---|---|
| Oppenheimer | Maintain | Outperform | 2026-01-30 |
| Barclays | Maintain | Overweight | 2026-01-30 |
| Cantor Fitzgerald | Maintain | Overweight | 2026-01-30 |
| Jefferies | Maintain | Buy | 2026-01-30 |
| Stifel | Maintain | Buy | 2026-01-30 |
| Wells Fargo | Maintain | Overweight | 2026-01-30 |
| Needham | Maintain | Buy | 2026-01-30 |
| RBC Capital | Maintain | Sector Perform | 2026-01-30 |
| Deutsche Bank | Maintain | Hold | 2026-01-21 |
| Needham | Maintain | Buy | 2026-01-20 |
Which company has the best grades?
Both companies receive strong support from analysts, predominantly Buy and Outperform ratings. Micron shows consistent Buy and Overweight grades, while KLA includes a wider range from Buy to Hold. Micron’s more uniform high grades may imply stronger confidence from analysts, potentially attracting investor interest.
Risks specific to each company
The following categories identify the critical pressure points and systemic threats facing both firms in the 2026 market environment:
1. Market & Competition
Micron Technology, Inc.
- Faces intense memory chip price volatility and cyclical demand shifts in semiconductors.
KLA Corporation
- Operates in niche process control markets but faces rising competition from emerging tech firms.
2. Capital Structure & Debt
Micron Technology, Inc.
- Maintains low debt levels (D/E 0.28), supporting financial flexibility.
KLA Corporation
- Higher leverage (D/E 1.3) raises financial risk despite strong interest coverage.
3. Stock Volatility
Micron Technology, Inc.
- Beta 1.503 indicates above-market volatility; stock price range wide (61.54–455.5).
KLA Corporation
- Beta 1.444 shows high sensitivity to market swings; wider price range (551.33–1693.35).
4. Regulatory & Legal
Micron Technology, Inc.
- Exposure to global trade policies affecting semiconductor exports.
KLA Corporation
- Subject to regulatory scrutiny in multiple jurisdictions for advanced technology sales.
5. Supply Chain & Operations
Micron Technology, Inc.
- Risks from semiconductor raw material shortages and manufacturing cycle pressures.
KLA Corporation
- Reliant on advanced manufacturing customers; disruptions could delay product deployment.
6. ESG & Climate Transition
Micron Technology, Inc.
- Increasing pressure to reduce energy-intensive memory production footprint.
KLA Corporation
- Faces challenges integrating sustainable practices in high-precision manufacturing.
7. Geopolitical Exposure
Micron Technology, Inc.
- Vulnerable to US-China tensions impacting supply chain and market access.
KLA Corporation
- Similarly exposed to geopolitical risks affecting semiconductor equipment sales globally.
Which company shows a better risk-adjusted profile?
Micron’s most impactful risk lies in cyclical market demand and price volatility in memory chips. KLA’s leverage and valuation multiples present significant financial risks. Despite KLA’s superior profitability and efficiency metrics, Micron’s lower debt and more moderate valuation suggest a more balanced risk-adjusted profile. Recent sharp stock declines underscore heightened sensitivity to sector cycles for both, but Micron’s stronger liquidity and safer capital structure provide a buffer against downturns.
Final Verdict: Which stock to choose?
Micron Technology’s superpower lies in its remarkable revenue and earnings growth momentum. It’s a cash generator riding a cyclical upswing, though its return on invested capital still lags cost of capital—a point of vigilance for value destruction risk. This stock suits an aggressive growth portfolio willing to weather volatility.
KLA Corporation’s moat derives from its durable competitive advantage in semiconductor process control, delivering high returns well above its capital costs. Its financial fortress and consistent profitability offer better stability than Micron. KLA fits a GARP portfolio, balancing growth with reasonable risk and premium valuation.
If you prioritize rapid expansion and can tolerate cyclical swings, Micron’s growth trajectory and improving profitability make it a compelling scenario. However, if you seek durable economic moats and superior capital efficiency, KLA outshines with greater stability despite commanding a valuation premium. Both warrant close monitoring of sector cycles and capital allocation discipline.
Disclaimer: Investment carries a risk of loss of initial capital. The past performance is not a reliable indicator of future results. Be sure to understand risks before making an investment decision.
Go Further
I encourage you to read the complete analyses of Micron Technology, Inc. and KLA Corporation to enhance your investment decisions: