Home > Comparison > Technology > KLAC vs MXL
The strategic rivalry between KLA Corporation and MaxLinear, Inc. shapes the semiconductor industry’s competitive landscape. KLA operates as a capital-intensive technology leader specializing in semiconductor process control and yield management. MaxLinear, by contrast, focuses on high-performance analog and mixed-signal communication SoCs, emphasizing connectivity solutions. This analysis explores their divergent operational models and competitive positioning to identify which company offers a superior risk-adjusted return for diversified portfolios amid evolving sector dynamics.
Table of contents
Companies Overview
KLA Corporation and MaxLinear, Inc. are key players shaping semiconductor technology and communications infrastructure.
KLA Corporation: Semiconductor Process Control Leader
KLA Corporation dominates the semiconductor sector with process control and yield management solutions. It generates revenue by providing inspection, metrology, and diagnostic tools that optimize integrated circuit manufacturing. In 2026, the company focuses on enhancing advanced wafer inspection and expanding specialty semiconductor processing technologies to sustain its competitive edge.
MaxLinear, Inc.: Communications SoC Specialist
MaxLinear, Inc. specializes in high-performance radiofrequency and mixed-signal system-on-chip (SoC) solutions for wired and wireless communications. Its revenue stems from integrated components powering broadband modems, routers, and 4G/5G infrastructure. In 2026, MaxLinear prioritizes innovation in end-to-end communication platforms and expanding its footprint in data center and network transport markets.
Strategic Collision: Similarities & Divergences
Both companies operate in semiconductors but diverge sharply: KLA pursues a process-driven, manufacturing optimization model, while MaxLinear focuses on system integration for communications networks. They compete indirectly across semiconductor innovation and connectivity technologies. Their investment profiles differ — KLA embodies scale and market dominance; MaxLinear aligns with niche growth in communications SoCs.
Income Statement Comparison
This data dissects the core profitability and scalability of both corporate engines to reveal who dominates the bottom line:
| Metric | KLA Corporation (KLAC) | MaxLinear, Inc. (MXL) |
|---|---|---|
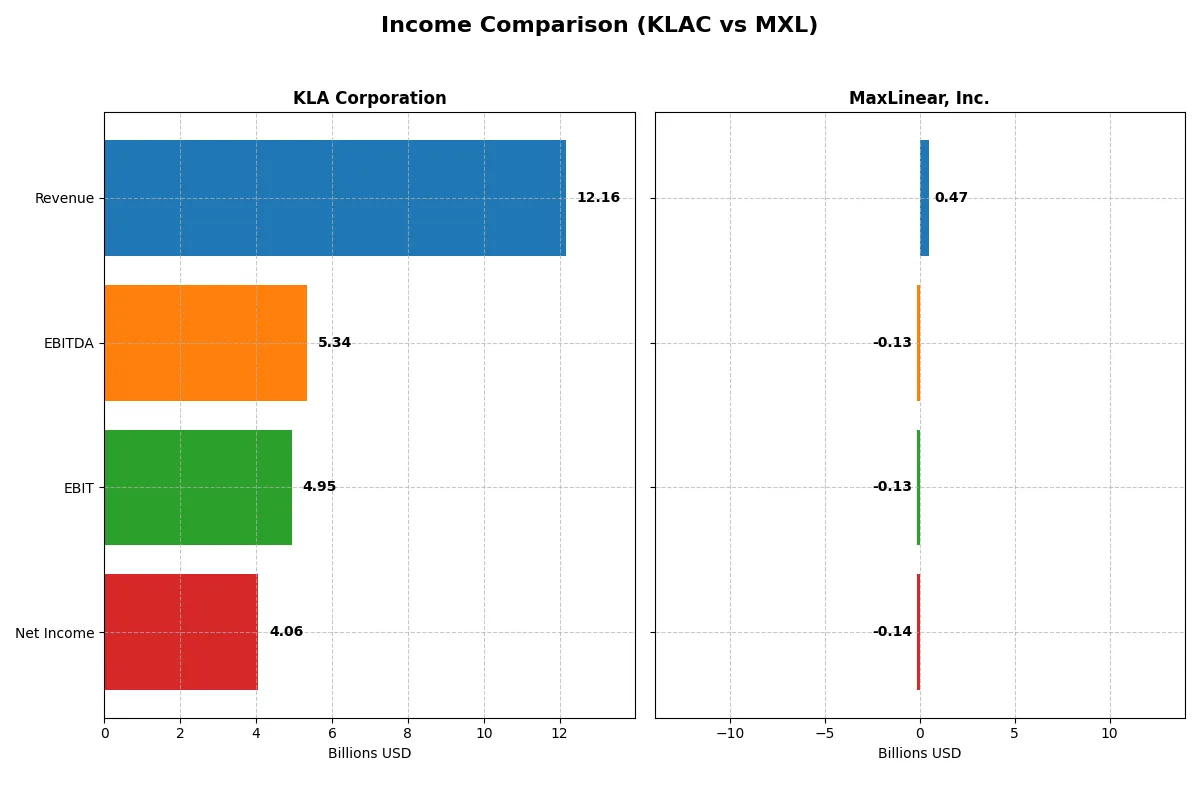
| Revenue | 12.2B | 468M |
| Cost of Revenue | 4.58B | 202M |
| Operating Expenses | 2.33B | 393M |
| Gross Profit | 7.58B | 266M |
| EBITDA | 5.34B | -131M |
| EBIT | 4.95B | -131M |
| Interest Expense | 302M | 10M |
| Net Income | 4.06B | -137M |
| EPS | 30.53 | -1.58 |
| Fiscal Year | 2025 | 2025 |
Income Statement Analysis: The Bottom-Line Duel
This income statement comparison reveals which company runs its business more efficiently and delivers stronger profitability.
KLA Corporation Analysis
KLA’s revenue surged from 6.9B in 2021 to 12.2B in 2025, almost doubling its top line. Net income expanded even faster, growing 95% over five years to 4.1B. The company sustains robust margins, with a gross margin of 62.3% and net margin of 33.4% in 2025. Efficiency gains show in a 41% jump in EBIT and nearly 50% EPS growth year-over-year.
MaxLinear, Inc. Analysis
MaxLinear’s revenue trajectory is volatile, peaking at 1.1B in 2022 before shrinking to 468M in 2025. The firm operates at a loss, with negative net income of 137M in 2025 despite a 30% revenue rise from the prior year. Gross margins remain decent at 56.8%, but EBIT and net margins are deeply negative, reflecting ongoing struggles to convert sales into profits. Recent margin improvements suggest some operational momentum.
Verdict: Robust Profitability vs. Recovery in Progress
KLA clearly outperforms MaxLinear with strong, consistent revenue and profit growth plus superior margin health. MaxLinear’s shrinking scale and persistent losses create significant risk despite signs of margin recovery. For investors prioritizing financial strength and efficiency, KLA’s profile offers a more compelling and stable earnings engine.
Financial Ratios Comparison
These vital ratios act as a diagnostic tool to expose the underlying fiscal health, valuation premiums, and capital efficiency of the companies analyzed:
| Ratios | KLA Corporation (KLAC) | MaxLinear, Inc. (MXL) |
|---|---|---|
| ROE | 86.6% | -47.5% |
| ROIC | 38.0% | -24.3% |
| P/E | 29.3 | -6.7 |
| P/B | 25.4 | 3.20 |
| Current Ratio | 2.62 | 1.77 |
| Quick Ratio | 1.83 | 1.28 |
| D/E (Debt-to-Equity) | 1.30 | 0.29 |
| Debt-to-Assets | 37.9% | 17.2% |
| Interest Coverage | 17.3 | -15.5 |
| Asset Turnover | 0.76 | 0.42 |
| Fixed Asset Turnover | 9.70 | 4.65 |
| Payout ratio | 22.3% | 0% |
| Dividend yield | 0.76% | 0% |
| Fiscal Year | 2025 | 2024 |
Efficiency & Valuation Duel: The Vital Signs
Financial ratios serve as a company’s DNA, unveiling hidden risks and operational strengths that drive investor decisions.
KLA Corporation
KLA demonstrates exceptional profitability with an 86.6% ROE and a robust 33.4% net margin, signaling strong operational efficiency. However, the stock trades at a stretched P/E of 29.3 and a high P/B of 25.4, reflecting elevated valuation levels. Dividend yield remains low at 0.76%, suggesting a focus on reinvestment in R&D for growth.
MaxLinear, Inc.
MaxLinear struggles with a negative ROE of -47.5% and a severe net margin loss of -68.0%, indicating operational challenges and inefficiency. The company’s P/E is negative, but its P/B of 3.2 is more reasonable. It pays no dividends, instead allocating a significant portion of revenue to R&D, aiming to recover and grow.
Premium Valuation vs. Operational Struggles
KLA offers superior profitability and operational strength but at a premium valuation, while MaxLinear faces significant losses and risks despite lower valuation multiples. Investors seeking stability may prefer KLA’s profile, whereas those with higher risk tolerance might consider MaxLinear’s turnaround potential.
Which one offers the Superior Shareholder Reward?
I see KLA Corporation (KLAC) provides a more attractive shareholder reward than MaxLinear, Inc. (MXL) in 2026. KLAC delivers a modest dividend yield near 0.76% with a sustainable payout ratio around 22%. Its free cash flow comfortably covers dividends, signaling financial discipline. KLAC also aggressively repurchases shares, enhancing shareholder value. In contrast, MXL pays no dividends, suffers negative margins, and shows no buyback activity, reflecting reinvestment risks and operational challenges. Historically, KLAC’s balanced distribution and capital allocation outpace MXL’s high growth speculation. I conclude KLAC offers a superior total return profile with lower risk and stronger cash flow sustainability.
Comparative Score Analysis: The Strategic Profile
The radar chart reveals the fundamental DNA and trade-offs of KLA Corporation and MaxLinear, Inc., highlighting their contrasting financial strengths and weaknesses:
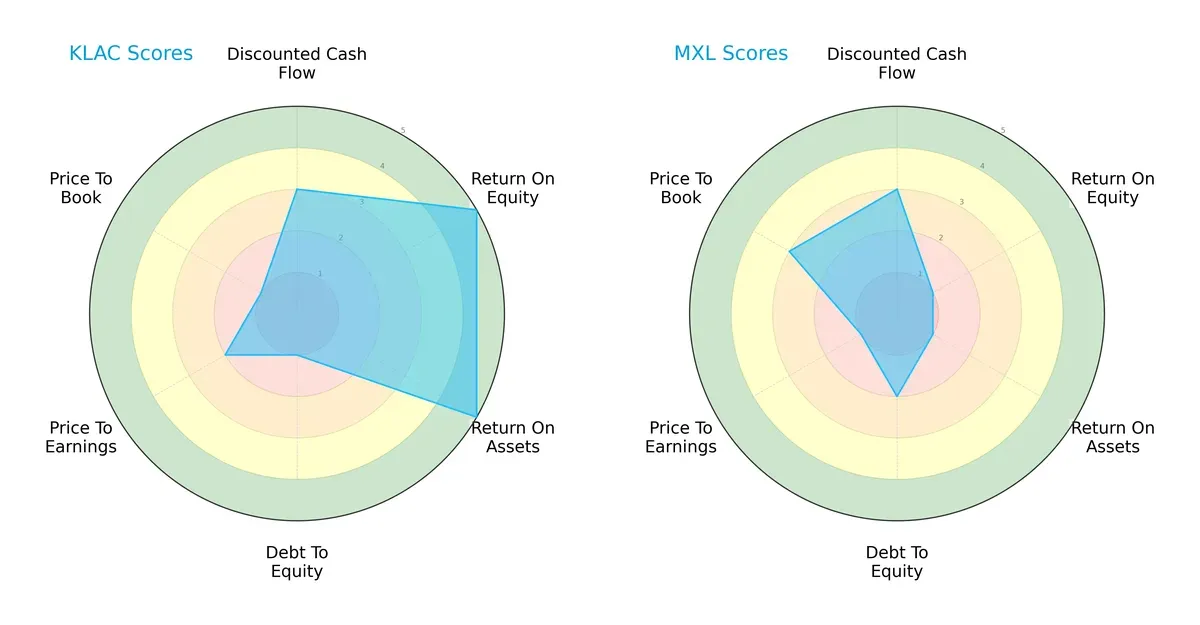
KLA dominates in profitability metrics with top ROE and ROA scores of 5, signaling efficient capital and asset use. MaxLinear lags significantly here, scoring just 1 on both. KLA’s balance sheet risk is high with a debt-to-equity score of 1, while MaxLinear fares moderately better at 2. Valuation scores favor MaxLinear in price-to-book (3 vs. 1), suggesting it may be undervalued relative to book value. Overall, KLA presents a more balanced profile driven by operational excellence, whereas MaxLinear relies on valuation appeal amid weaker profitability.
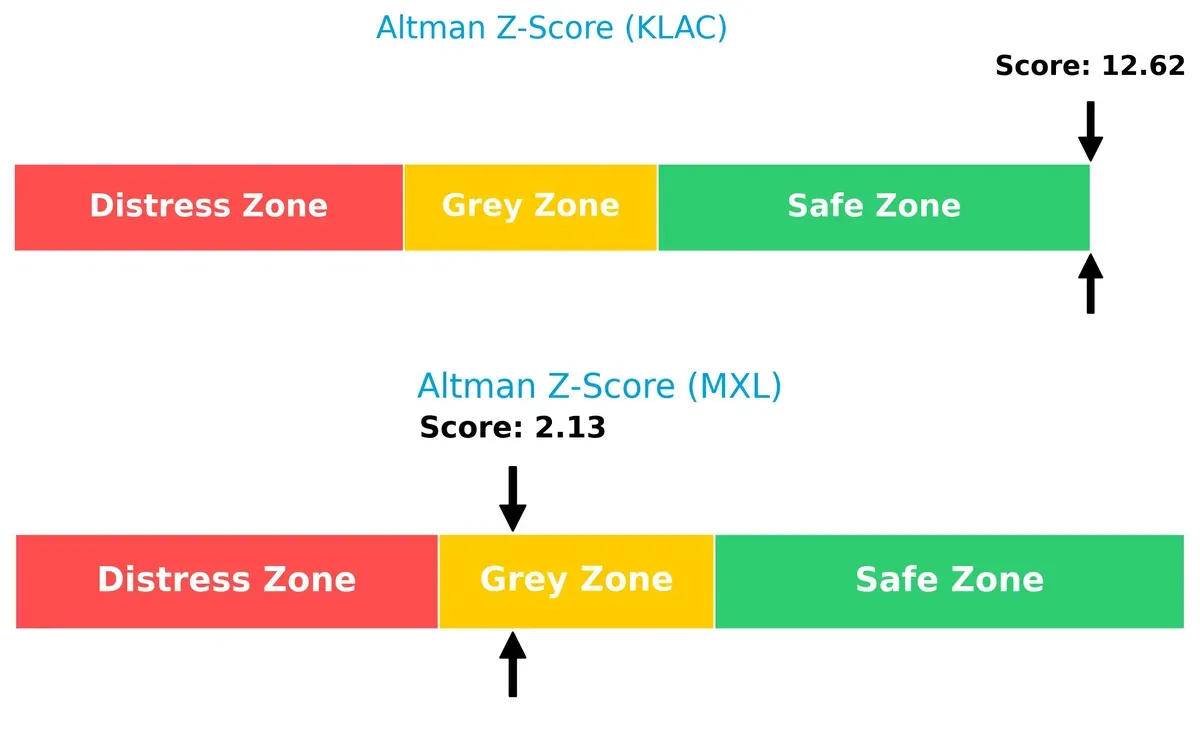
Bankruptcy Risk: Solvency Showdown
KLA’s Altman Z-Score of 12.6 places it firmly in the safe zone, implying strong long-term survival prospects. MaxLinear’s 2.13 score situates it in the grey zone, signaling moderate financial distress risk in this cycle:
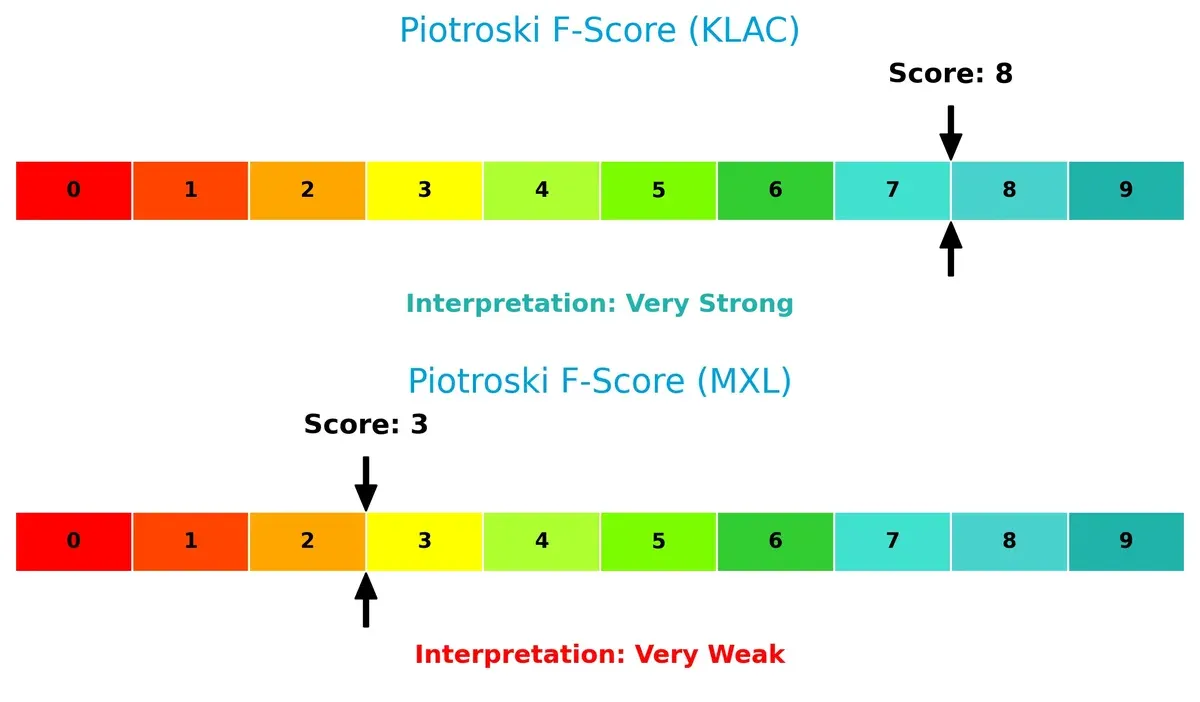
Financial Health: Quality of Operations
KLA’s Piotroski F-Score of 8 reflects very strong financial health and robust internal metrics. MaxLinear’s score of 3 raises red flags about operational weaknesses and potential value traps:
How are the two companies positioned?
This section dissects the operational DNA of KLAC and MXL by comparing their revenue distribution by segment alongside internal strengths and weaknesses. The goal is to confront their economic moats and identify which business model offers the most resilient and sustainable competitive advantage today.
Revenue Segmentation: The Strategic Mix
This comparison dissects how KLA Corporation and MaxLinear, Inc. diversify their income streams and highlights their primary sector bets:
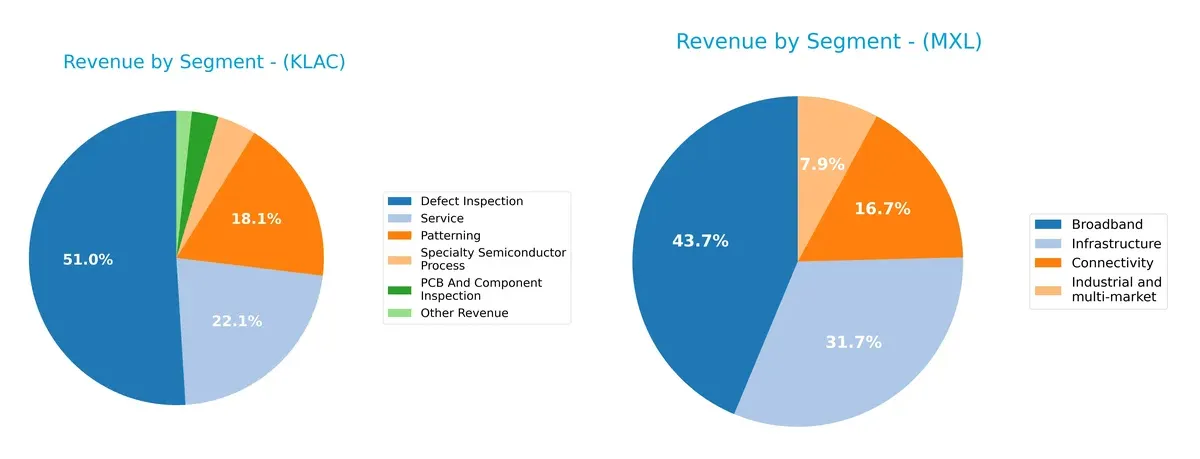
KLA leans heavily on Defect Inspection, which dwarfs other segments at $6.2B in 2025, anchoring its revenue. It also spans Patterning ($2.2B) and Service ($2.7B), showing solid diversification within semiconductor process technologies. MaxLinear’s 2025 revenue splits more evenly, led by Broadband at $204M but with meaningful contributions from Infrastructure ($148M) and Connectivity ($78M). MaxLinear’s mix suggests broader market exposure but lacks KLA’s deep segment dominance, exposing it to higher competitive risk.
Strengths and Weaknesses Comparison
This table compares the strengths and weaknesses of KLA Corporation and MaxLinear, Inc.:
KLA Corporation Strengths
- High net margin at 33.41%
- Strong ROE of 86.56%
- Robust ROIC of 37.97%
- Favorable current and quick ratios
- Significant global presence including China and Taiwan
- Diverse revenue streams including defect inspection and services
MaxLinear, Inc. Strengths
- Favorable PE ratio despite losses
- Low debt-to-equity ratio at 0.29
- Favorable current and quick ratios
- Diverse product segments including broadband and infrastructure
- Geographic revenue from Asia and Rest of World
- Moderate fixed asset turnover at 4.65
KLA Corporation Weaknesses
- High PE and PB ratios considered unfavorable
- Elevated debt-to-equity ratio at 1.3
- WACC exceeds ROIC indicating capital cost concerns
- Low dividend yield at 0.76%
- Neutral asset turnover at 0.76
MaxLinear, Inc. Weaknesses
- Negative net margin at -68.01%
- Negative ROE and ROIC indicating unprofitability
- Unfavorable interest coverage ratio at -13.01
- Unfavorable asset turnover at 0.42
- Zero dividend yield
- Geographic concentration lacks detailed diversity
KLA’s strengths lie in profitability and global reach, but valuation and capital structure pose risks. MaxLinear shows financial stress despite operational diversification. Both firms face specific challenges impacting their strategic positioning.
The Moat Duel: Analyzing Competitive Defensibility
A structural moat shields long-term profits from relentless competition erosion. Its nature defines sustainable success in semiconductor markets:
KLA Corporation: Precision Process Control Moat
KLA’s moat stems from specialized process control technology and integrated inspection systems. It delivers high ROIC above WACC, reflecting stable margins and value creation. New IC manufacturing trends in 2026 could deepen this moat further.
MaxLinear, Inc.: Emerging SoC Cost Advantage
MaxLinear relies on cost-effective, integrated communication SoCs, contrasting KLA’s precision focus. However, declining ROIC signals weakening competitive positioning. Growth in 5G and broadband may offer expansion, but profitability remains pressured.
Moat Battle: Precision Control vs. Cost-Driven Scale
KLA possesses a deeper, durable moat with rising ROIC and consistent value creation. MaxLinear’s declining returns signal a fragile moat, making KLA better equipped to defend and expand its semiconductor market share.
Which stock offers better returns?
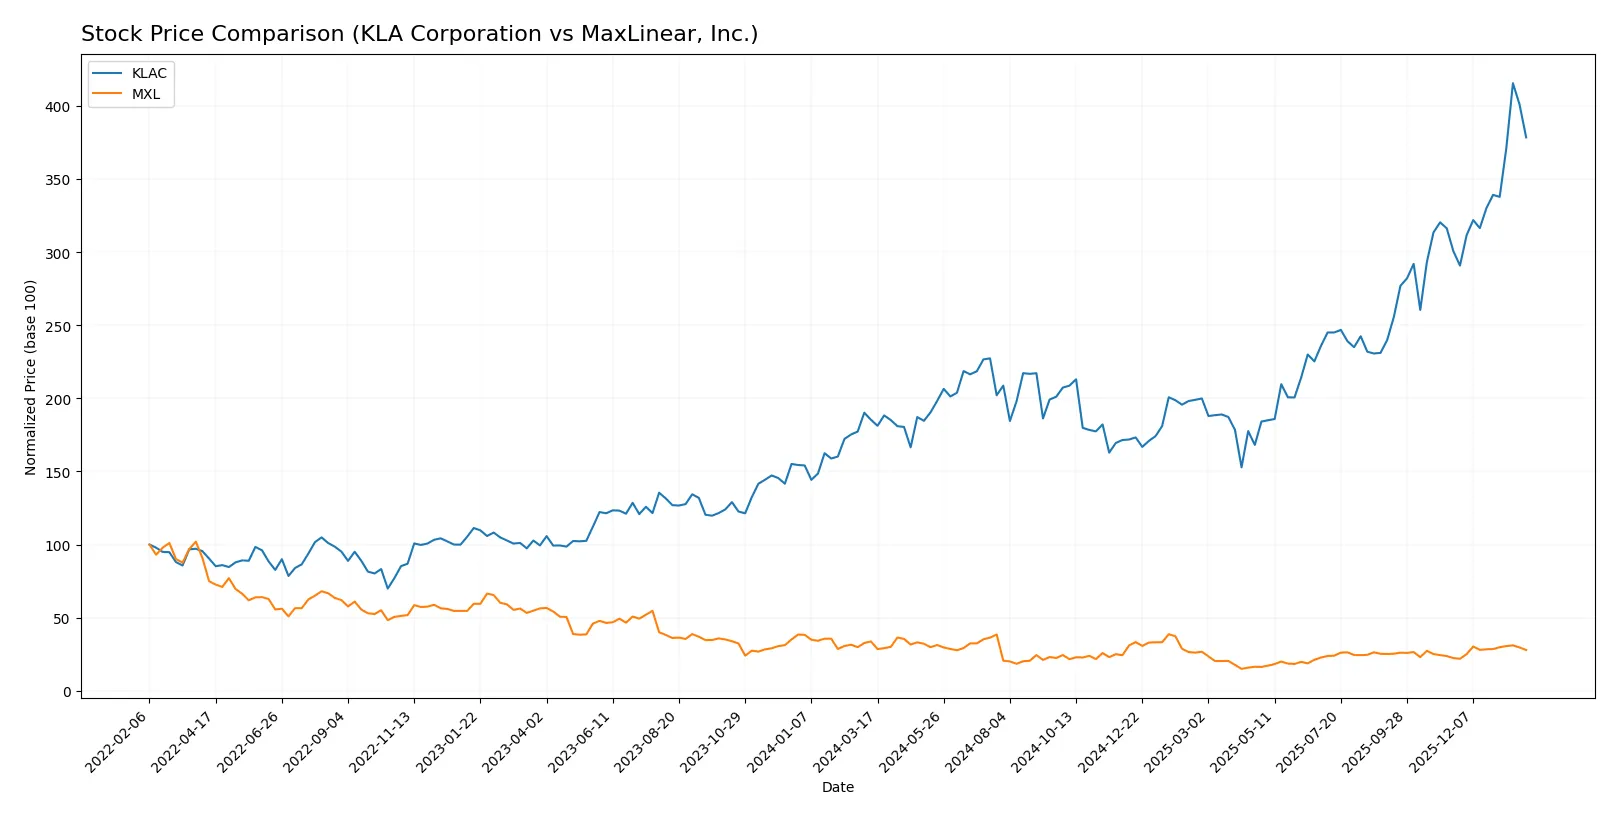
The past year reveals stark contrast in price trajectories: KLA Corporation surged over 100%, showing strong upward momentum, while MaxLinear, Inc. declined notably before recent partial recovery.
Trend Comparison
KLA Corporation’s stock rose 104.22% over the past 12 months, confirming a bullish trend with accelerating gains and high volatility, reaching a peak at 1567.82.
MaxLinear, Inc. experienced a 17.26% decline over the same period, indicating a bearish trend despite recent modest gains and low price volatility.
KLA clearly outperformed MaxLinear, delivering the highest market returns with sustained acceleration and significant price appreciation.
Target Prices
Analysts present a moderate bullish consensus for KLA Corporation and MaxLinear, Inc.
| Company | Target Low | Target High | Consensus |
|---|---|---|---|
| KLA Corporation | 1400 | 1900 | 1672.25 |
| MaxLinear, Inc. | 15 | 25 | 21 |
KLA’s target consensus at 1672.25 suggests upside from the current 1427.94 price, signaling confidence despite recent volatility. MaxLinear’s consensus target of 21 exceeds its 17.35 price, indicating expectations of recovery within the semiconductor sector.

Don’t Let Luck Decide Your Entry Point
Optimize your entry points with our advanced ProRealTime indicators. You’ll get efficient buy signals with precise price targets for maximum performance. Start outperforming now!
How do institutions grade them?
KLA Corporation Grades
The following table shows recent institutional grades for KLA Corporation:
| Grading Company | Action | New Grade | Date |
|---|---|---|---|
| Oppenheimer | Maintain | Outperform | 2026-01-30 |
| Barclays | Maintain | Overweight | 2026-01-30 |
| Cantor Fitzgerald | Maintain | Overweight | 2026-01-30 |
| Jefferies | Maintain | Buy | 2026-01-30 |
| Stifel | Maintain | Buy | 2026-01-30 |
| Wells Fargo | Maintain | Overweight | 2026-01-30 |
| Needham | Maintain | Buy | 2026-01-30 |
| RBC Capital | Maintain | Sector Perform | 2026-01-30 |
| Deutsche Bank | Maintain | Hold | 2026-01-21 |
| Needham | Maintain | Buy | 2026-01-20 |
MaxLinear, Inc. Grades
The following table shows recent institutional grades for MaxLinear, Inc.:
| Grading Company | Action | New Grade | Date |
|---|---|---|---|
| Wells Fargo | Maintain | Equal Weight | 2026-01-30 |
| Benchmark | Maintain | Buy | 2026-01-16 |
| Benchmark | Maintain | Buy | 2025-10-24 |
| Benchmark | Maintain | Buy | 2025-10-17 |
| Benchmark | Maintain | Buy | 2025-09-02 |
| Loop Capital | Maintain | Hold | 2025-08-04 |
| Wells Fargo | Maintain | Equal Weight | 2025-07-24 |
| Benchmark | Maintain | Buy | 2025-07-24 |
| Susquehanna | Maintain | Neutral | 2025-07-24 |
| Susquehanna | Maintain | Neutral | 2025-07-22 |
Which company has the best grades?
KLA Corporation consistently earns higher grades such as Outperform, Overweight, and Buy. MaxLinear, Inc. mostly receives Buy and Equal Weight ratings. KLA’s stronger grades suggest more positive analyst sentiment, potentially attracting more institutional interest.
Risks specific to each company
The following categories identify the critical pressure points and systemic threats facing both firms in the 2026 market environment:
1. Market & Competition
KLA Corporation
- Dominates semiconductor process control with strong market cap and product integration. Faces intense competition in advanced chip inspection.
MaxLinear, Inc.
- Operates in niche RF and mixed-signal SoCs but struggles with profitability and scaling in a fragmented market.
2. Capital Structure & Debt
KLA Corporation
- Higher debt-to-equity ratio (1.3) signals elevated leverage risk despite strong interest coverage (16.37).
MaxLinear, Inc.
- Low debt-to-equity (0.29) offers financial flexibility but negative interest coverage (-13.01) raises solvency concerns.
3. Stock Volatility
KLA Corporation
- Beta 1.44 indicates moderate volatility; large market cap buffers shocks.
MaxLinear, Inc.
- Higher beta 1.77 heightens share price volatility risk amid weaker fundamentals.
4. Regulatory & Legal
KLA Corporation
- Subject to global semiconductor export controls and IP regulation risks.
MaxLinear, Inc.
- Faces similar regulatory pressures with additional risks in wireless communications standards compliance.
5. Supply Chain & Operations
KLA Corporation
- Integrated global supply chain sensitive to semiconductor shortages and geopolitical tensions.
MaxLinear, Inc.
- Smaller scale makes supply chain disruptions more impactful; reliant on third-party manufacturing partners.
6. ESG & Climate Transition
KLA Corporation
- Increasing ESG focus with material process controls; potential transition risk but ongoing adaptation.
MaxLinear, Inc.
- ESG initiatives less documented; risk of lagging peers in climate transition efforts.
7. Geopolitical Exposure
KLA Corporation
- High exposure to US-China tensions affecting semiconductor equipment exports.
MaxLinear, Inc.
- Moderate exposure due to diversified end markets but vulnerable in wireless infrastructure supply chains.
Which company shows a better risk-adjusted profile?
KLA’s primary risk lies in elevated leverage amid a complex geopolitical landscape. MaxLinear struggles with operational losses and negative interest coverage, signaling financial instability. Despite market volatility, KLA’s robust profitability and financial health deliver a superior risk-adjusted profile. The stark contrast in Altman Z-Scores—KLA’s 12.6 (safe zone) vs. MaxLinear’s 2.1 (grey zone)—underscores my concern over MaxLinear’s solvency risks.
Final Verdict: Which stock to choose?
KLA Corporation’s superpower lies in its durable competitive advantage, demonstrated by a consistently growing ROIC well above its cost of capital. It operates as a cash machine with robust profitability and efficient capital allocation. A point of vigilance is its elevated debt-to-equity ratio, which could add financial risk during downturns. This stock suits aggressive growth portfolios seeking long-term value creation.
MaxLinear, Inc. offers a strategic moat through its focus on specialized semiconductor markets and recurring R&D investments. Relative to KLA, it presents a more conservative balance sheet with lower leverage but struggles with profitability and value destruction. This profile aligns with investors favoring growth at a reasonable price (GARP) with a tolerance for operational recovery.
If you prioritize sustainable profitability and a proven economic moat, KLA outshines as the compelling choice due to its strong value creation and market leadership. However, if you seek potential turnaround opportunities with lower financial risk, MaxLinear offers better stability despite its current challenges. Each scenario demands careful risk assessment aligned with your investment horizon.
Disclaimer: Investment carries a risk of loss of initial capital. The past performance is not a reliable indicator of future results. Be sure to understand risks before making an investment decision.
Go Further
I encourage you to read the complete analyses of KLA Corporation and MaxLinear, Inc. to enhance your investment decisions: